In this tutorial, we’ll learn how to blend data on Looker Studio, and we’ll see step-by-step examples of how to do it.
We made a video that will show you how to do it:
What is data blending?
Data blending is the process of merging two or more tables from the same or multiple sources. This allows you to create custom tables and calculations
When we create reports in Google Looker Studio, it is very common to want to combine different data sources to create more complete visualizations.
One example is the total amount spent on ads from Google Ads and Facebook Ads or combining Google Analytics and our CRM to analyze web conversions vs. leads.
Another case is joining the same data source to make new combinations that would not be possible without that join. For example, joining the same Google Analytics 4 account to see active users at 7 days, 15 days, and 30 days in the same table.
Previously, Looker Studio only allowed combining data using a left outer join, but with the latest update in February 2022, we can now use 5 different types of joins.
How to blend data on Looker Studio?
The fastest way of combining data: using tables
This process is also called one-click data blending and it allows you to perform a combination in 3 steps:
Step 1: Create two tables with the data sources you want to combine. Remember that you must have the same field to join both tables (join key), one of the most used is the date.
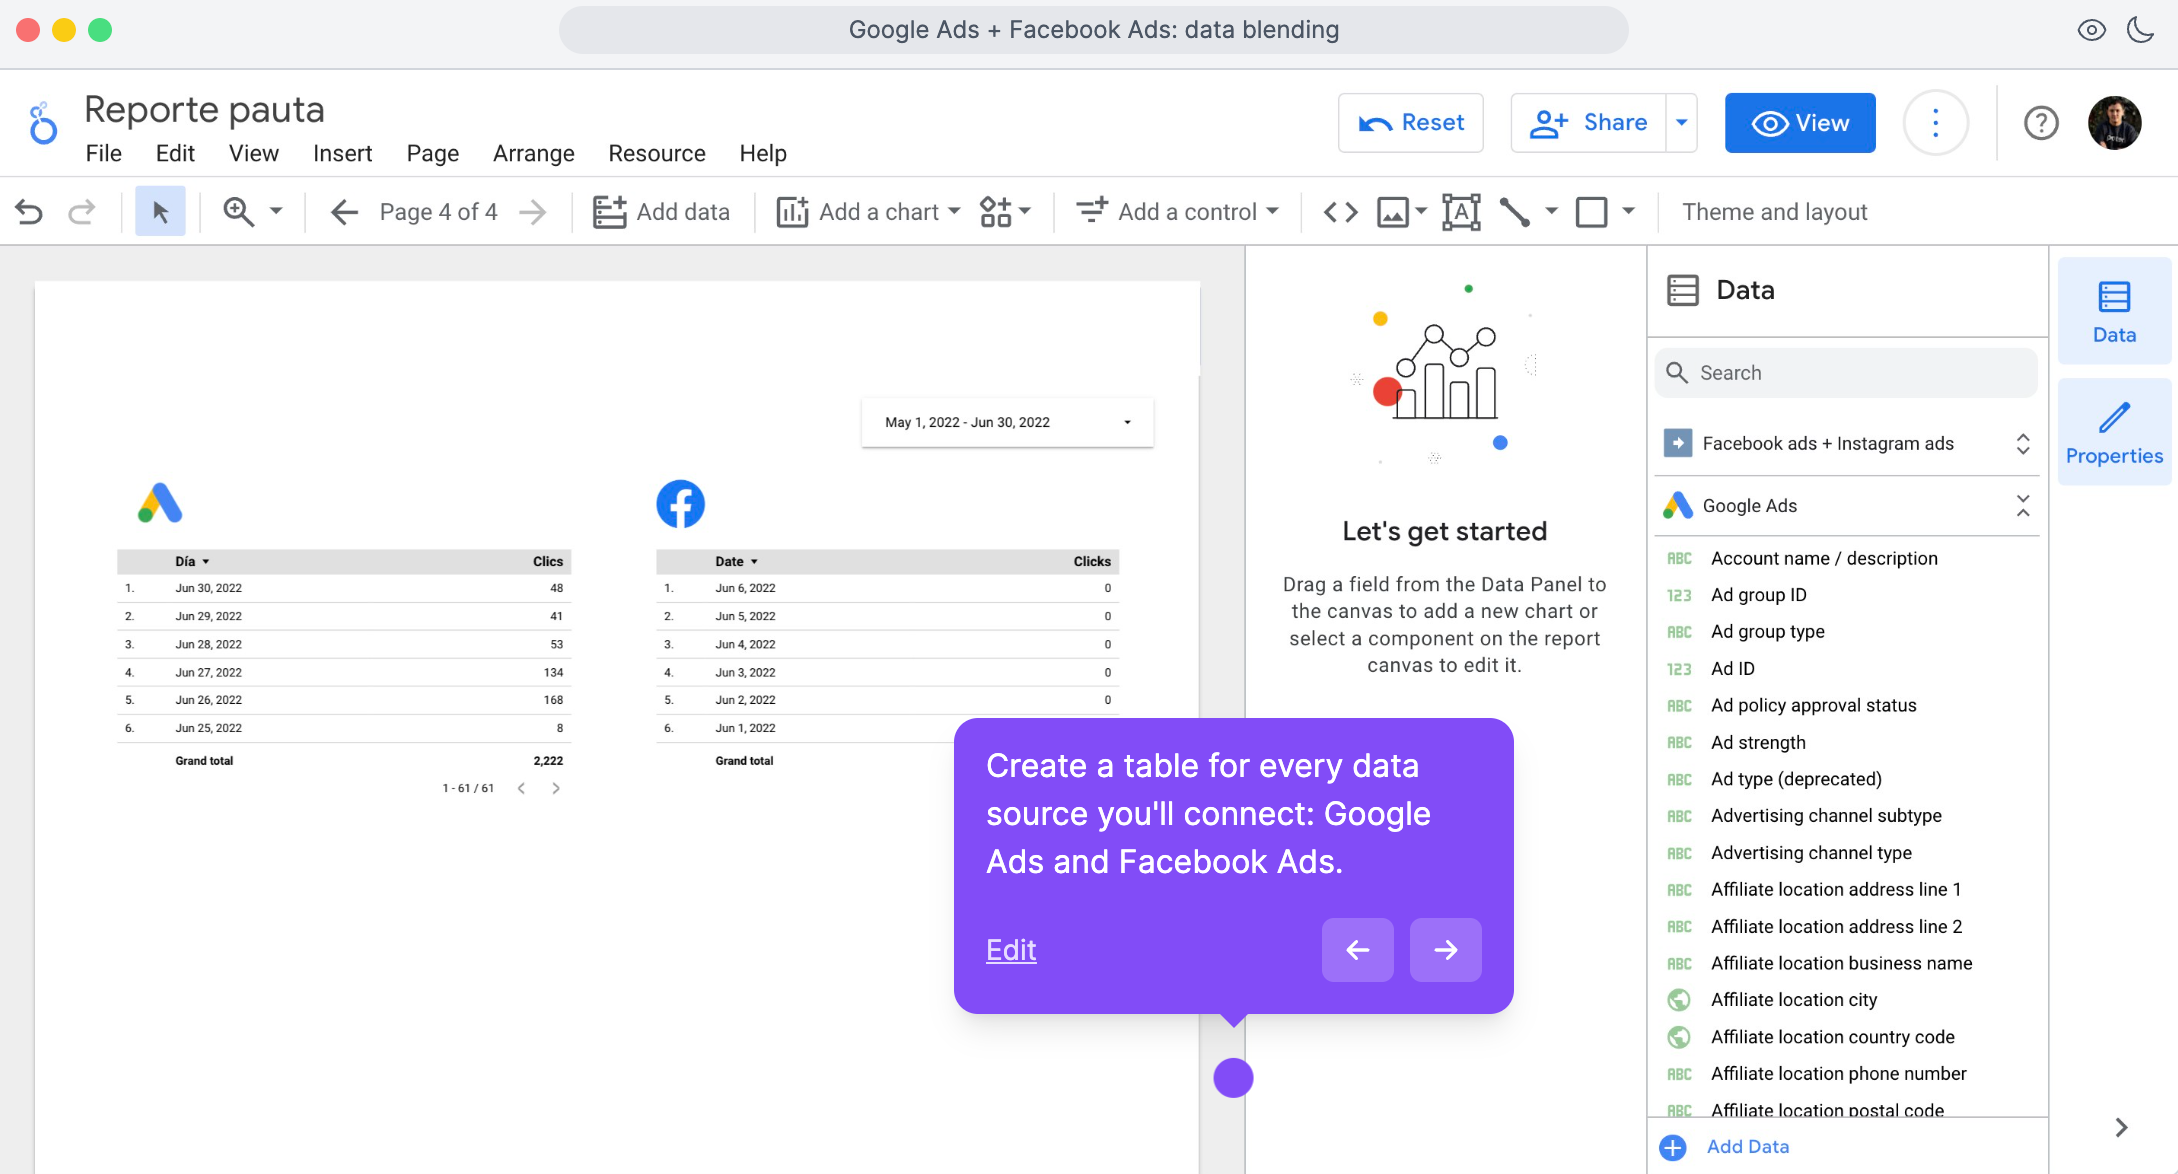
In this case, I’m using Google Ads and Facebook Ads.
Step 2: Now select both tables (SHIFT + CLICK) and right-click. Then select the option that says combine data
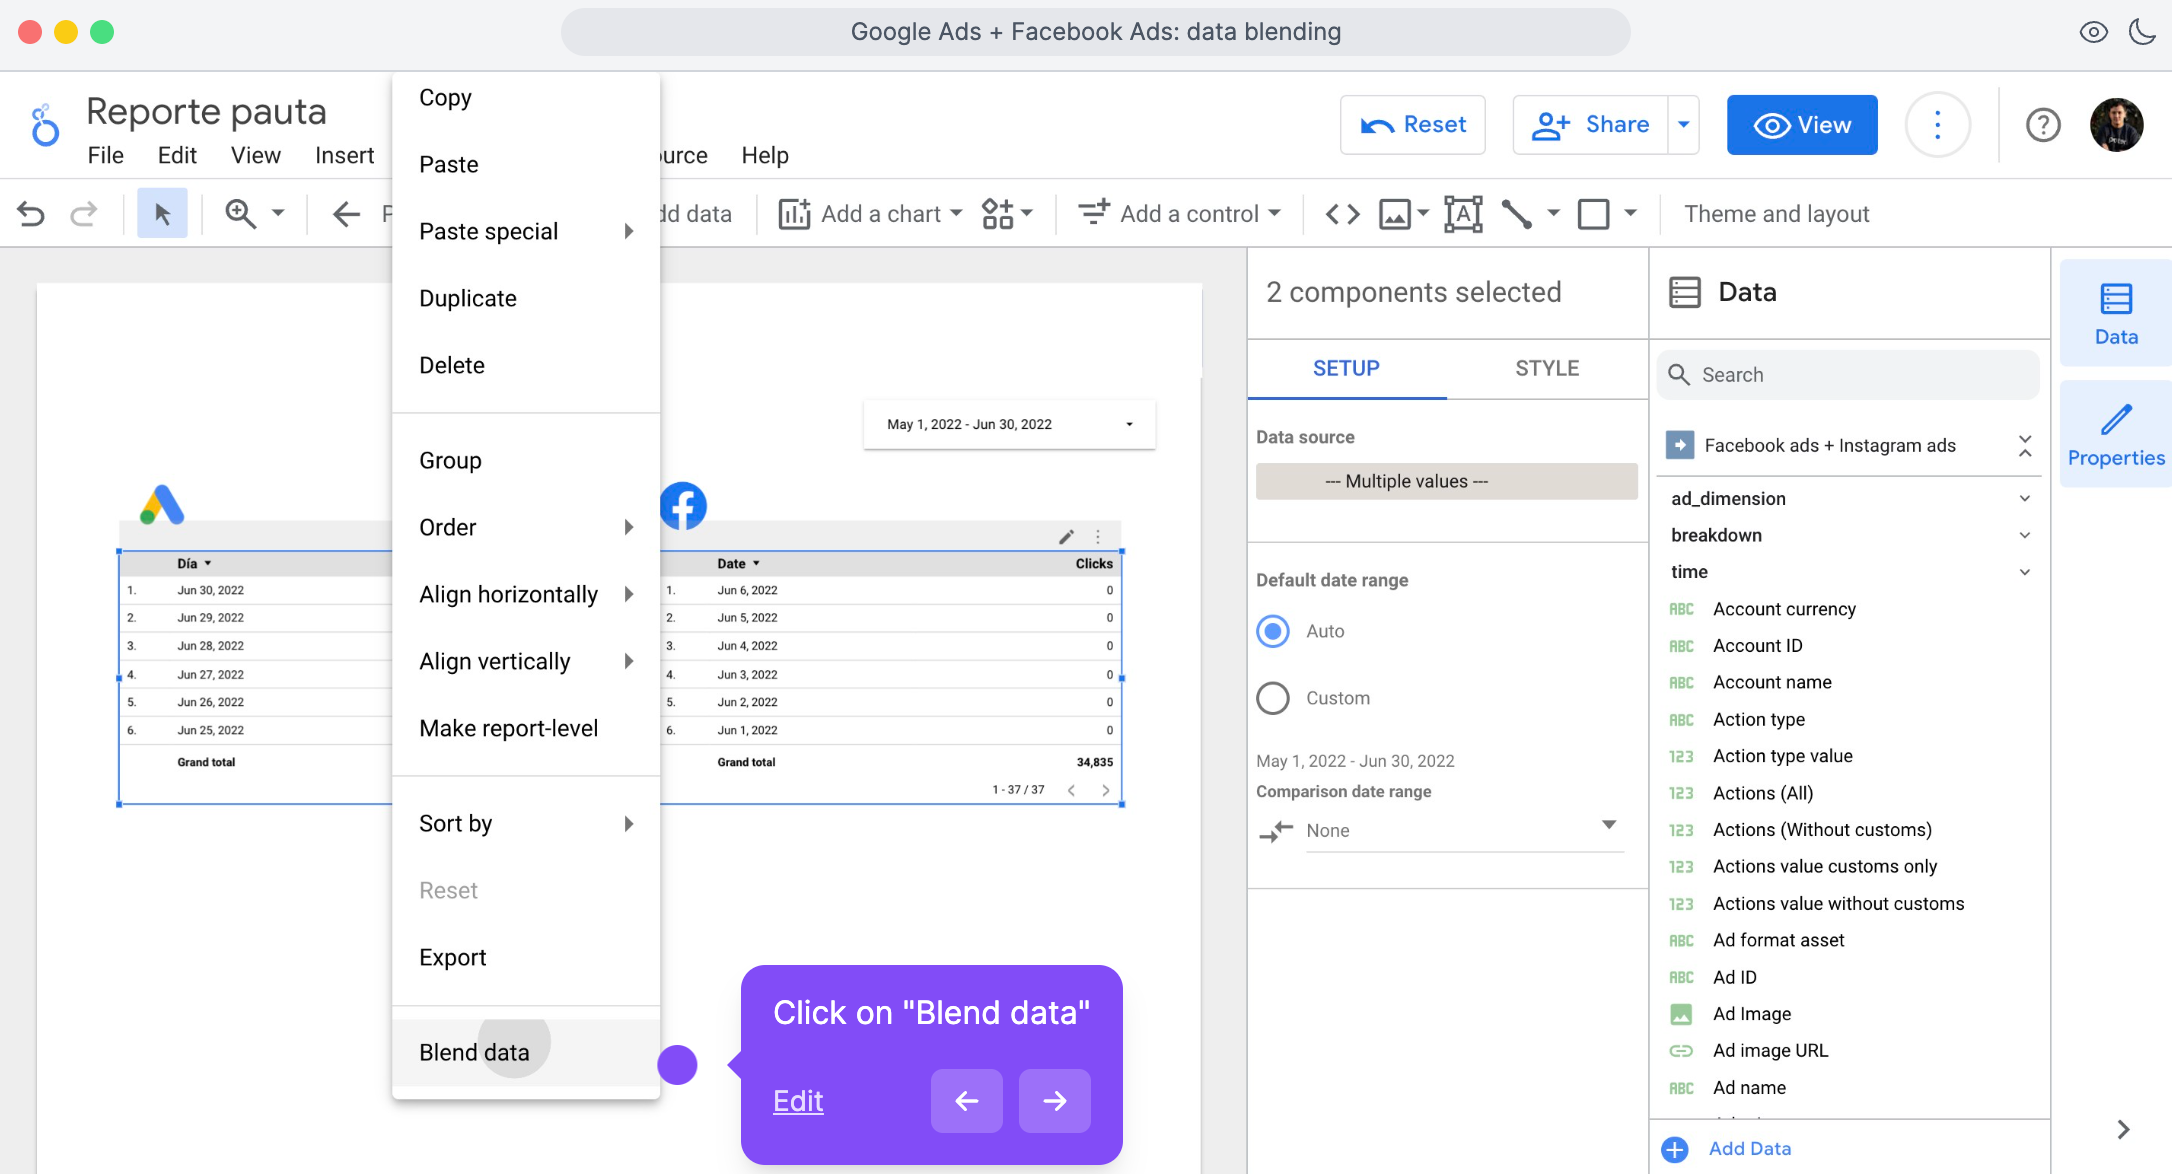
Now you will have a table like this:
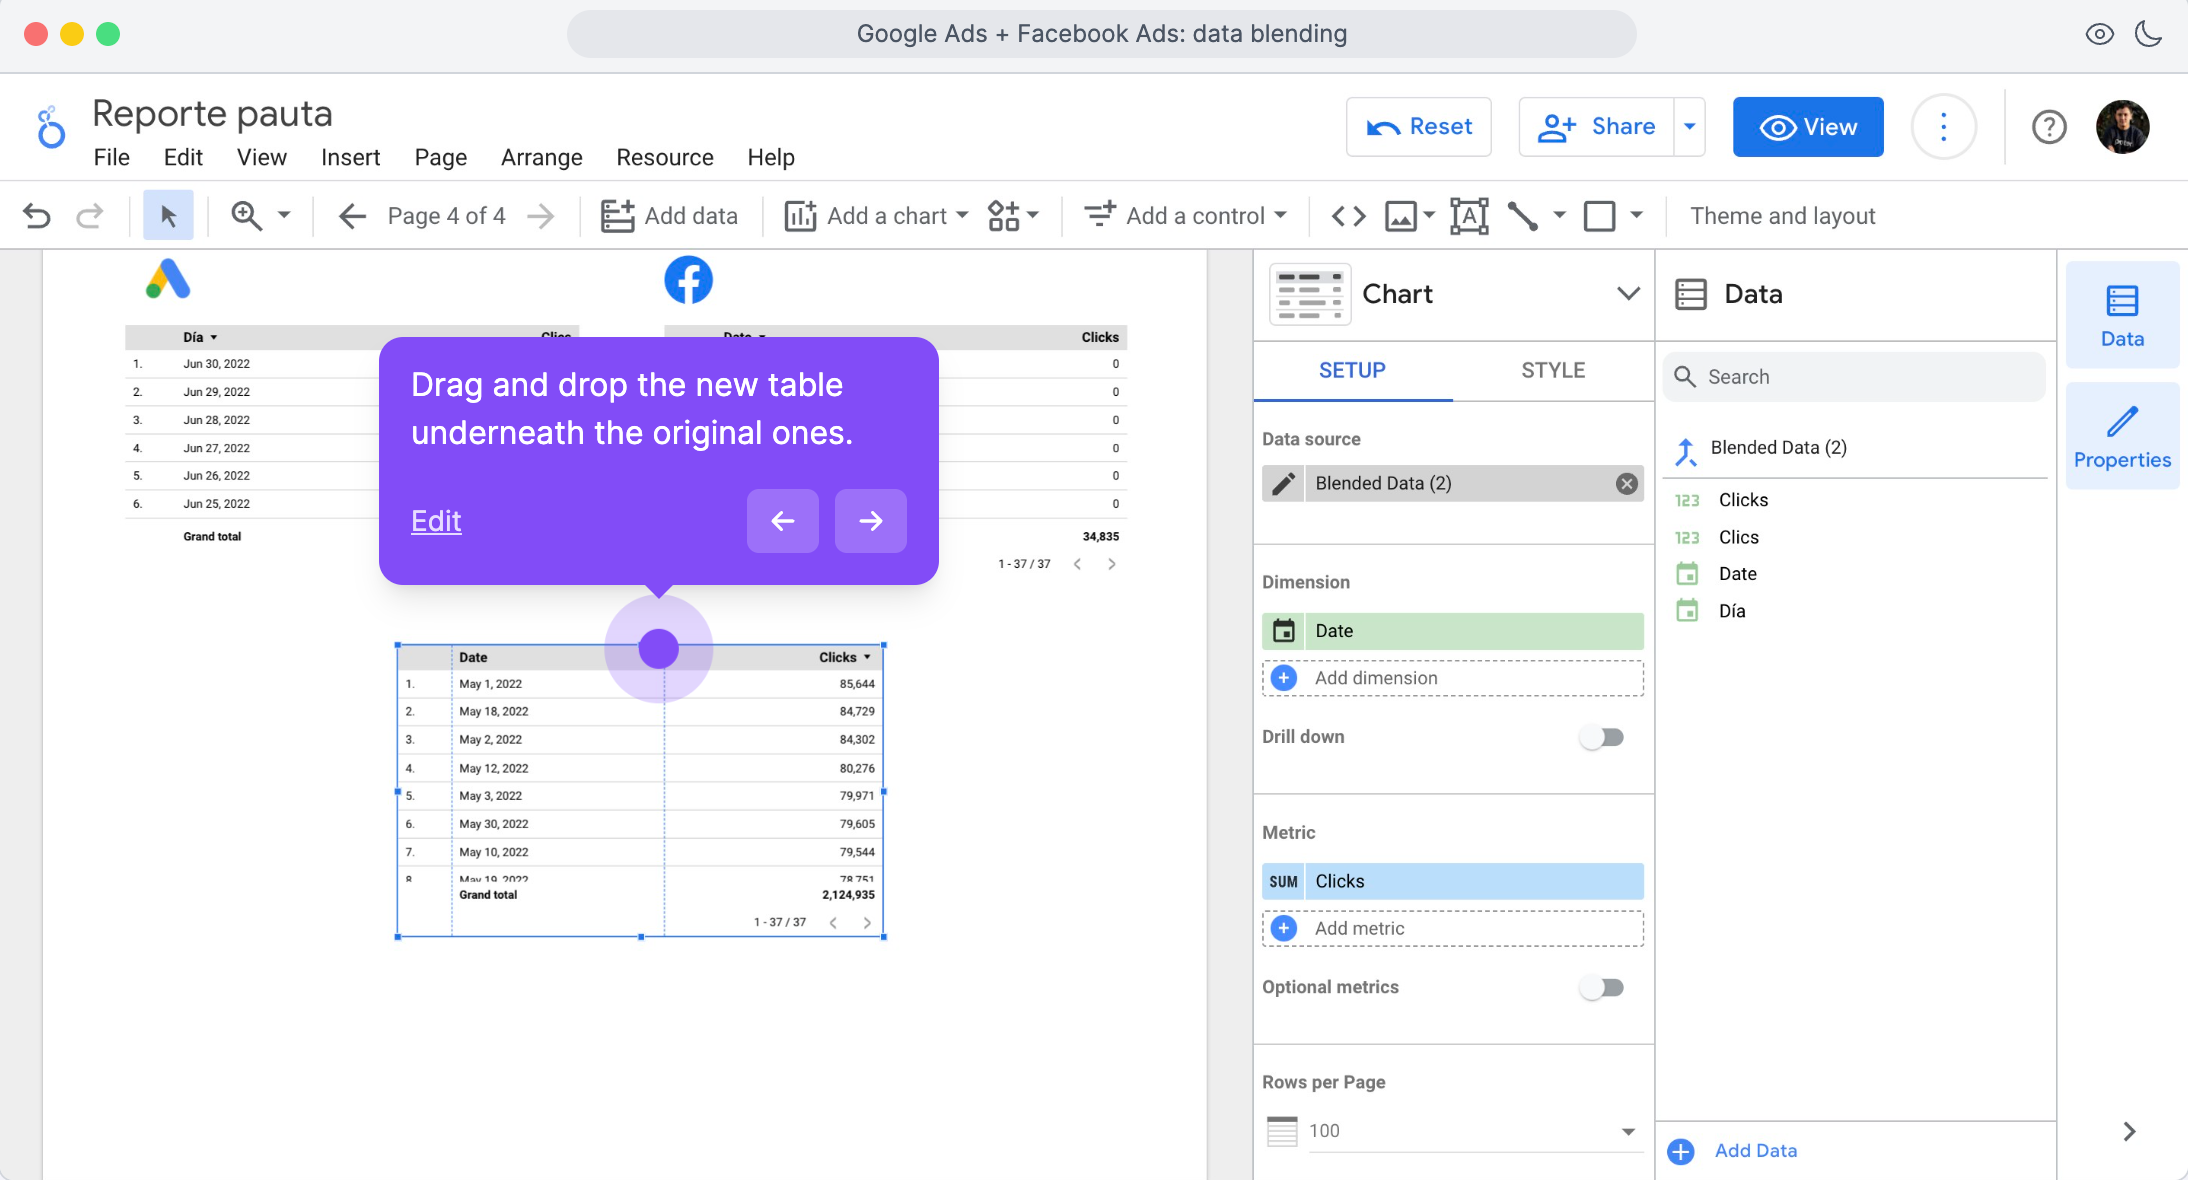
By clicking on the table, you will see that in the configuration, a panel appears with the metrics and dimensions of the chart and the data source that is now called ‘Blended Data’.
You can edit the blended data source to change the join operator and add additional dimensions or metrics to your table.
Step-by-step data blending in Looker Studio
This alternative takes a bit longer, but it lets you configure everything from the beginning.
Let’s do an example by combining Google Search Console and Google Analytics 4.
I recommend that you have all the data sources you want to join added as data sources to the report.
To do this, click on Resource > Manage added data sources > Add a data source > Select the data source and follow the step-by-step instructions to make the connection.
When you have all the connections ready, you can start combining them:
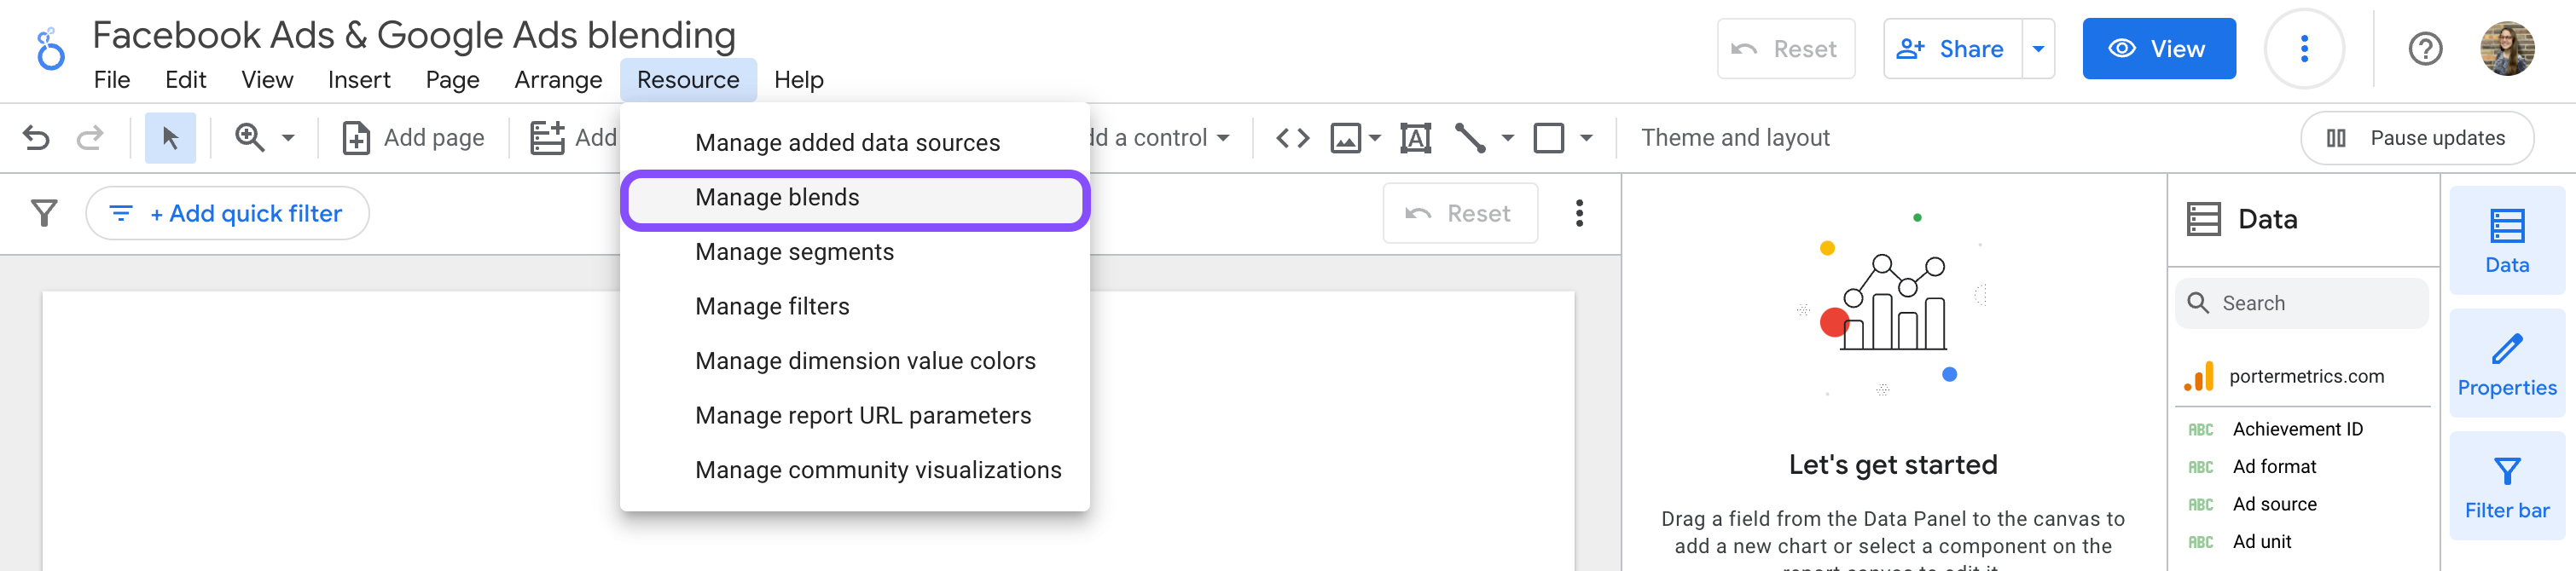
Click on ‘Resource
Select the option ‘Manage blends’
The first thing you will see is the first data source you have connected, which is automatically added to the blend, but you can choose another one from the drop-down list.
Click on the button that says ‘Join another table’
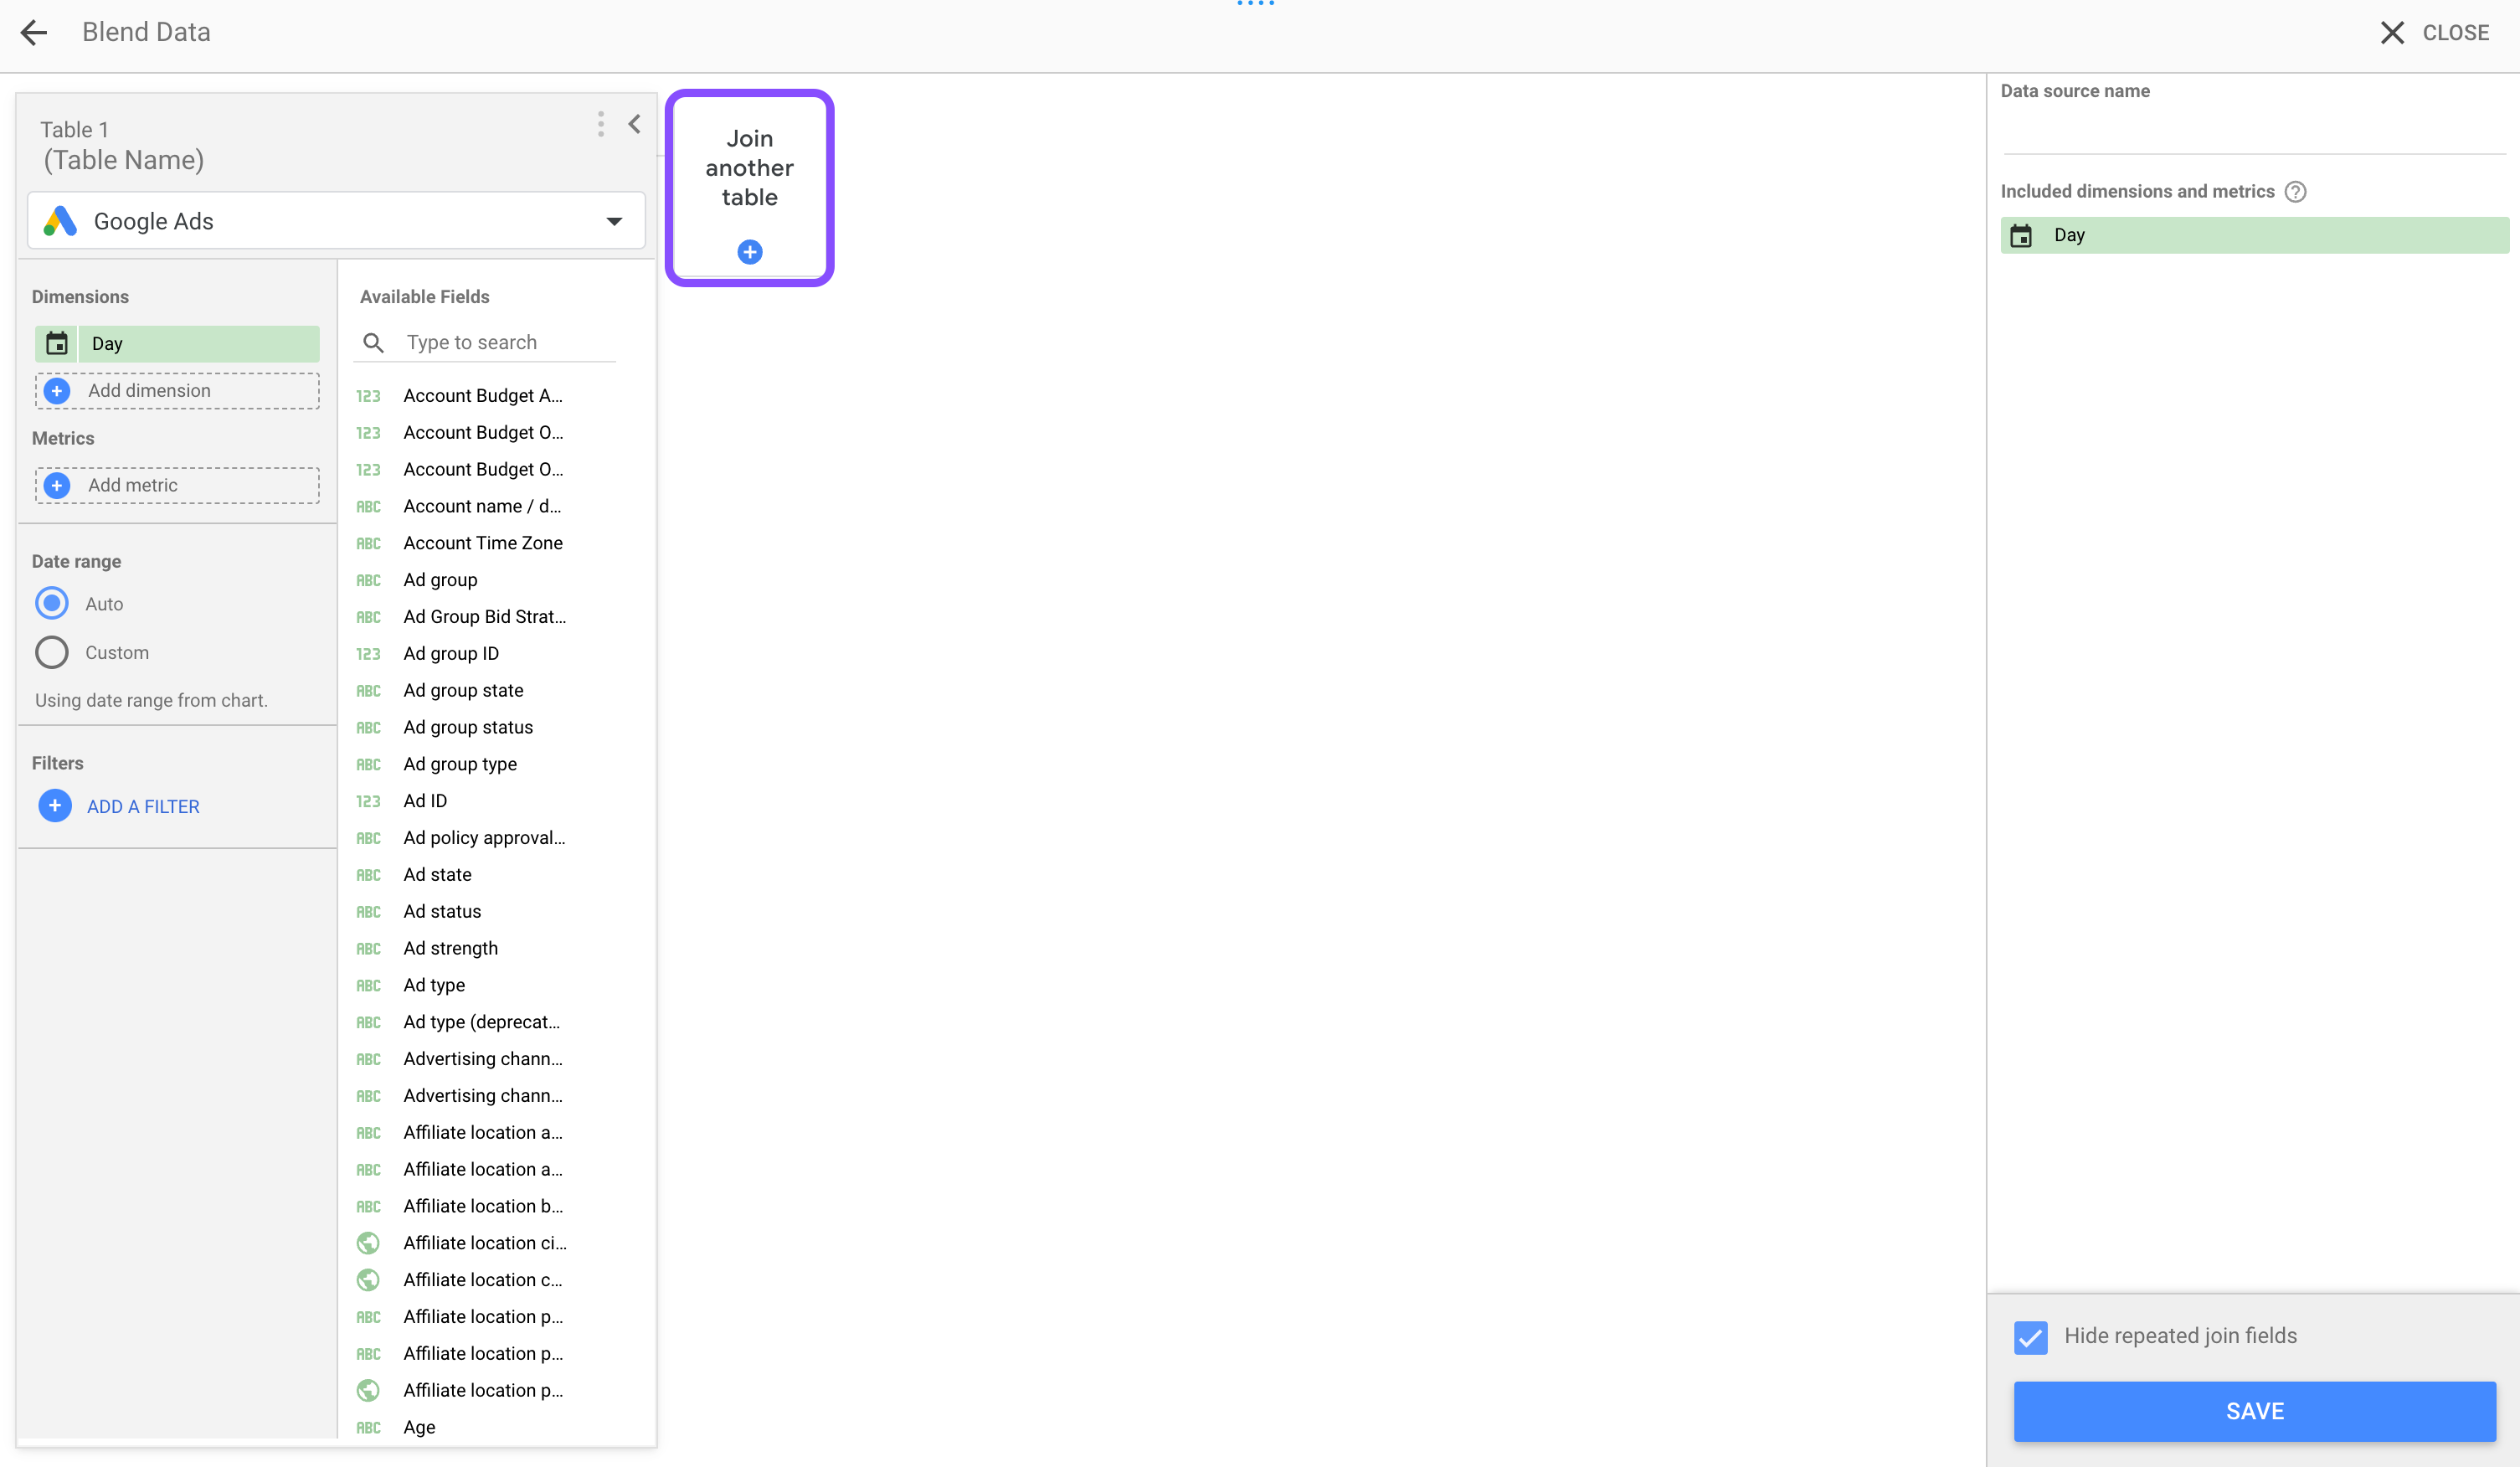
In this case, I’m going to select Facebook Ads, and now I will have both data sources.
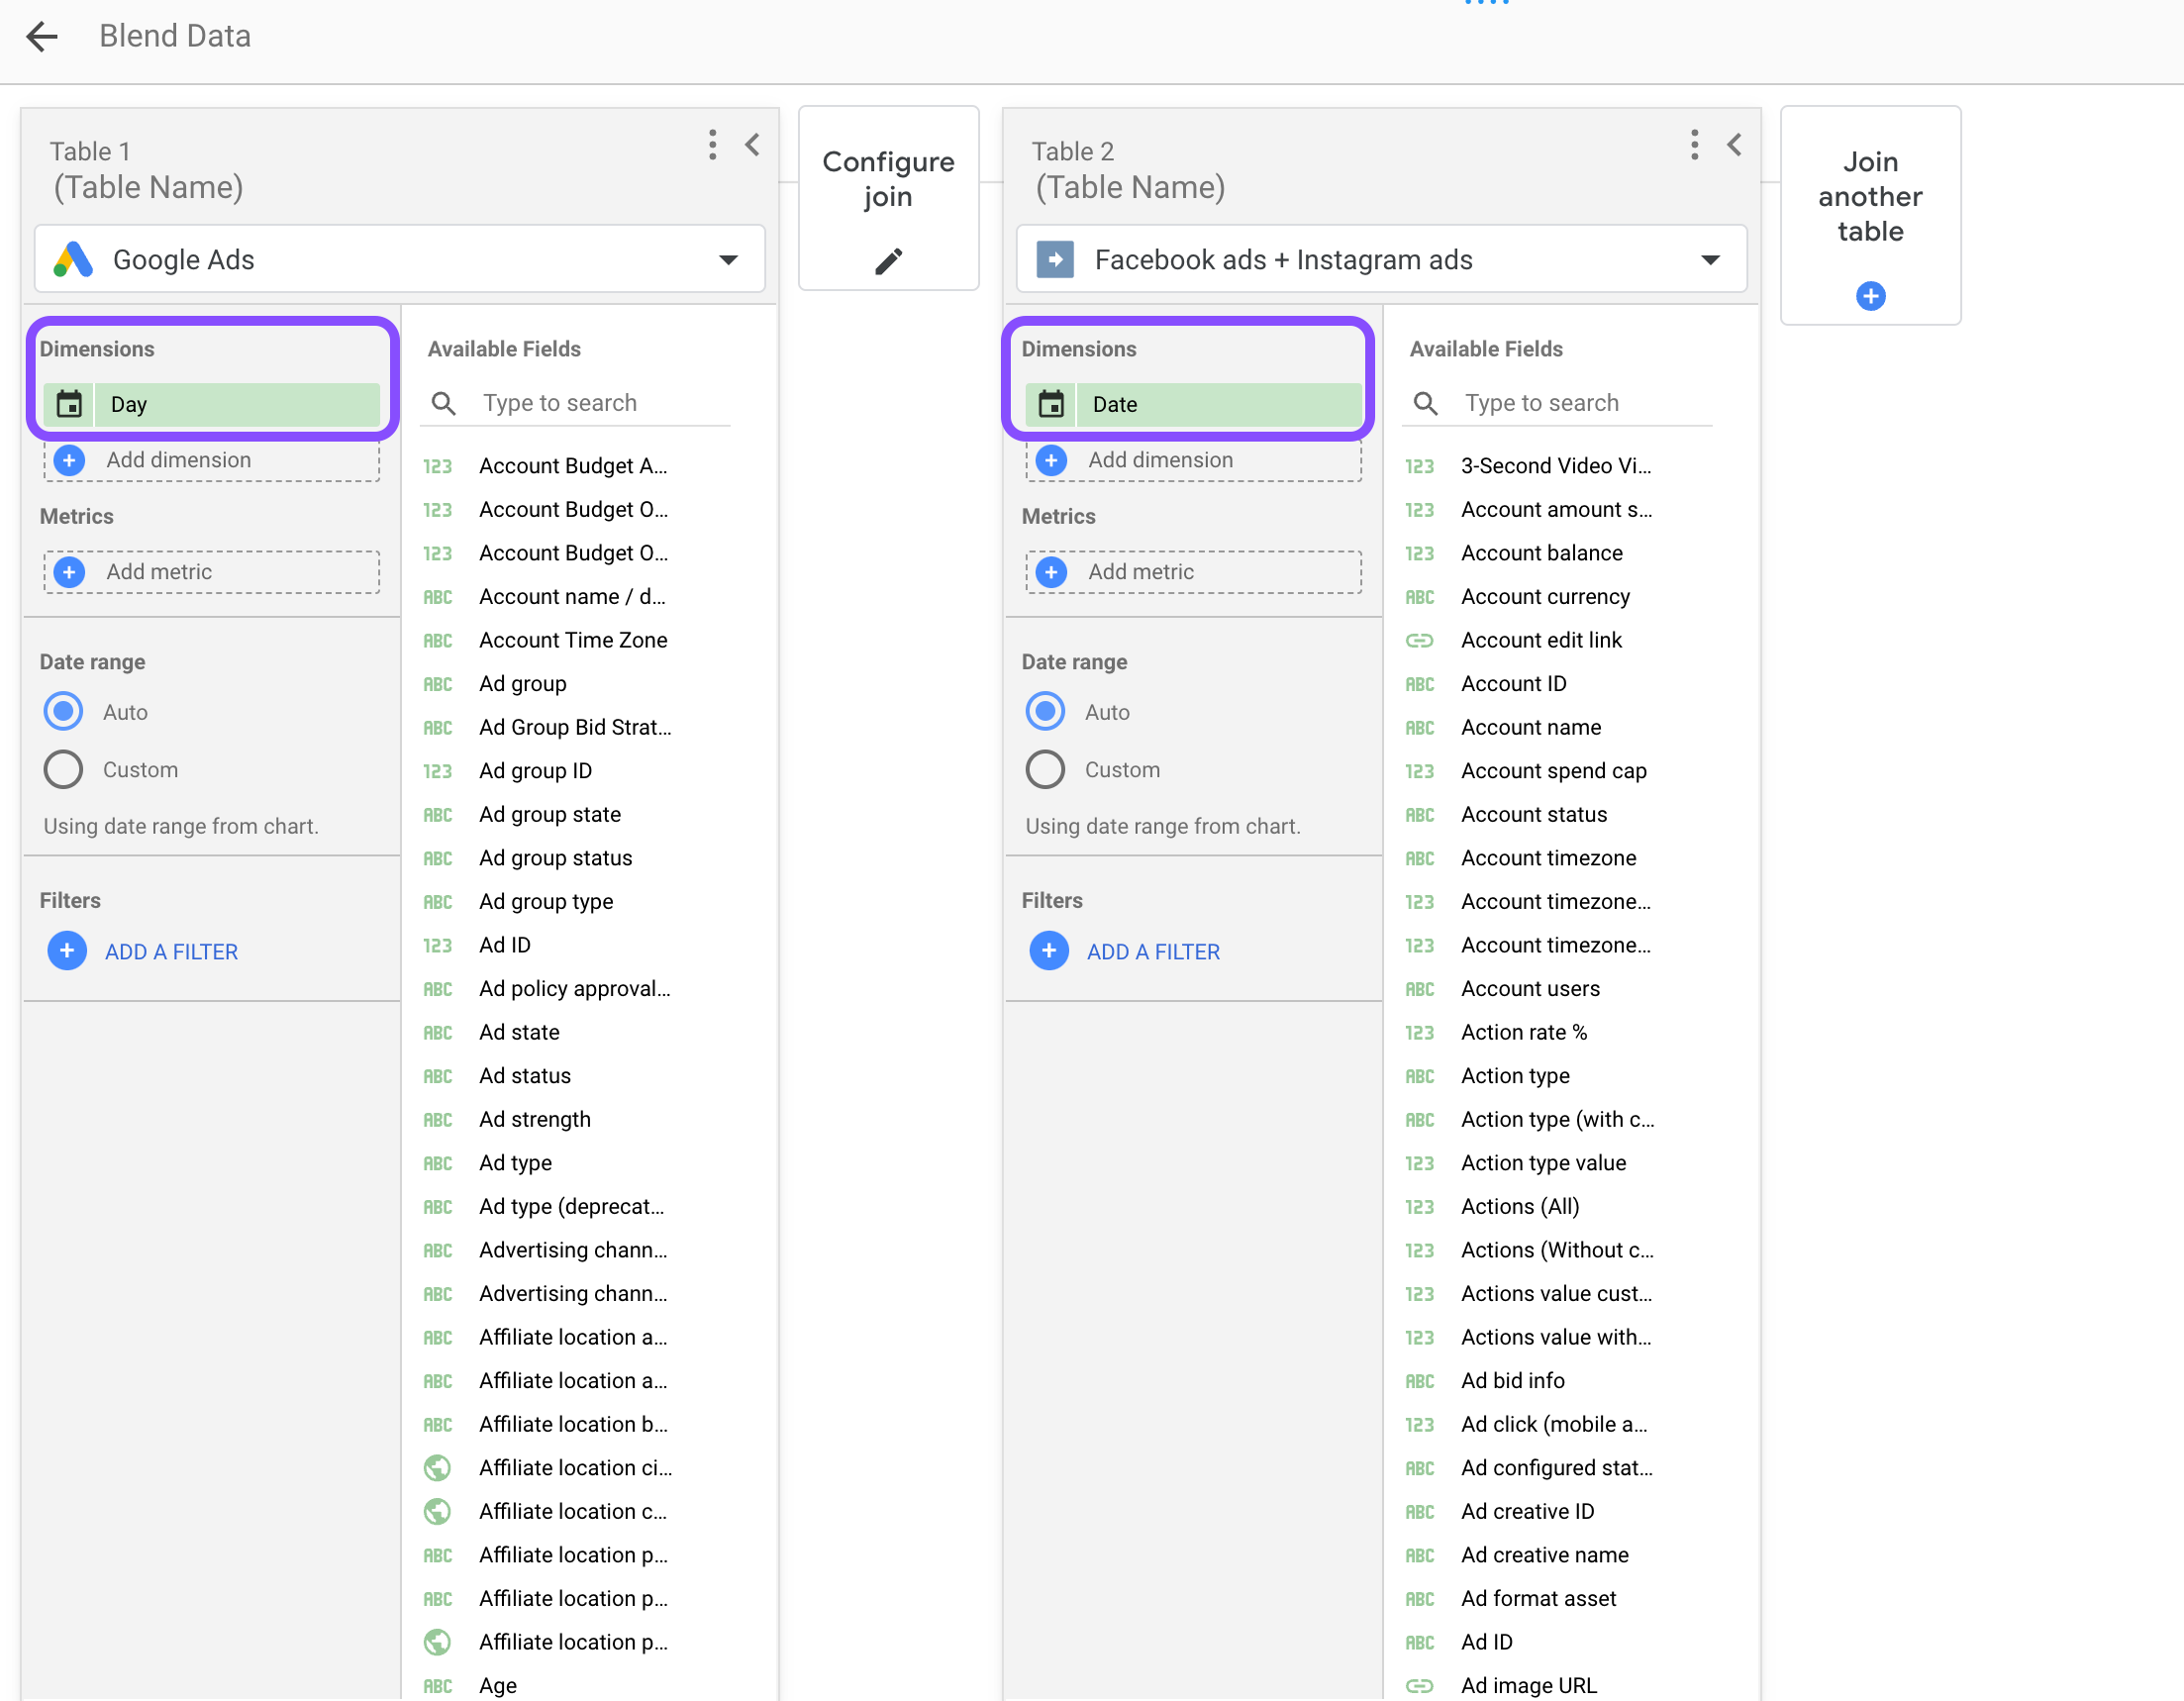
Remember that you must choose what will be the ‘key’ or ‘join key’ that allows you to combine both tables. Usually, it is the first dimension you choose.
As a reminder: the join key must be a field that exists in both data sources and has similar information to group both tables based on that criterion. In this case, we will choose the most common: date.
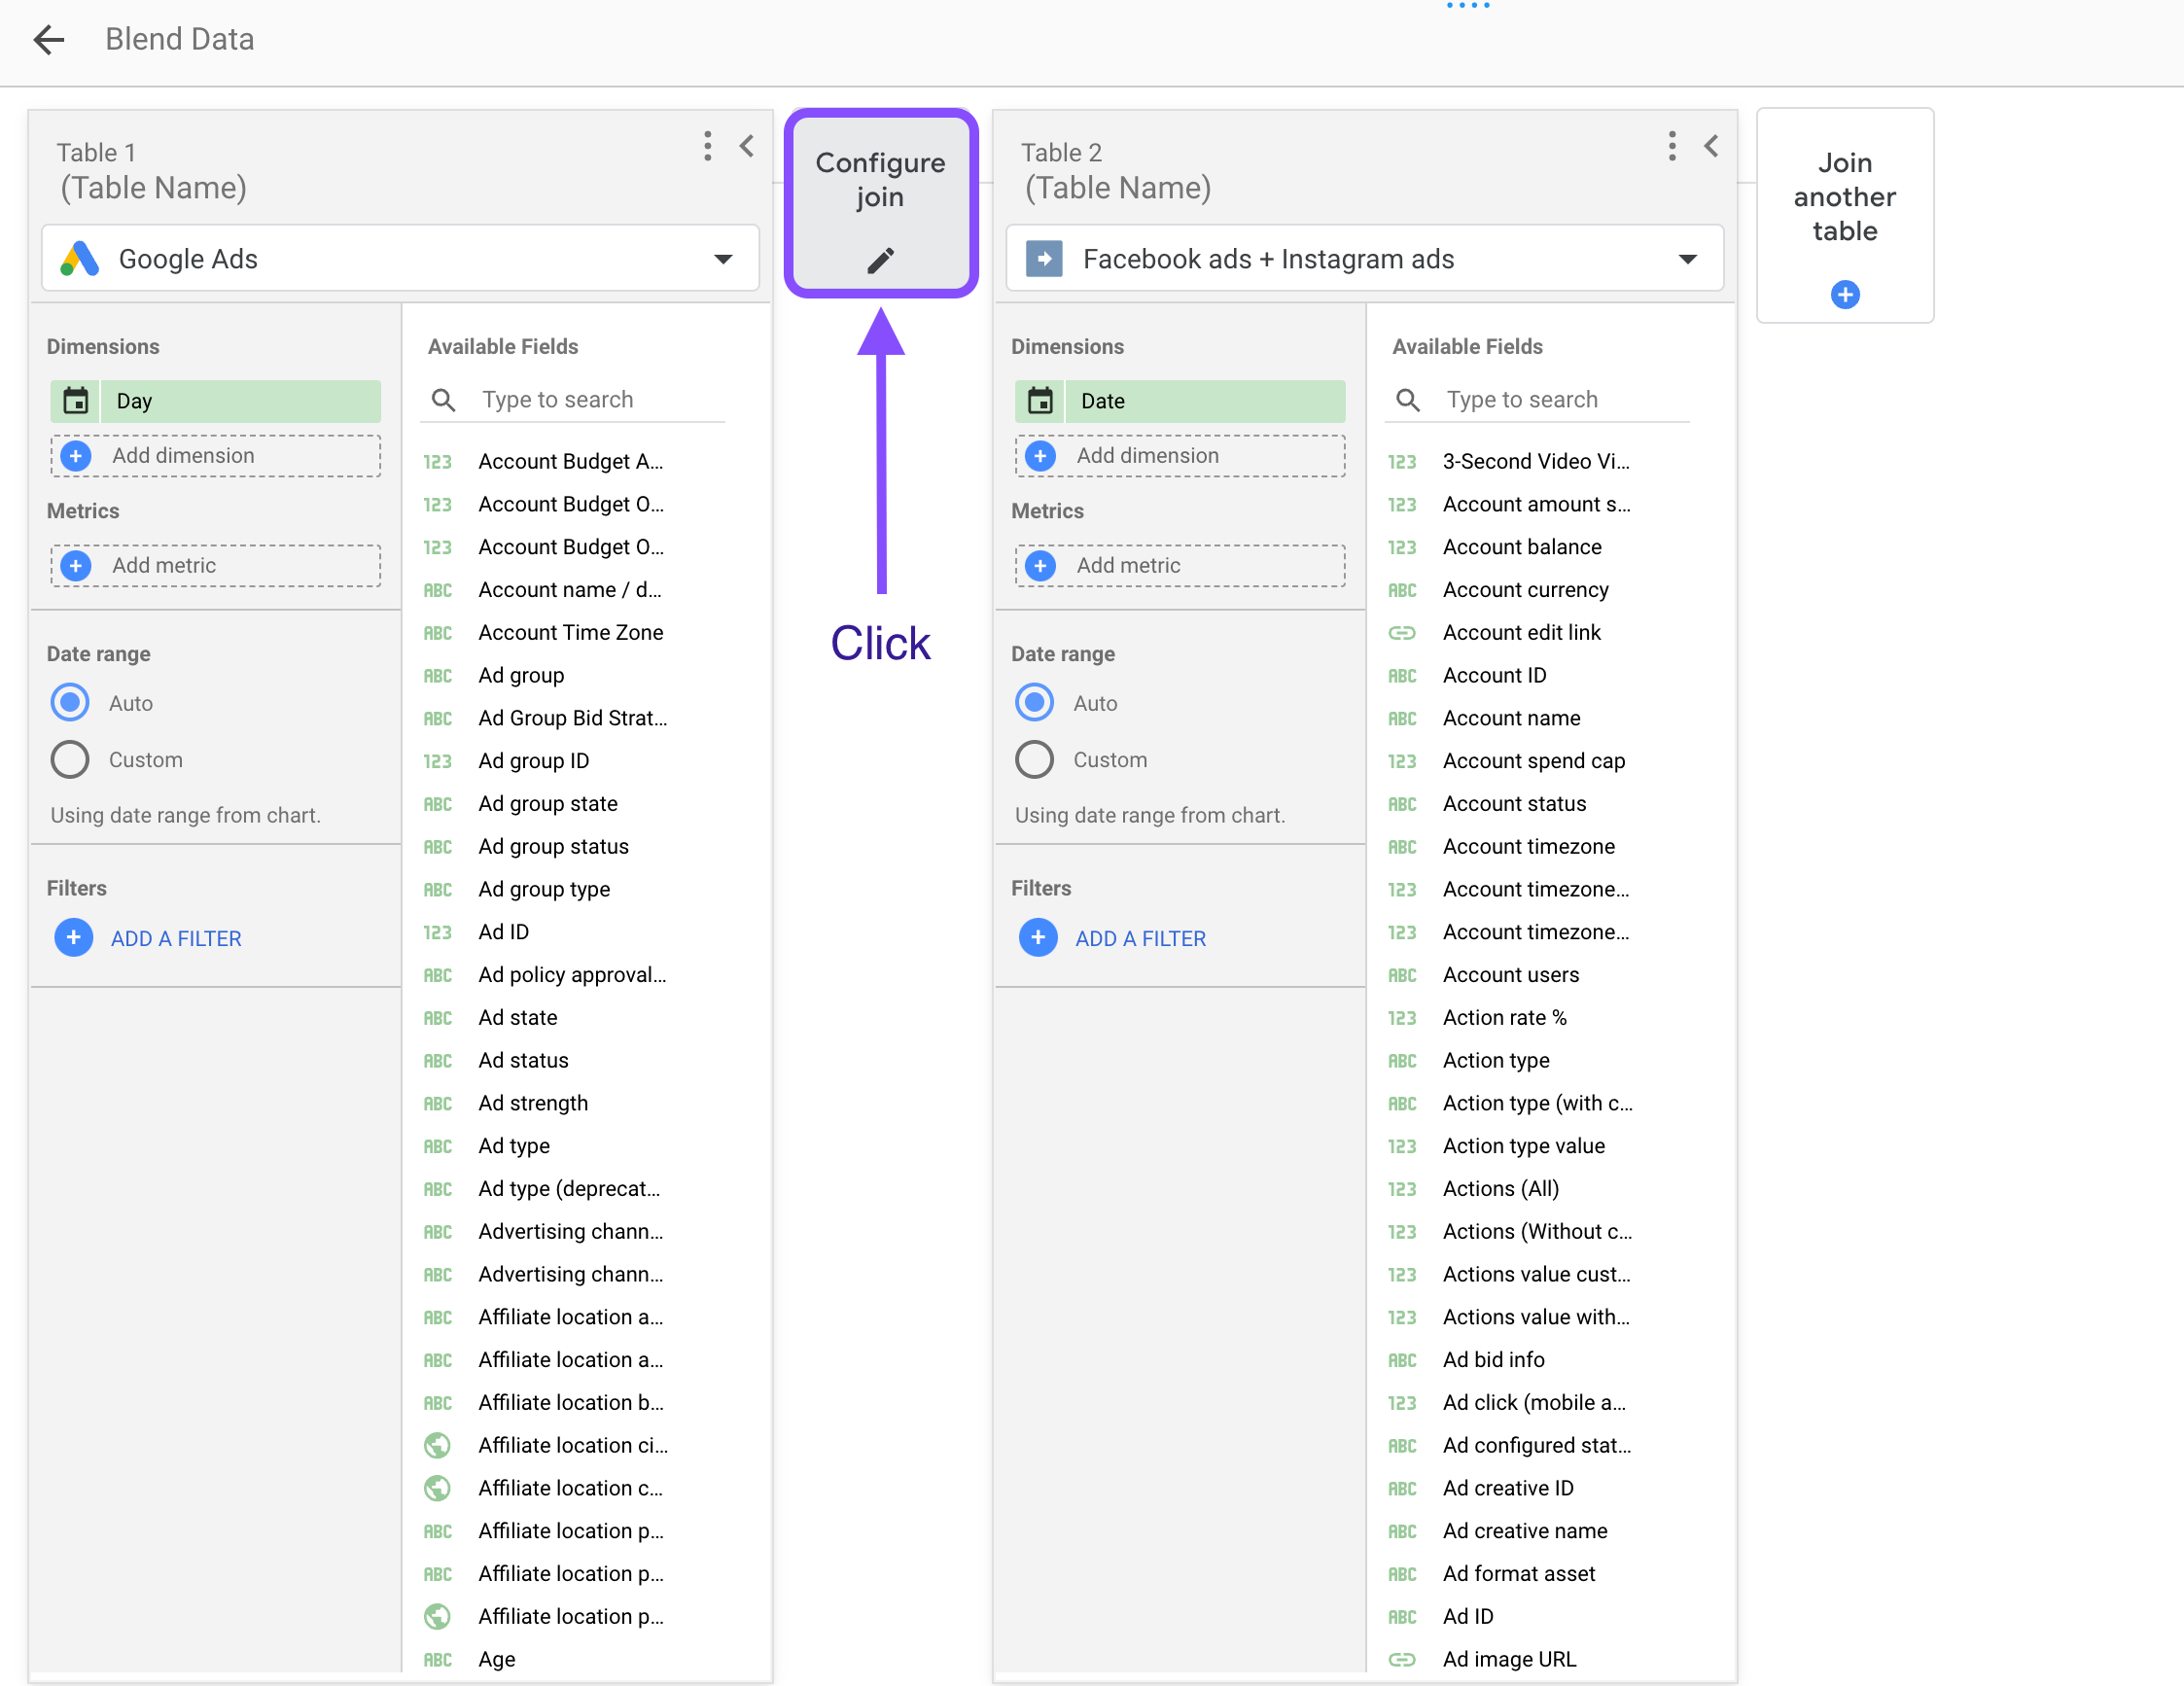
To finish our configuration, we need to set up the join with the join operators and join conditions.
Click on ‘configure join’
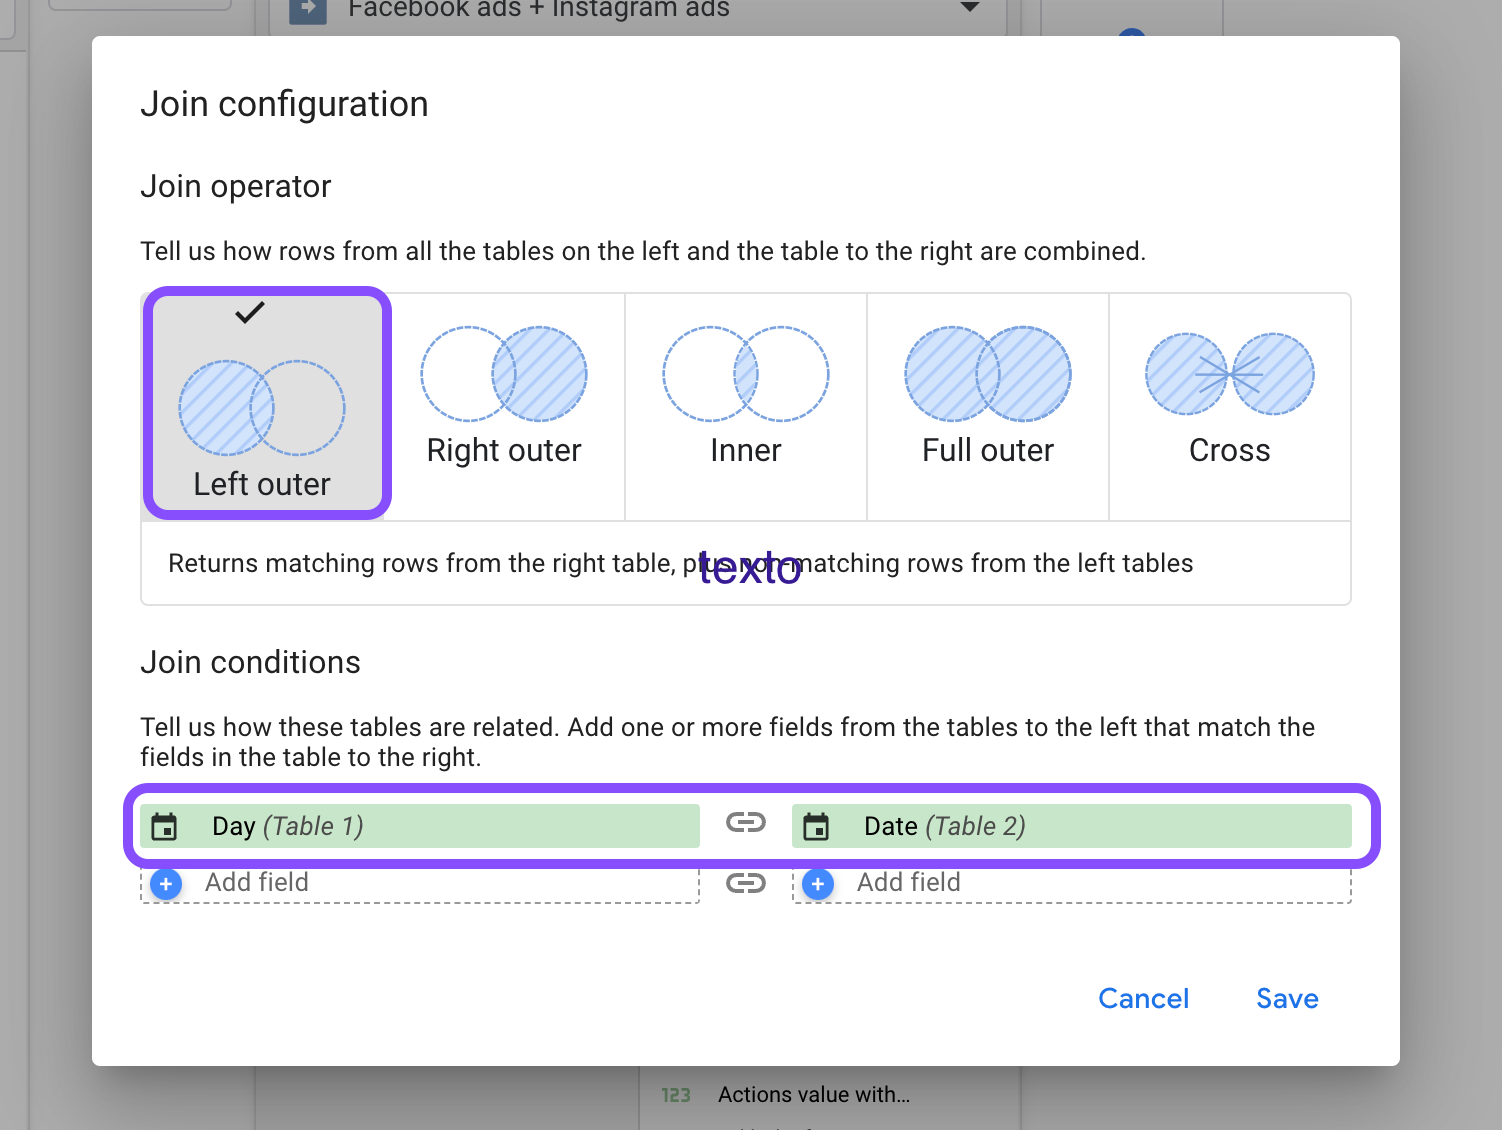
Now you must decide what type of ‘Join Operator’ you want to combine the tables.
Remember that you will be able to see different numbers depending on the configuration (if you have doubts, read the part of the article on basic concepts and types of joins).
In this case, I’m going to select ‘Left Outer‘ and it will include all the data from the left (first) table and only the matching data from the right (second) table. Any rows from the right table that don’t have a match in the left table will be excluded from the result.
When you click save, you will be redirected to the previous view.
Now add all the metrics and dimensions you want to use in your blended data. We’ll change the fields names to differentiate them among data sources, by clicking on the edit icon.
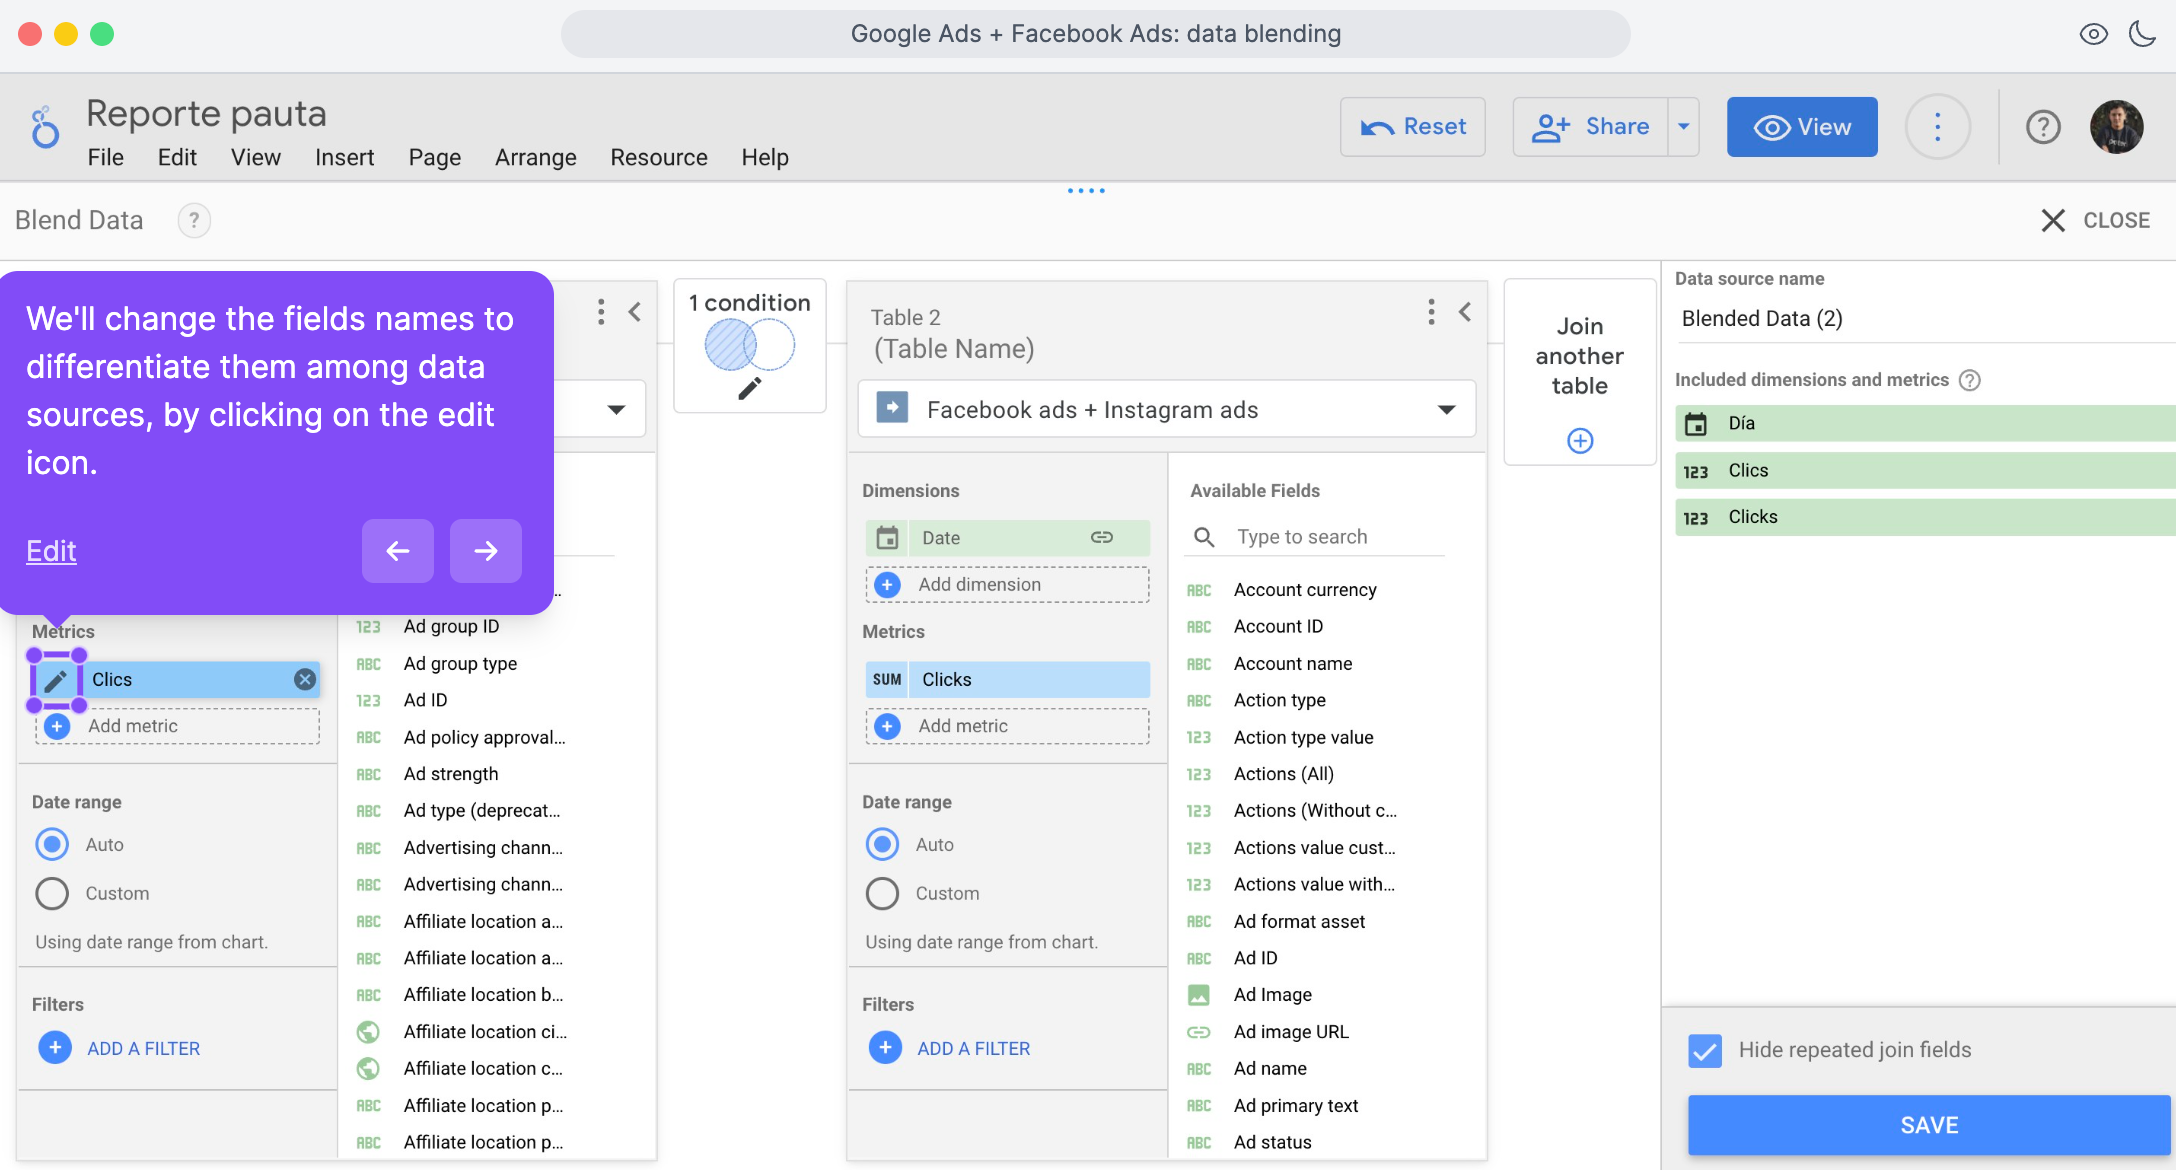
You should have something like this:
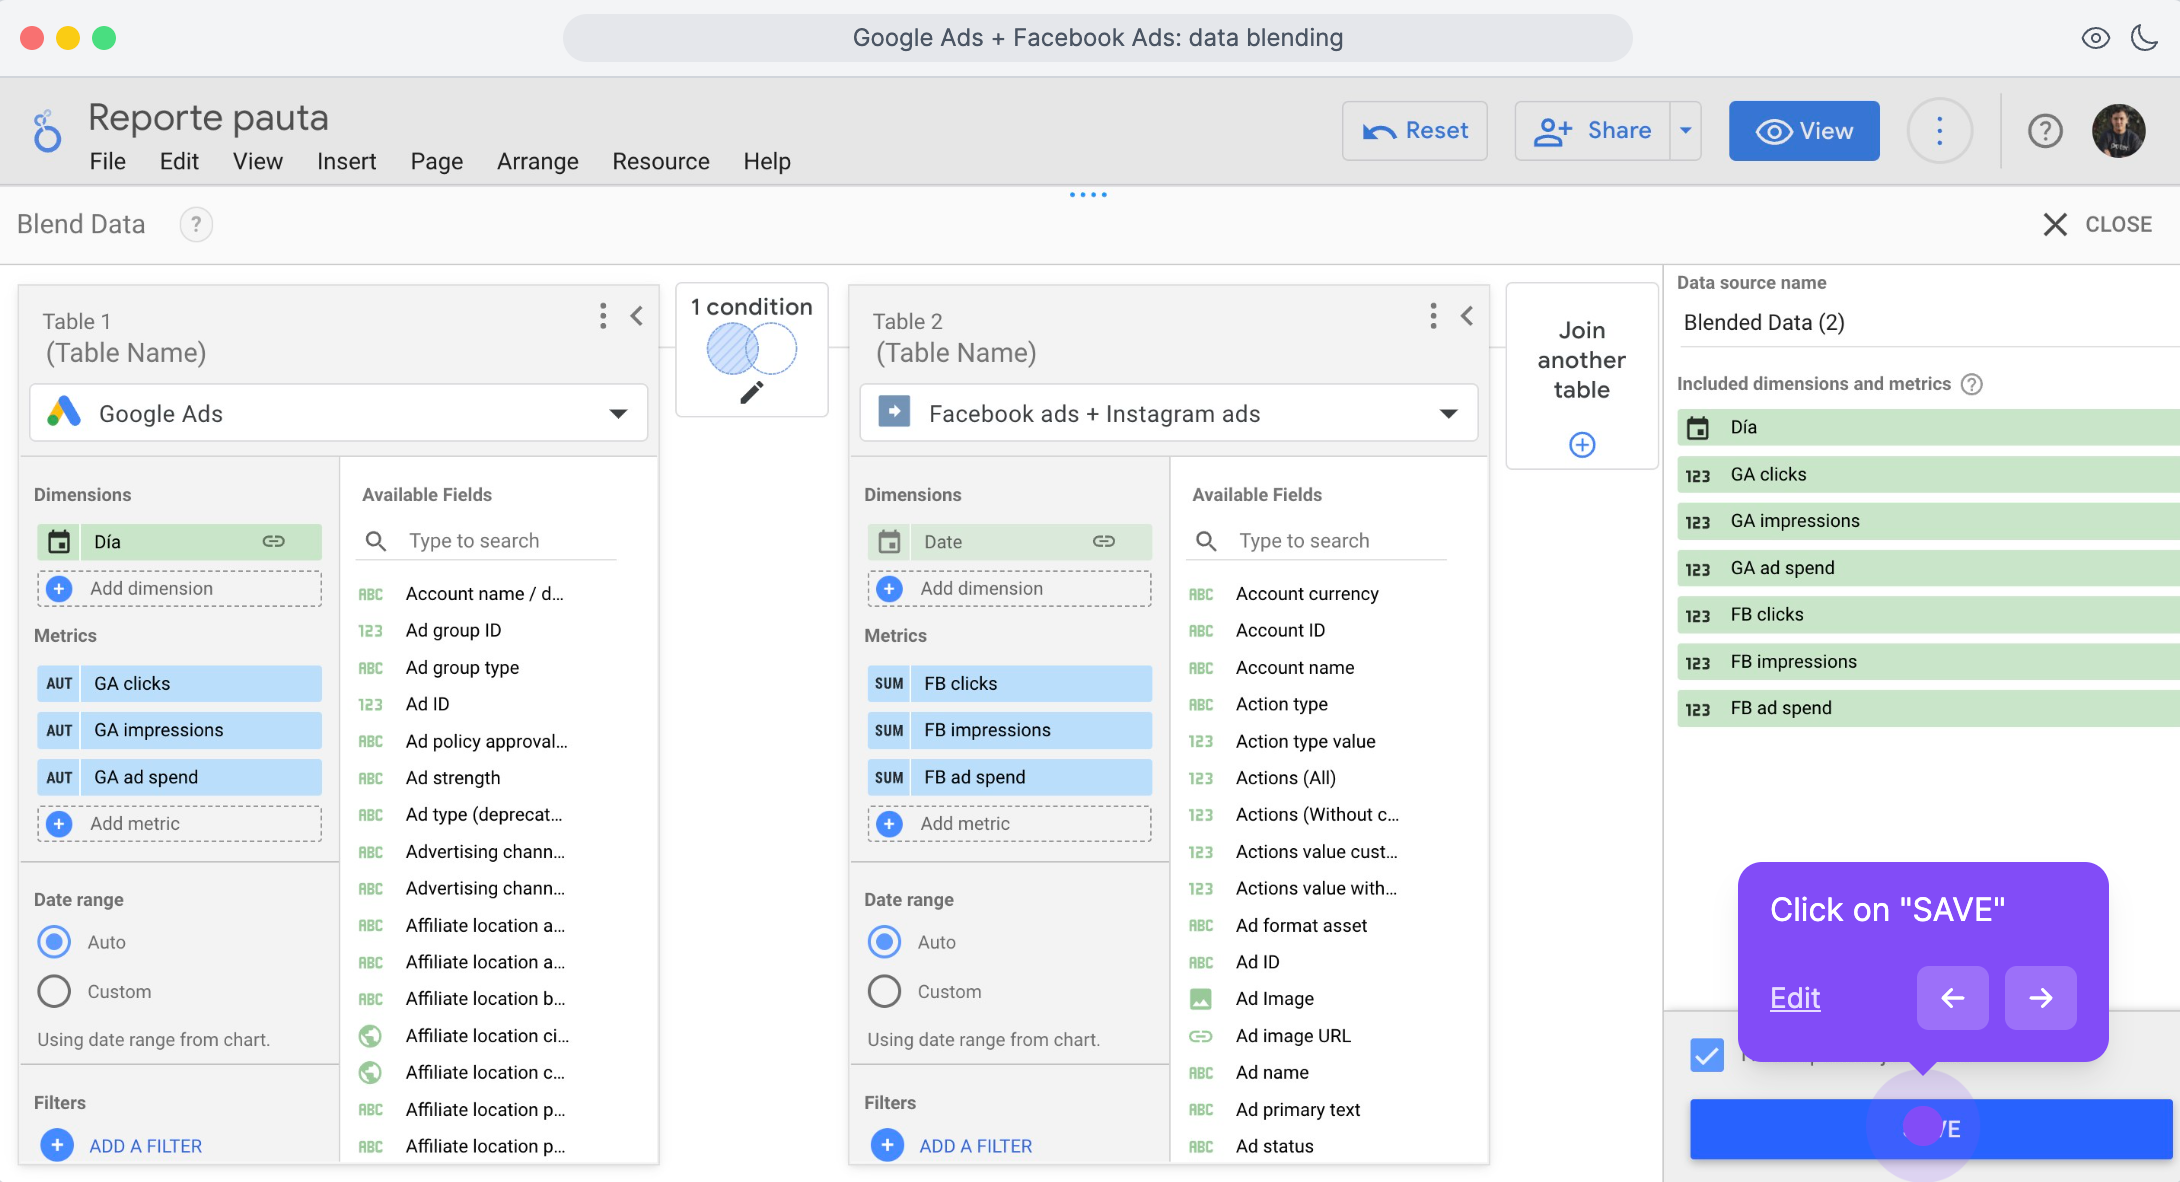
On the right panel, you will see the list of metrics and dimensions that you combined, and you will be able to write a name for your data source.
Click ‘Save’ and now you can create tables with your new data source.
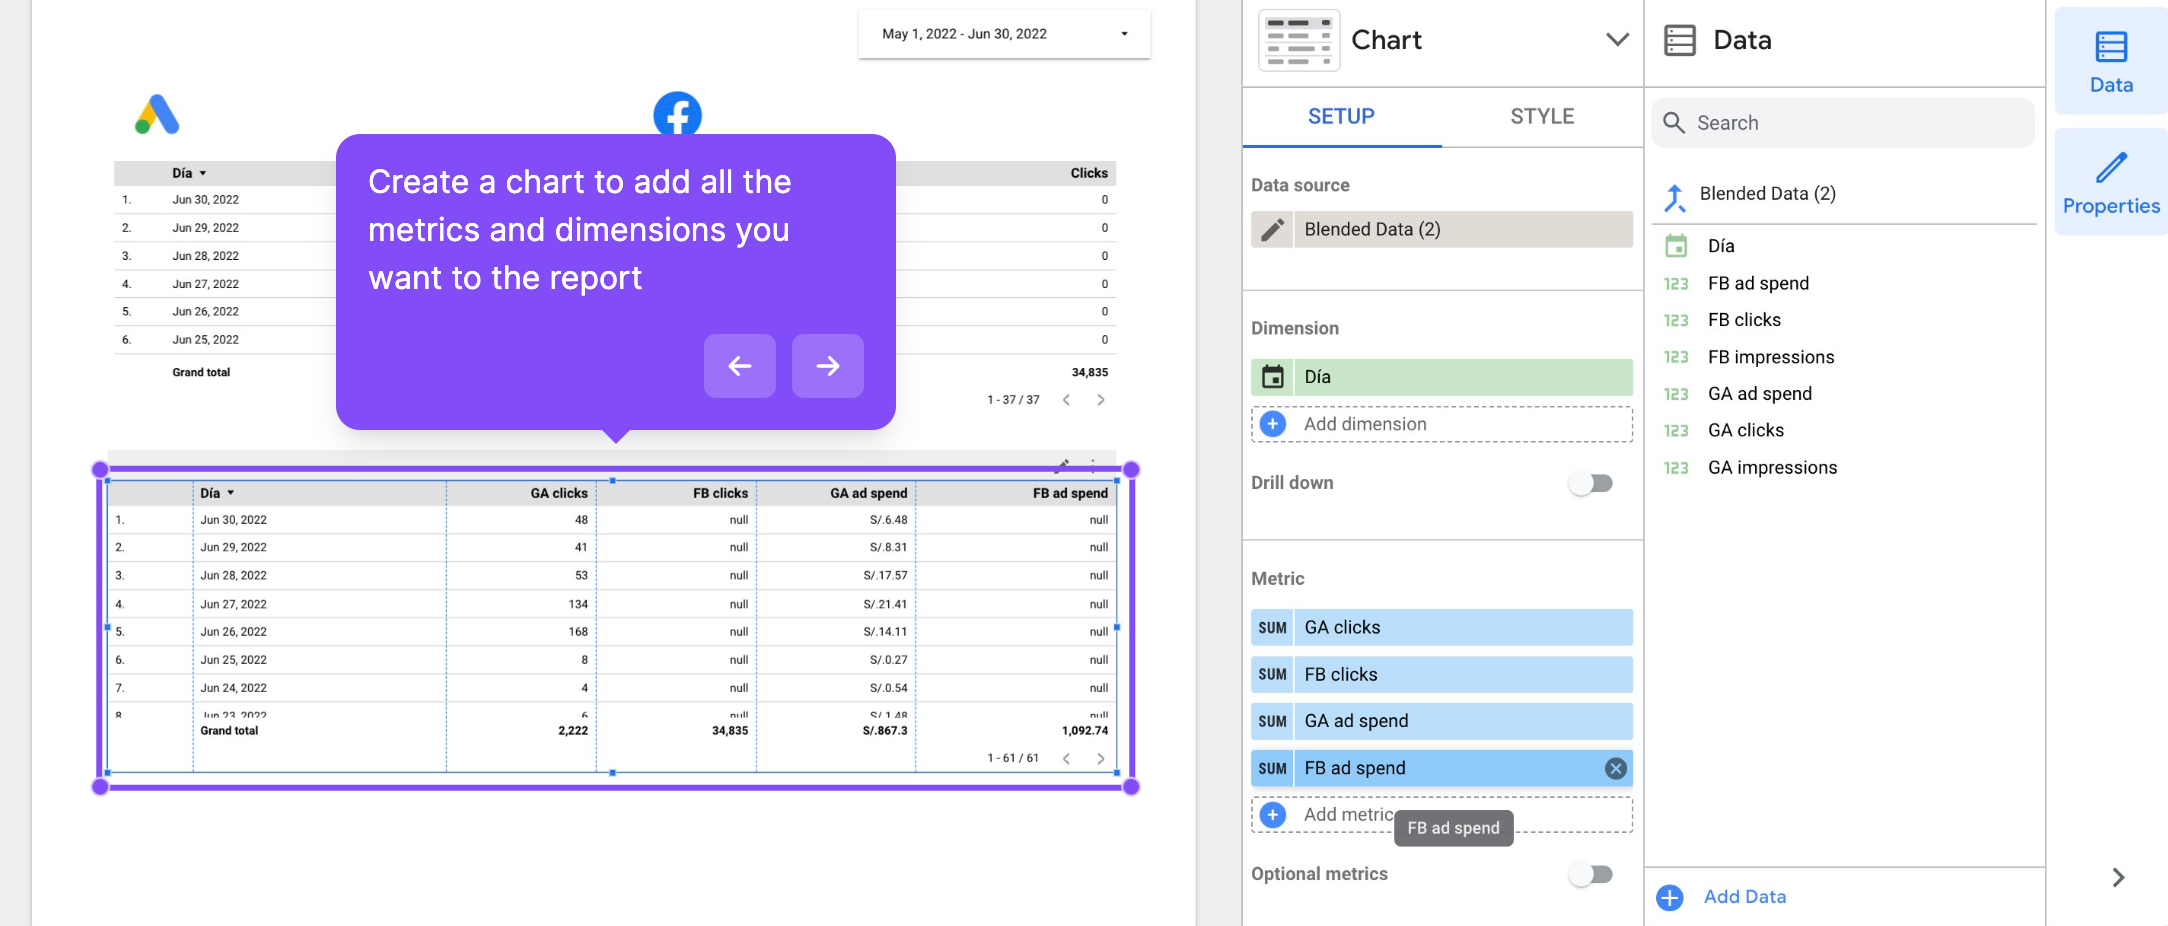
In this case, as we can see in the table, it is a simple join where the result is a table, but what happens if you want to add up the results to get the total values?
It’s not just a matter of adding up the values because there are usually ‘null values’ that Looker Studio won’t recognize, so you won’t be able to add them up normally, as you can see.
How to create custom formulas for Looker Studio blended data tables
Still using our example, we can use the calculated field feature to get the total number of clicks from our ads’ combined data.
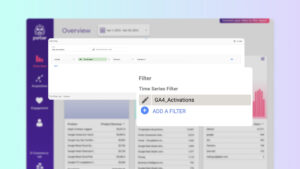
To do this, under the Chart tab on the right-hand menu, click “add metric,” as shown below:
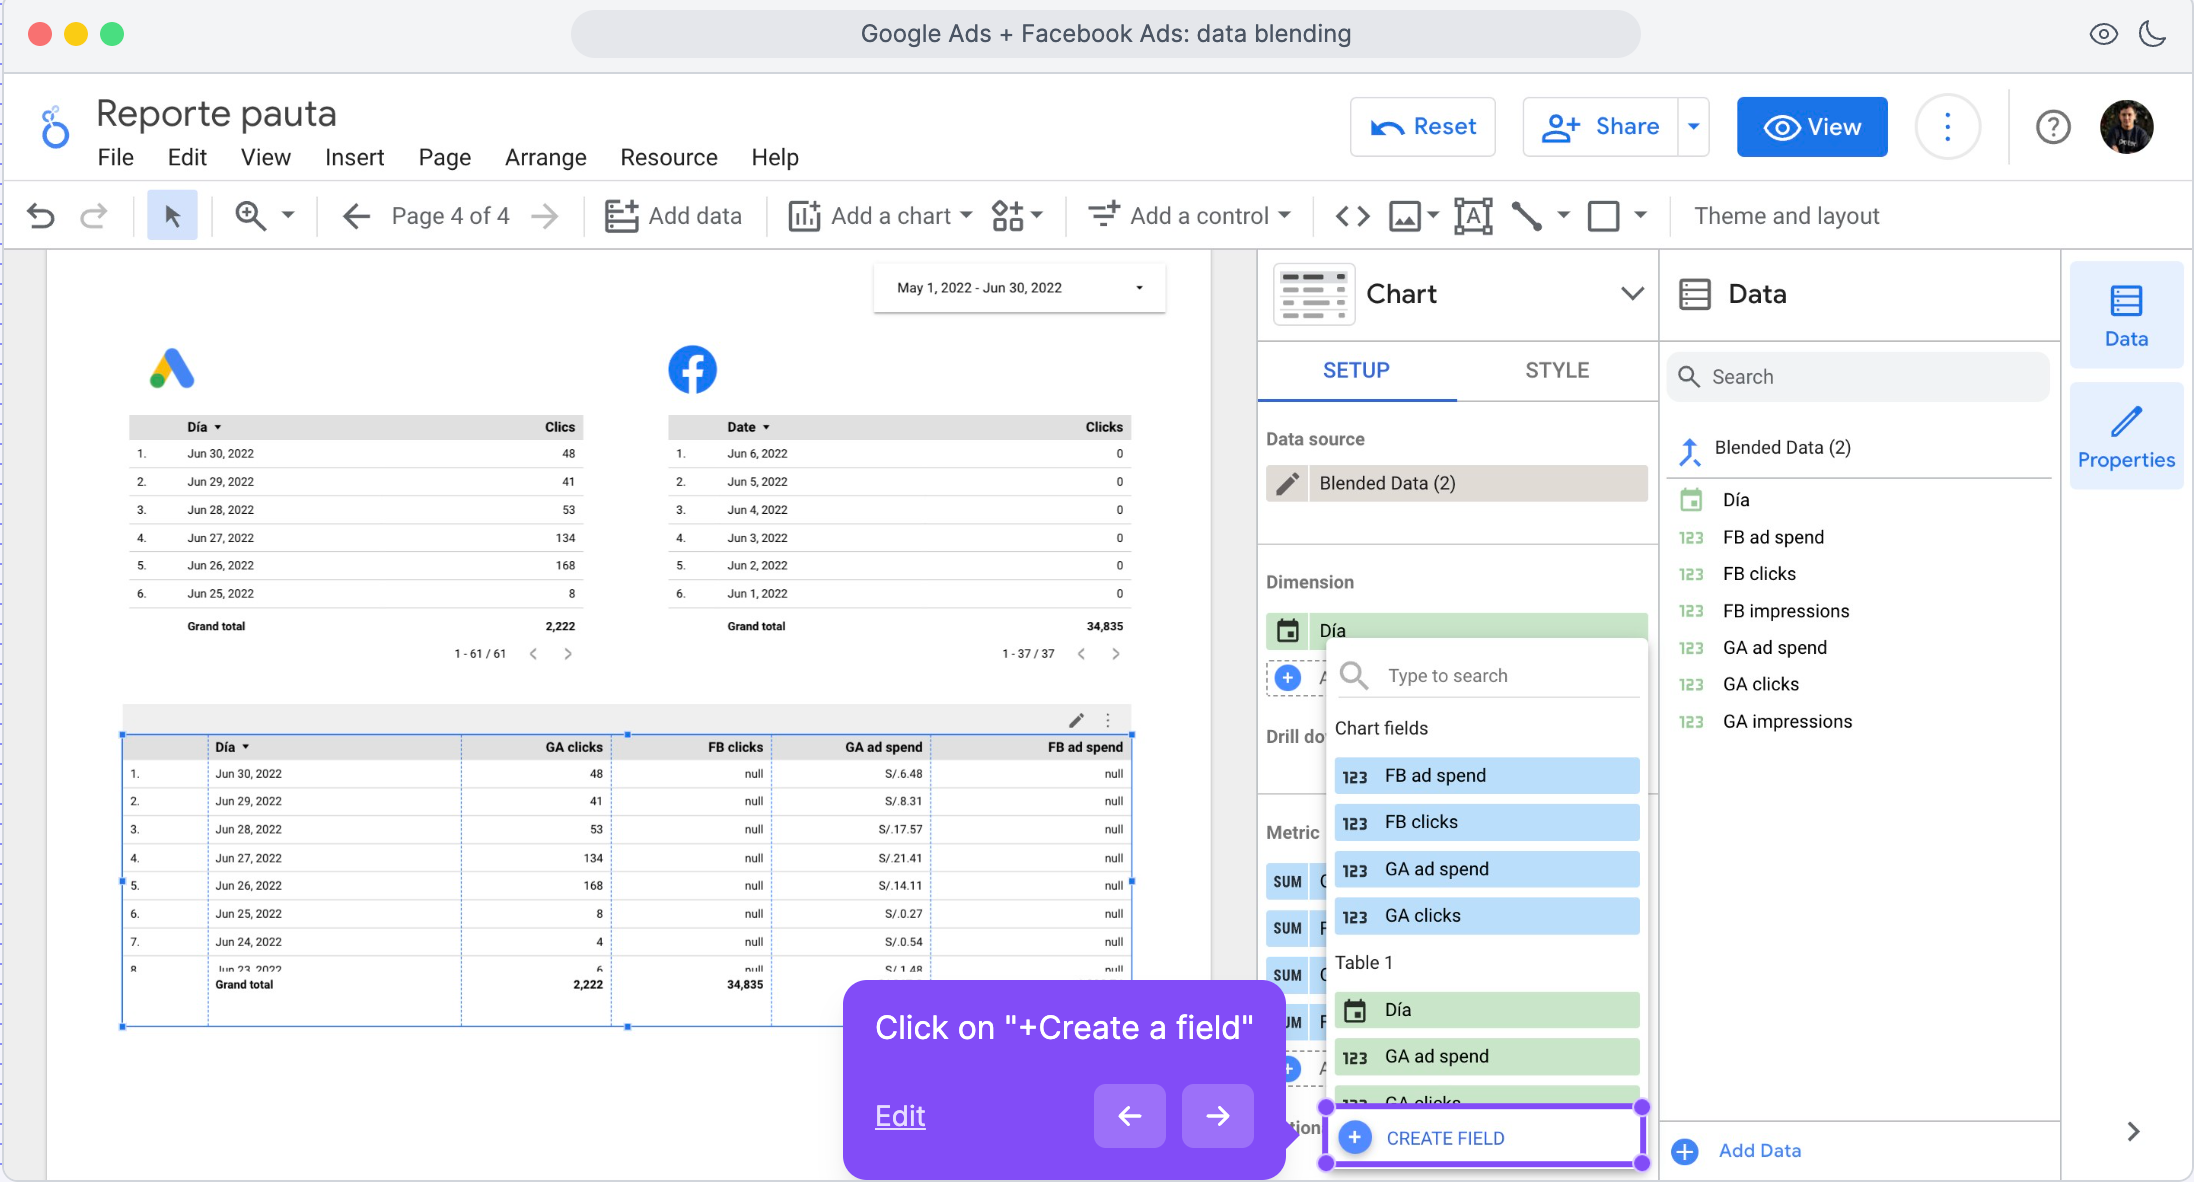
Then click the “Create field” on the drop-down menu.
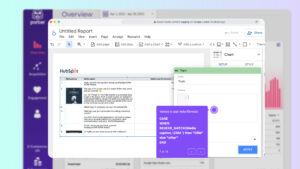
This opens up the calculated field table. Here, we’re going to name our new field total clicks and enter the formula “SUM(GA ad spend) + SUM(FB ad spend)”, as shown below:
Click “Apply” at the bottom to add the new field to your blended data table.
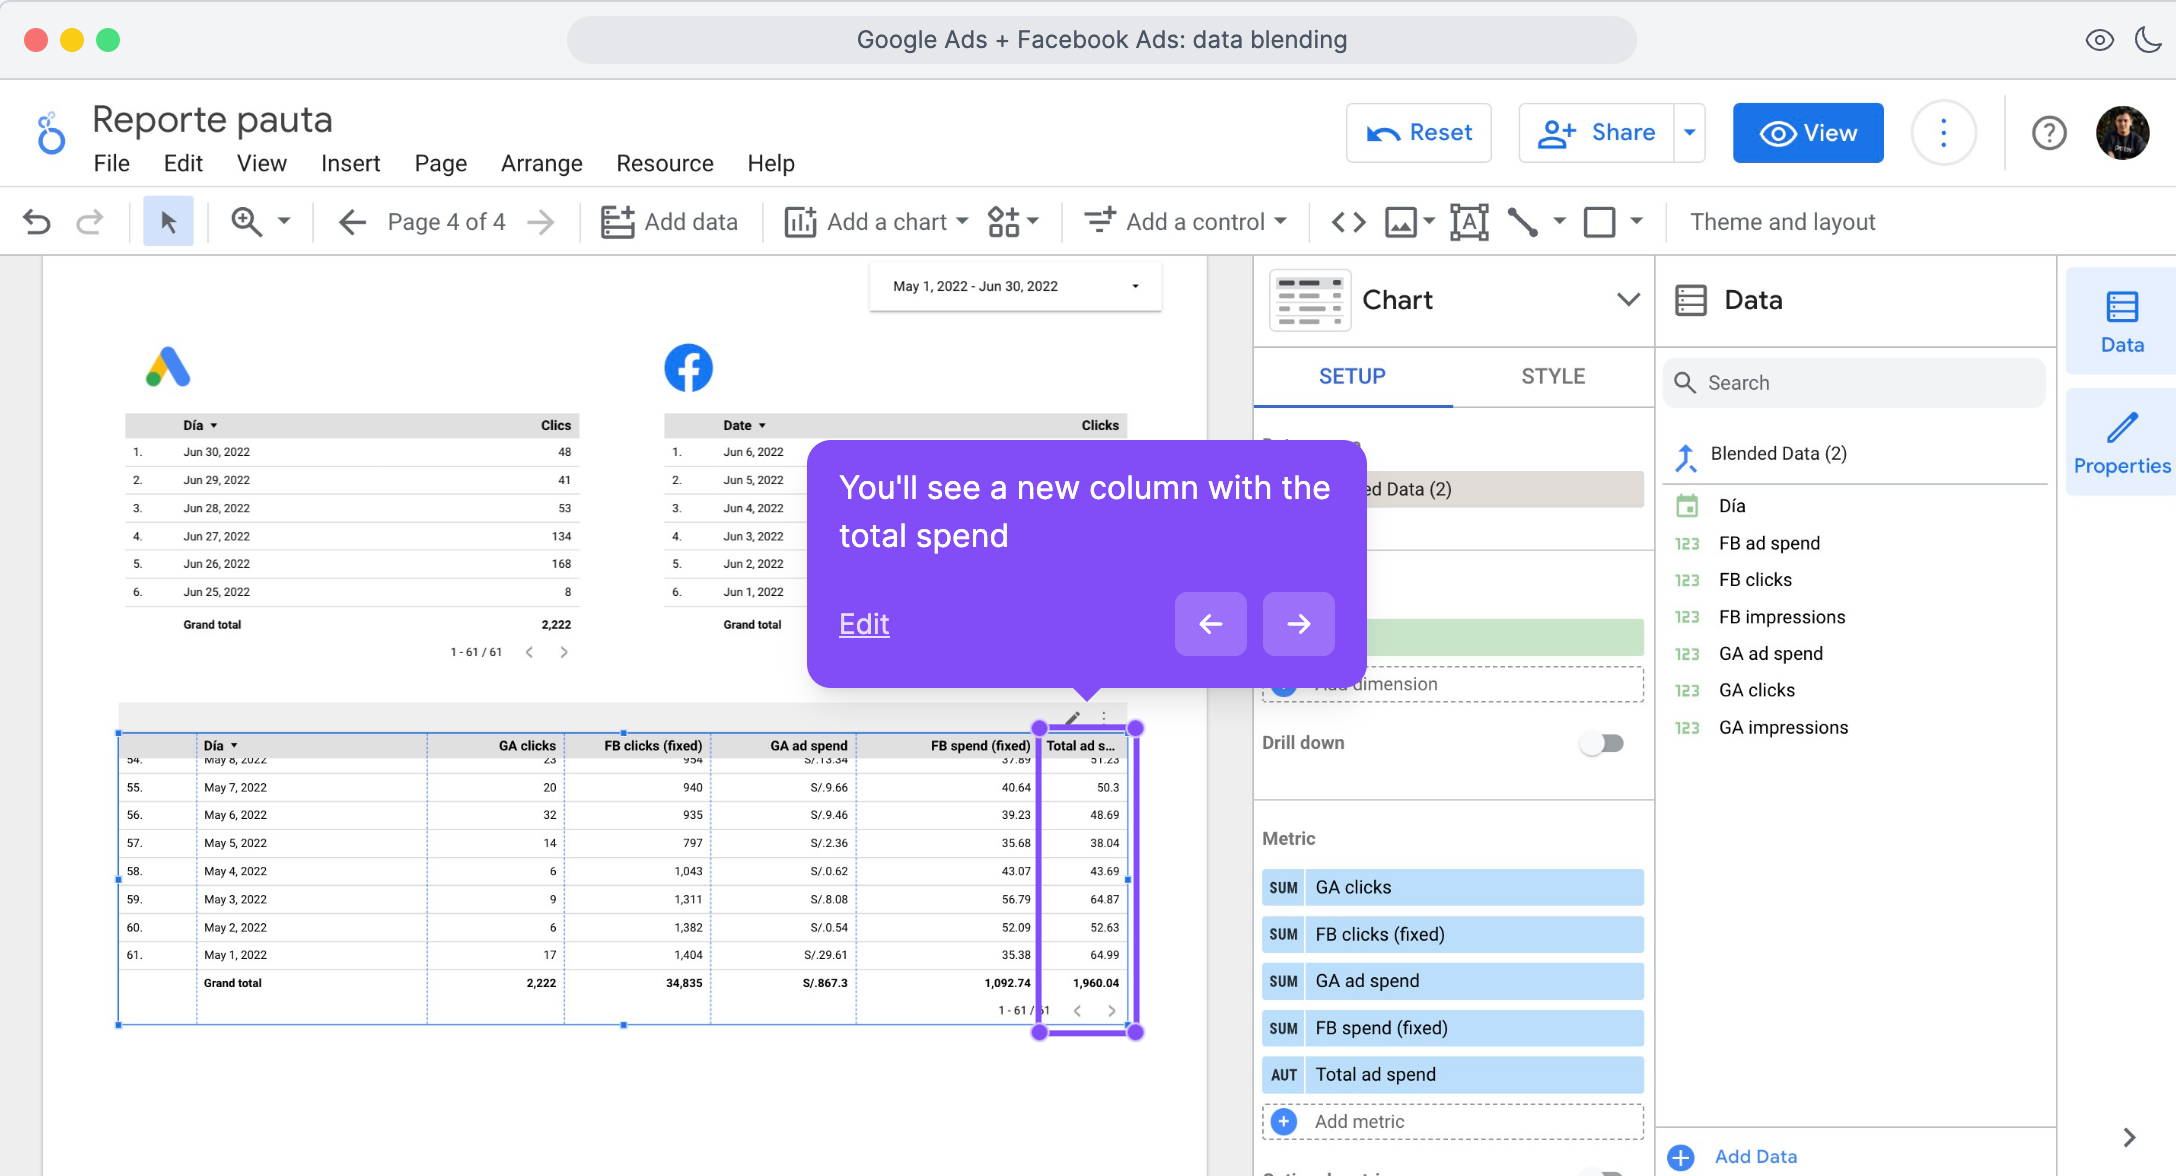
If there are null values in the table, you have to replace them by adding an IFNULL clause to the calculated field.
Your new formula should look like this: SUM(GA ad spend) + SUM(IFNULL(FB ad spend),0))
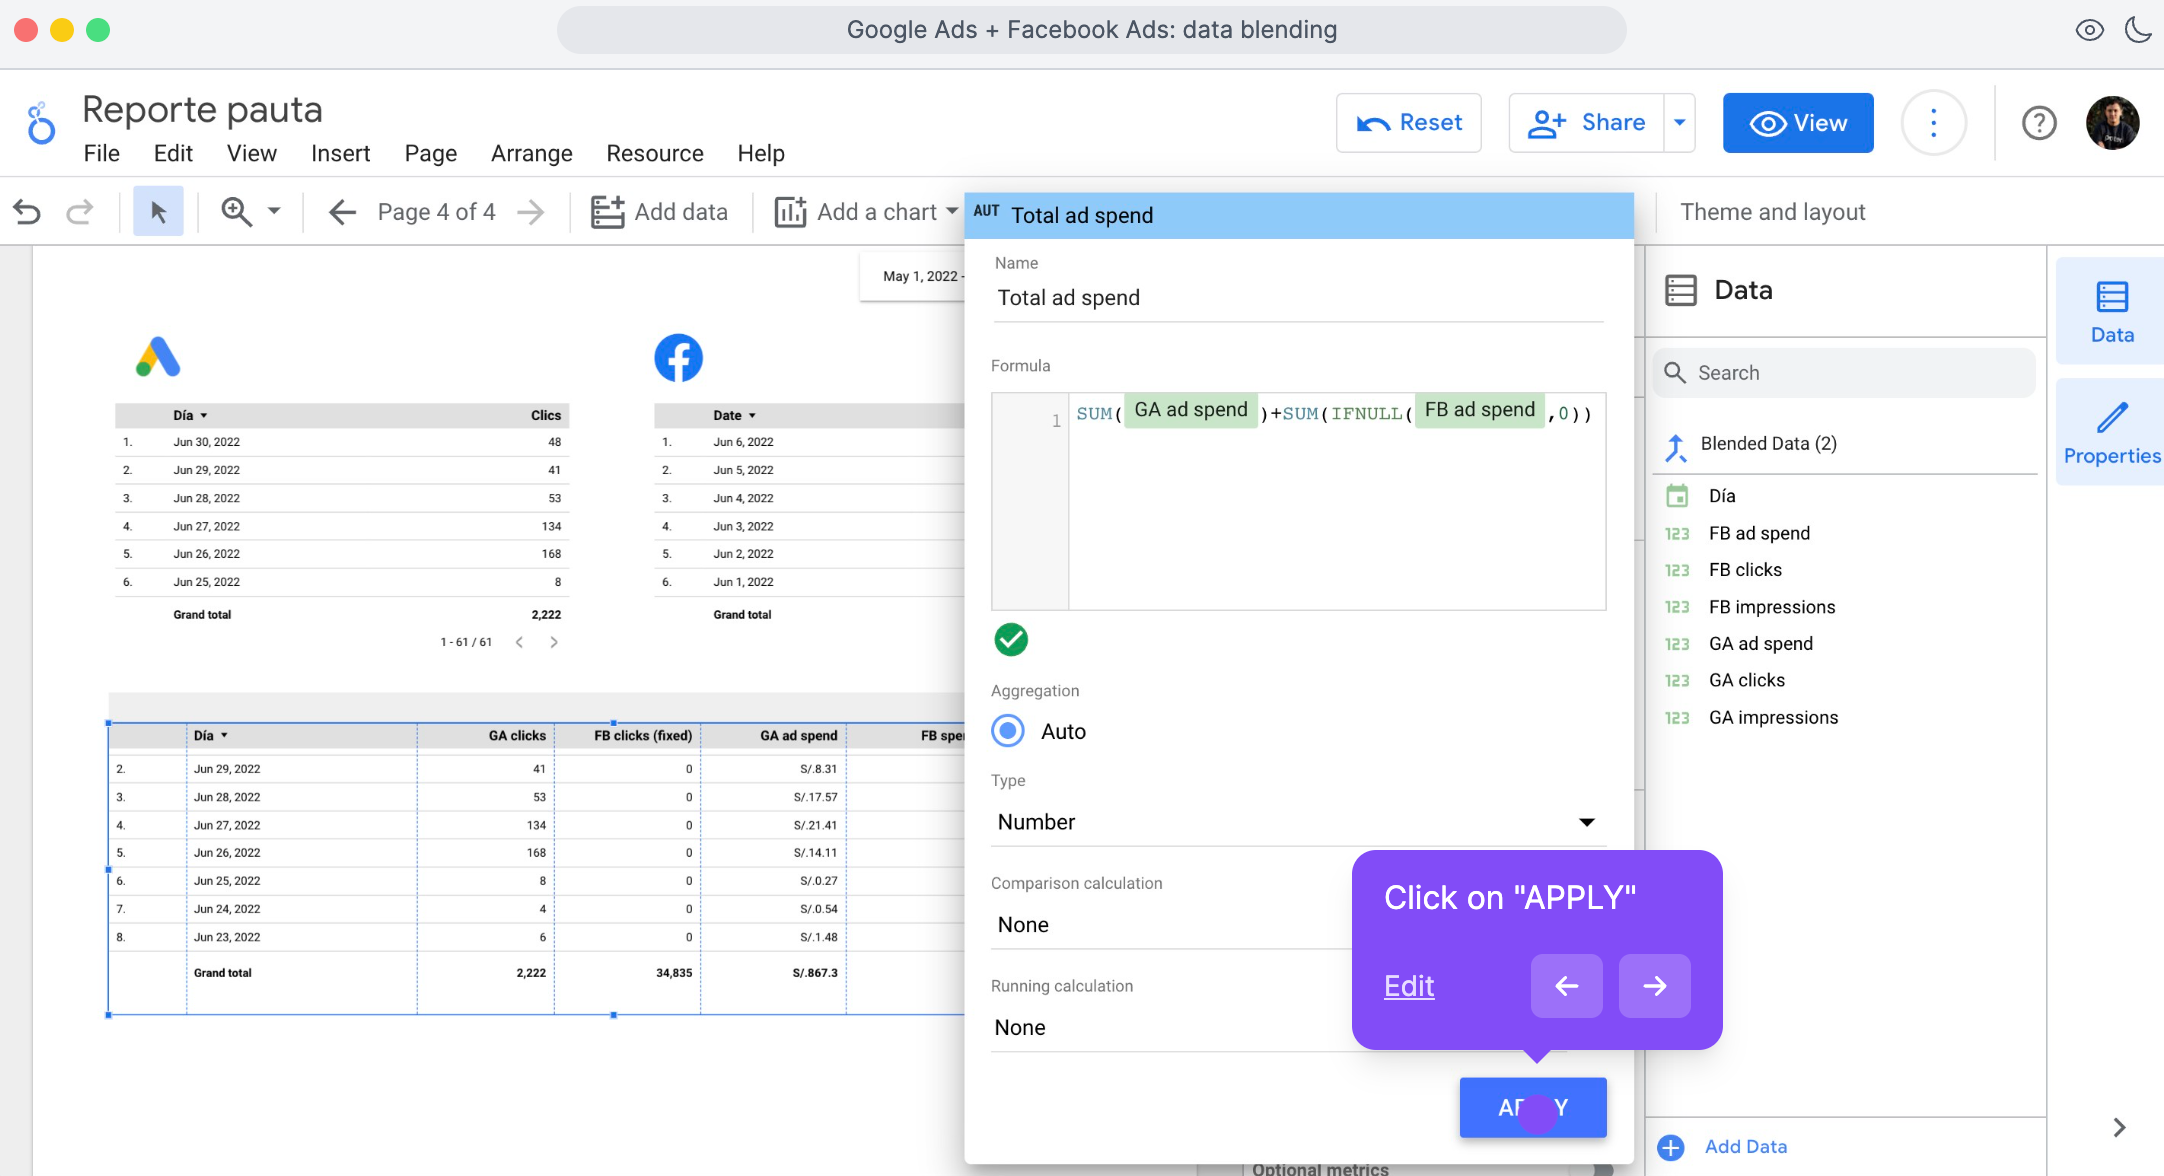
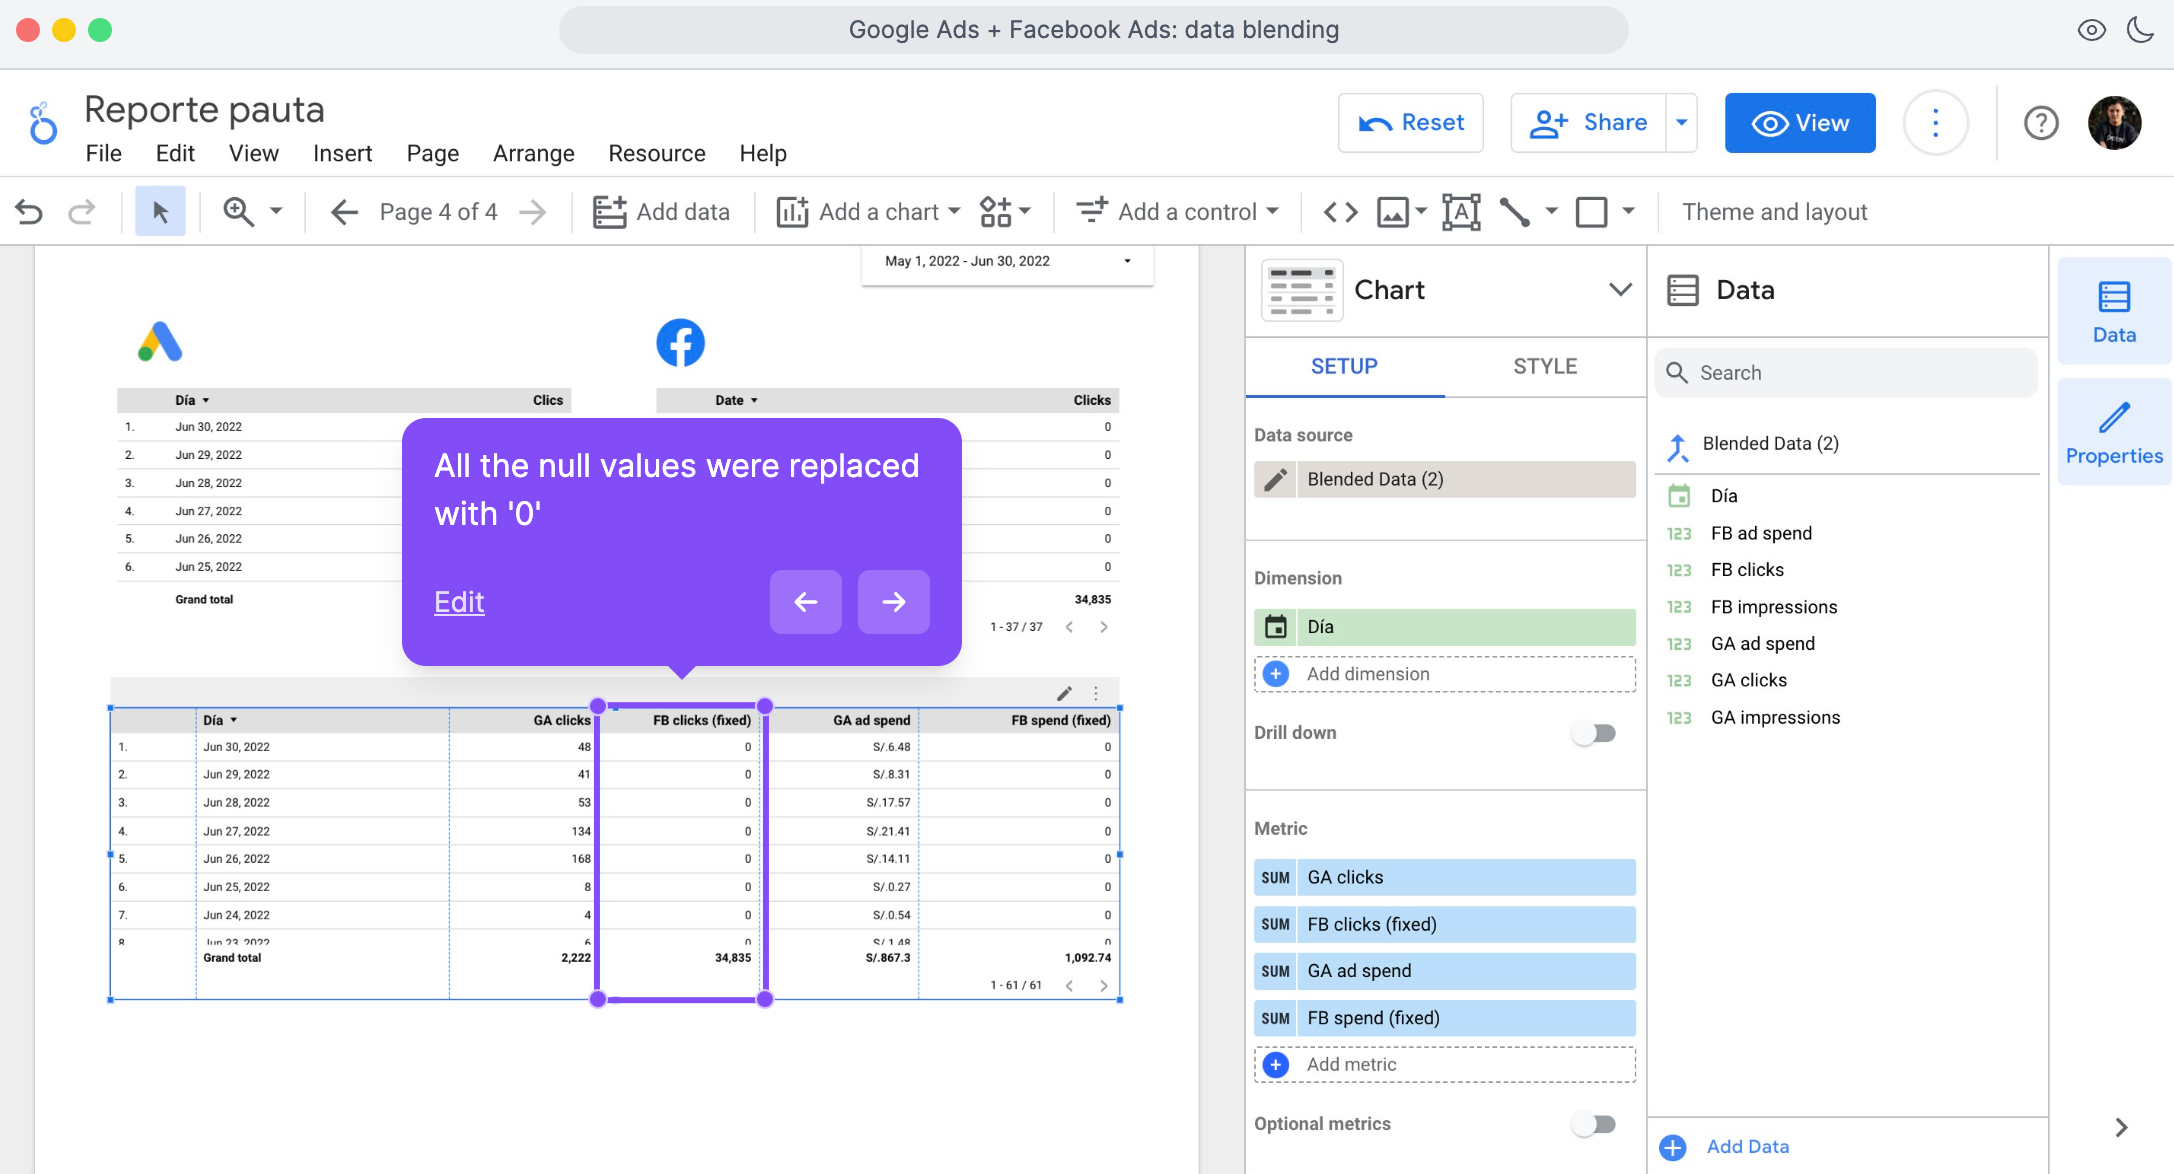
That’s it, now you can sum and aggregate your blended data without errors.
Types of Looker Studio Join configurations
Having connected our data sources to Google Looker Studio and learned about common challenges in blending your data, let’s learn how to edit join configurations in Data Studio.
There are five ways of doing this; outer, inner, and cross-joins. We’d examine each type of join configuration with use case examples.
Left outer Join
It takes as a joining basis all the values from the ‘Data A’ source (the one on the left side) and all the matching values from the right table.
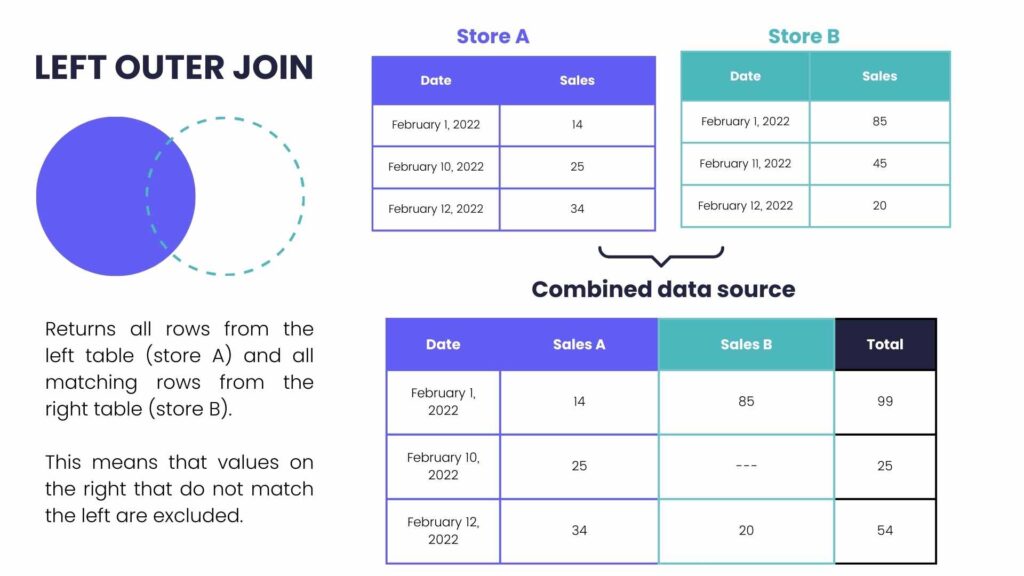
This means that the values from the right table that do not match or coincide with the left table are excluded.
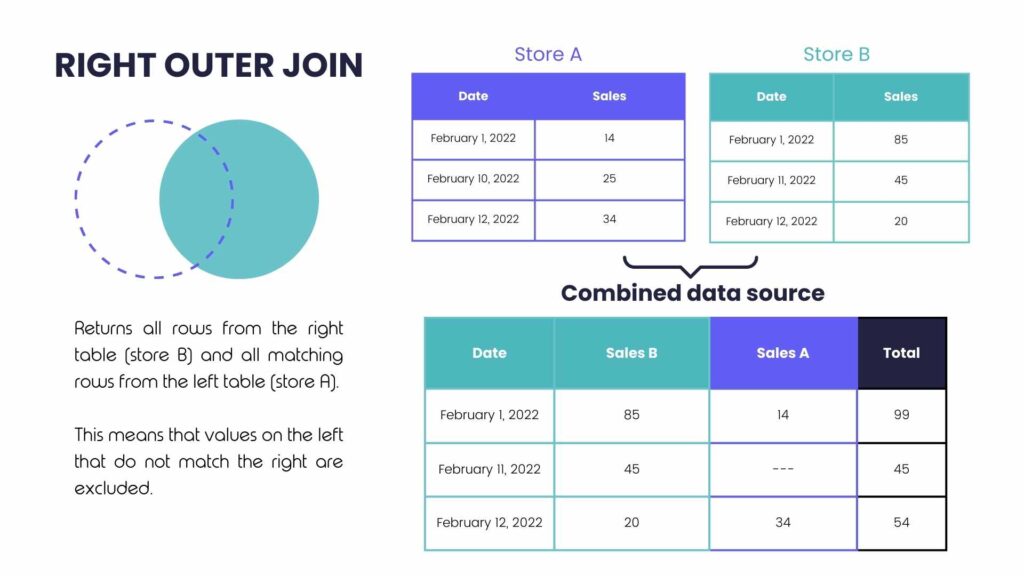
Right outer Join
A right outer join takes as a joining basis all the values from the ‘Data B’ source (the one on the right side) and all the matching values from the left table.
This means that the values from the left table that do not match or coincide with the right table are excluded. In other words, the result will include all rows from the right table and only the matching rows from the left table.
Full outer Join
A full outer join combines all the values from both the left and right tables, regardless of whether there is a match between them or not.
In other words, the result will include all rows from both the left and right tables. If there are rows in the left table that do not have a match in the right table, they will still be included in the result, and vice versa.
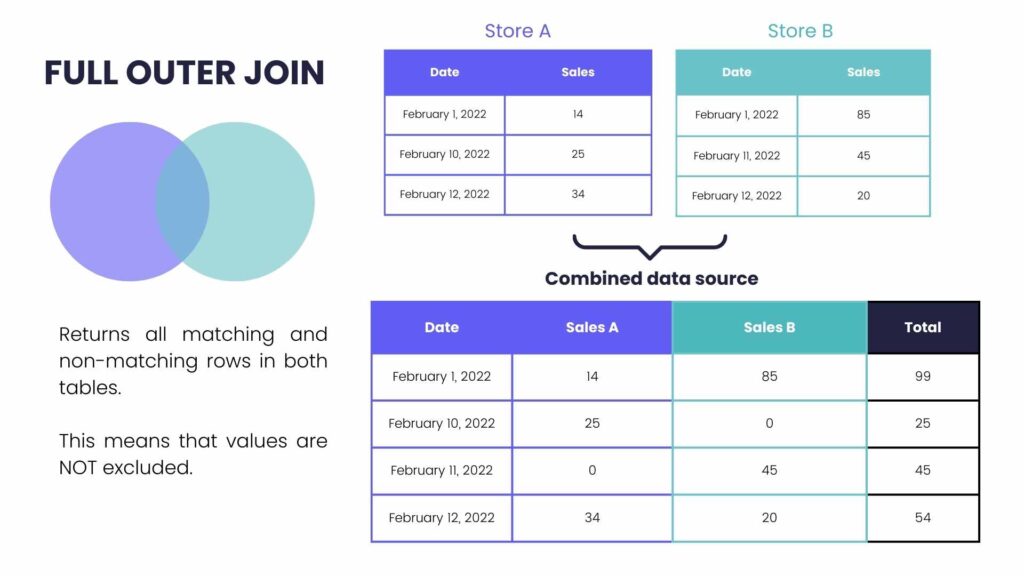
When there is no match between the tables, the missing values will be represented as null or empty values in the corresponding columns of the result table.
This type of join is useful when you want to see all the data from both tables, even if there are no corresponding matches between them. It allows you to analyze and compare the full dataset from both sources without losing any information.
Inner Join
When used to blend data, the inner join returns only matching rows from left and right tables.
In other words, the result will include only the rows where there is a match between the join key columns in both tables. Rows from either table that do not have a corresponding match in the other table will be excluded from the result

Inner joins are commonly used when you want to retrieve only the data that has a direct relationship between the two tables based on a specific key. It is useful for scenarios where you need to analyze or combine data that is guaranteed to have a matching counterpart in both tables.
For example, if you have a “customers” table and an “orders” table, an inner join can be used to retrieve only the customers who have placed an order, along with their corresponding order details.
Cross-Join
This is the only join that doesn’t require a “join key.” The cross-join returns every possible combination of rows from the left and right tables.
In other words, the result will include every row from the left table combined with every row from the right table, creating a result set that contains the product of the number of rows in both tables.
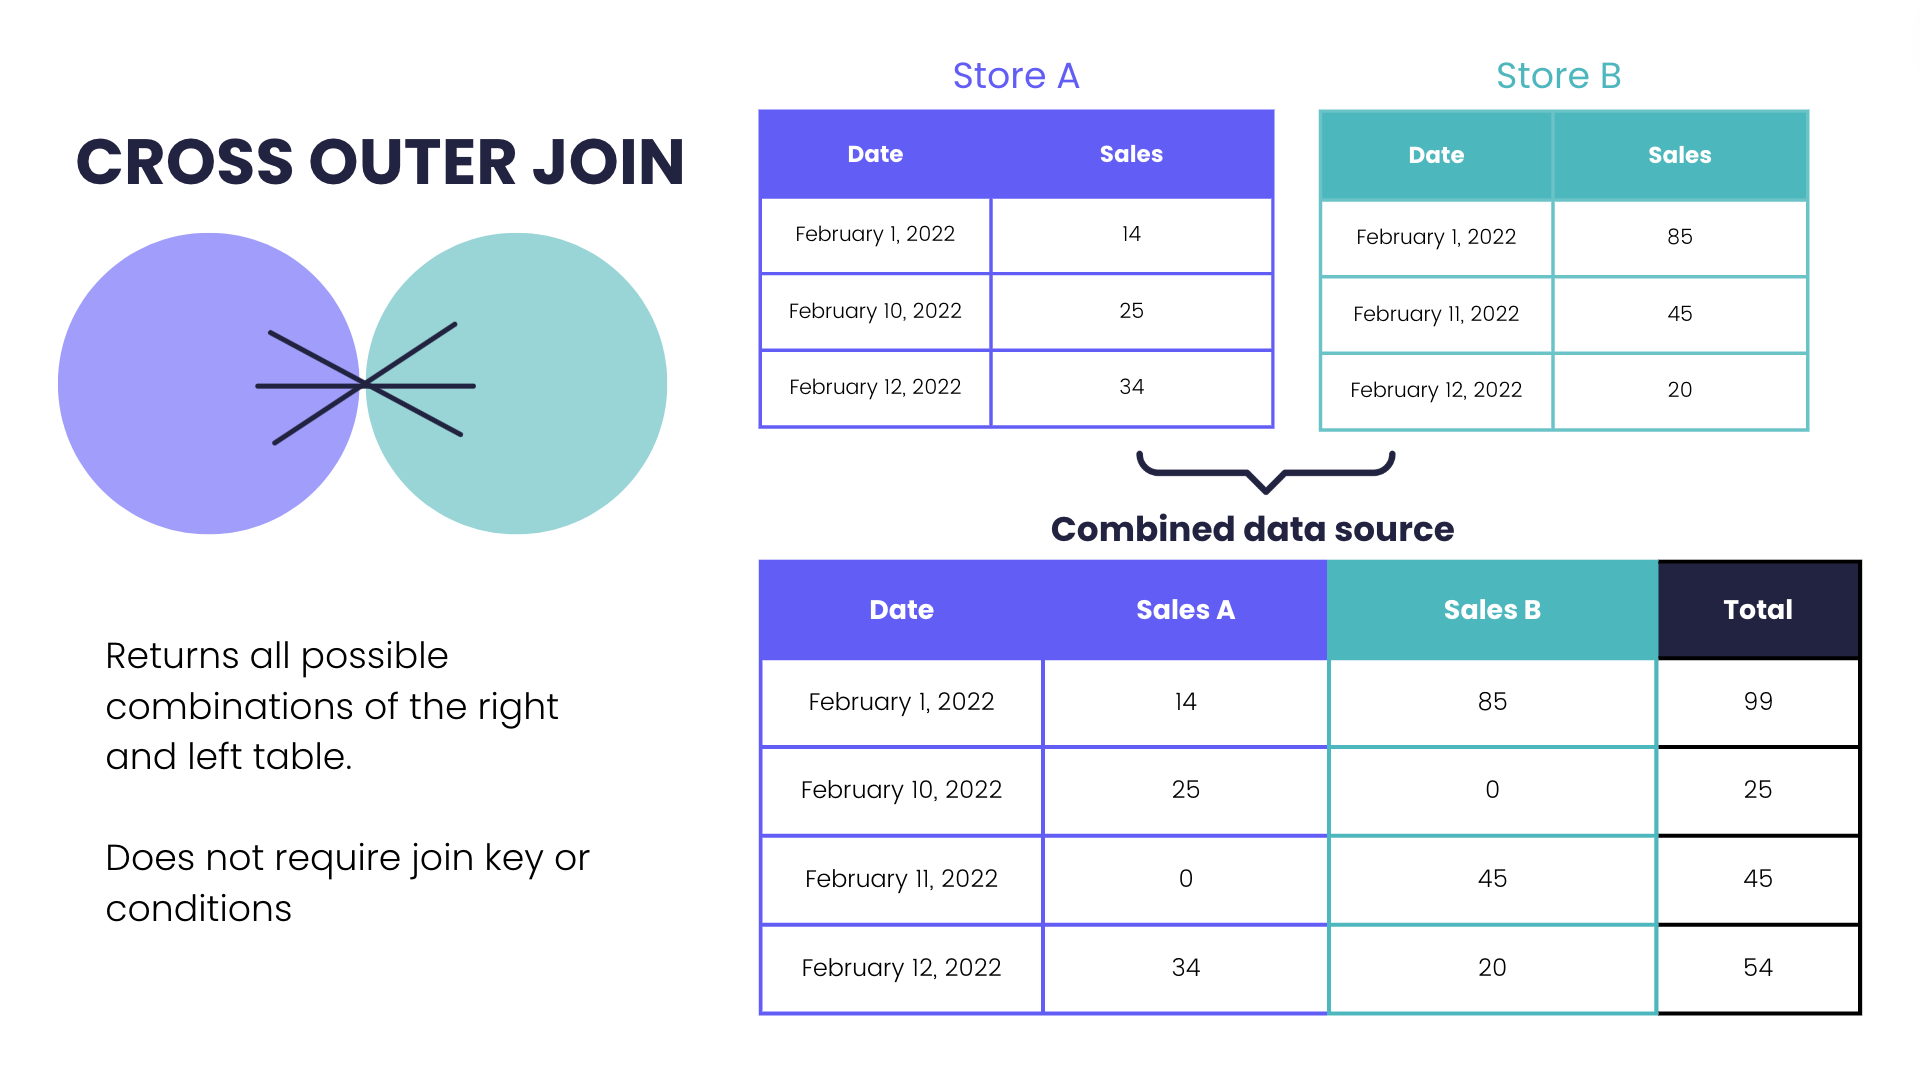
Cross joins are rarely used in practice because they generate a large number of rows and often produce meaningless results. They are typically used in specific scenarios where you need to generate all possible combinations of data, such as creating a grid or generating test data.
Edit, remove, and duplicate blended data sources
You can always edit your data blends:
Adding and removing fields from the blend
Changing the join type
Deleting the entire blend from the report
Adding another table to create a more complex join
You can manage all of this by clicking on ‘Resource’ > Manage blends

And now, you can click edit to add or remove metrics and dimensions, change the join type, or add a new join.
5. Null values troubleshooting on Google Data Studio
Null values on Google Data Studio can be a frustrating experience if you intend to report your total ad costs on Facebook and Google within a given period but haven’t spent money advertising on Facebook, for example.
Google Data Studio displays Facebook advertising costs as “null” instead of zero. To troubleshoot this, you can create a new calculated field in Google Lookers Studio using a case statement.
The formula is IFNULL(FB clicks, 0)
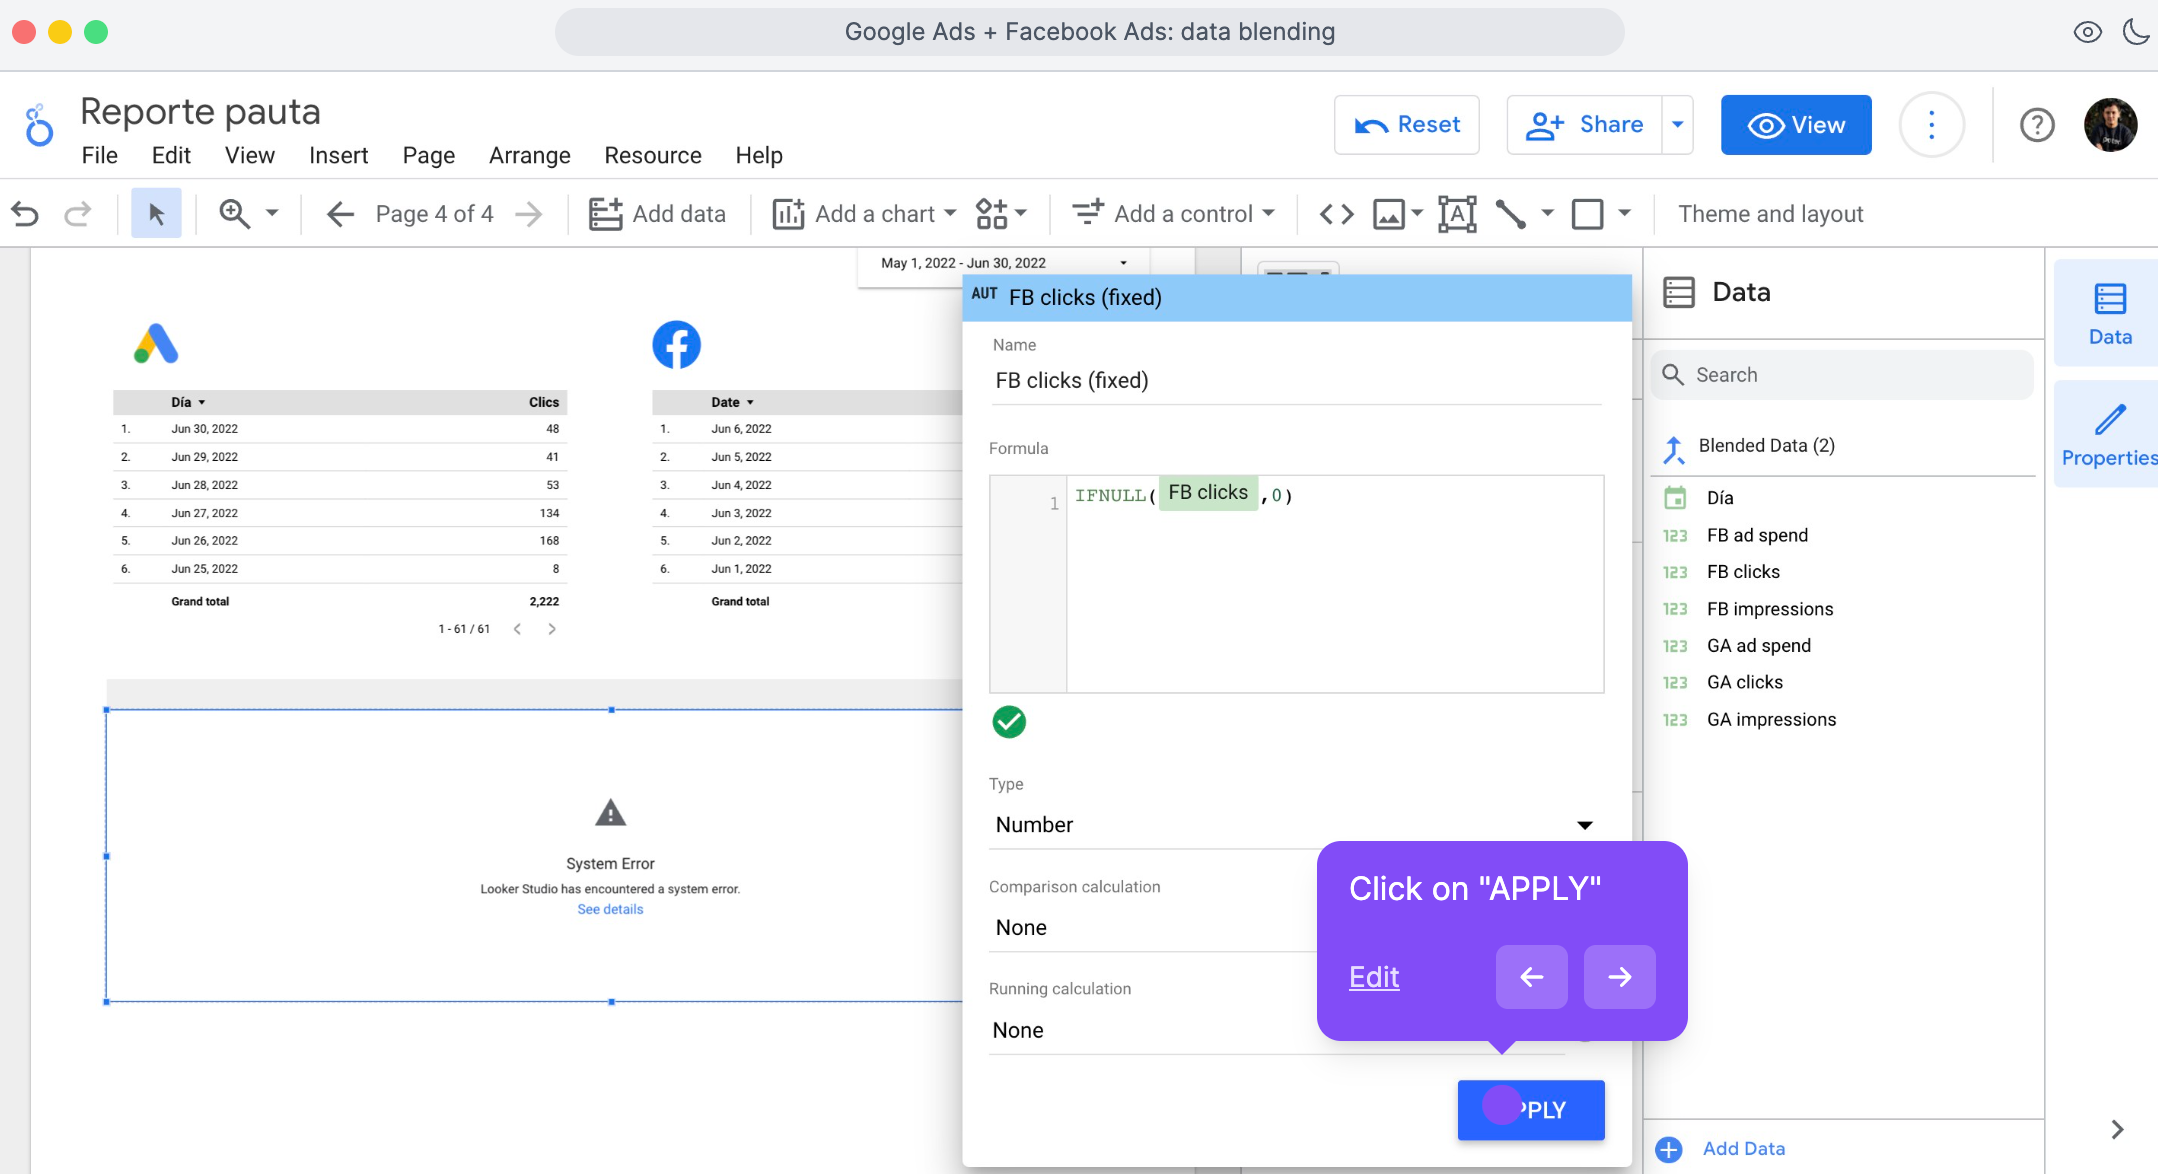
The case statement above can be used to replace null with zero. Simply replace the metric with a metric that suits your case.
Looker Studio templates with data-blending
Looker Studio templates with pre-defined data blending will save you HOURS of manual work. We have a complete Looker Studio marketing template gallery where you can copy and create reports in minutes. Here are two report examples that already include the data combination:
Facebook Ads and Google Ads Template: This template demonstrates how you can blend data from Facebook Ads and Google Ads to analyze and compare the performance of your advertising campaigns across both platforms.

By combining data from these two sources, you can gain a holistic view of your ad spend, impressions, clicks, and conversions.
The template includes visualizations and metrics that allow you to assess the effectiveness of your ads, identify trends, and make data-driven decisions to optimize your advertising strategy.
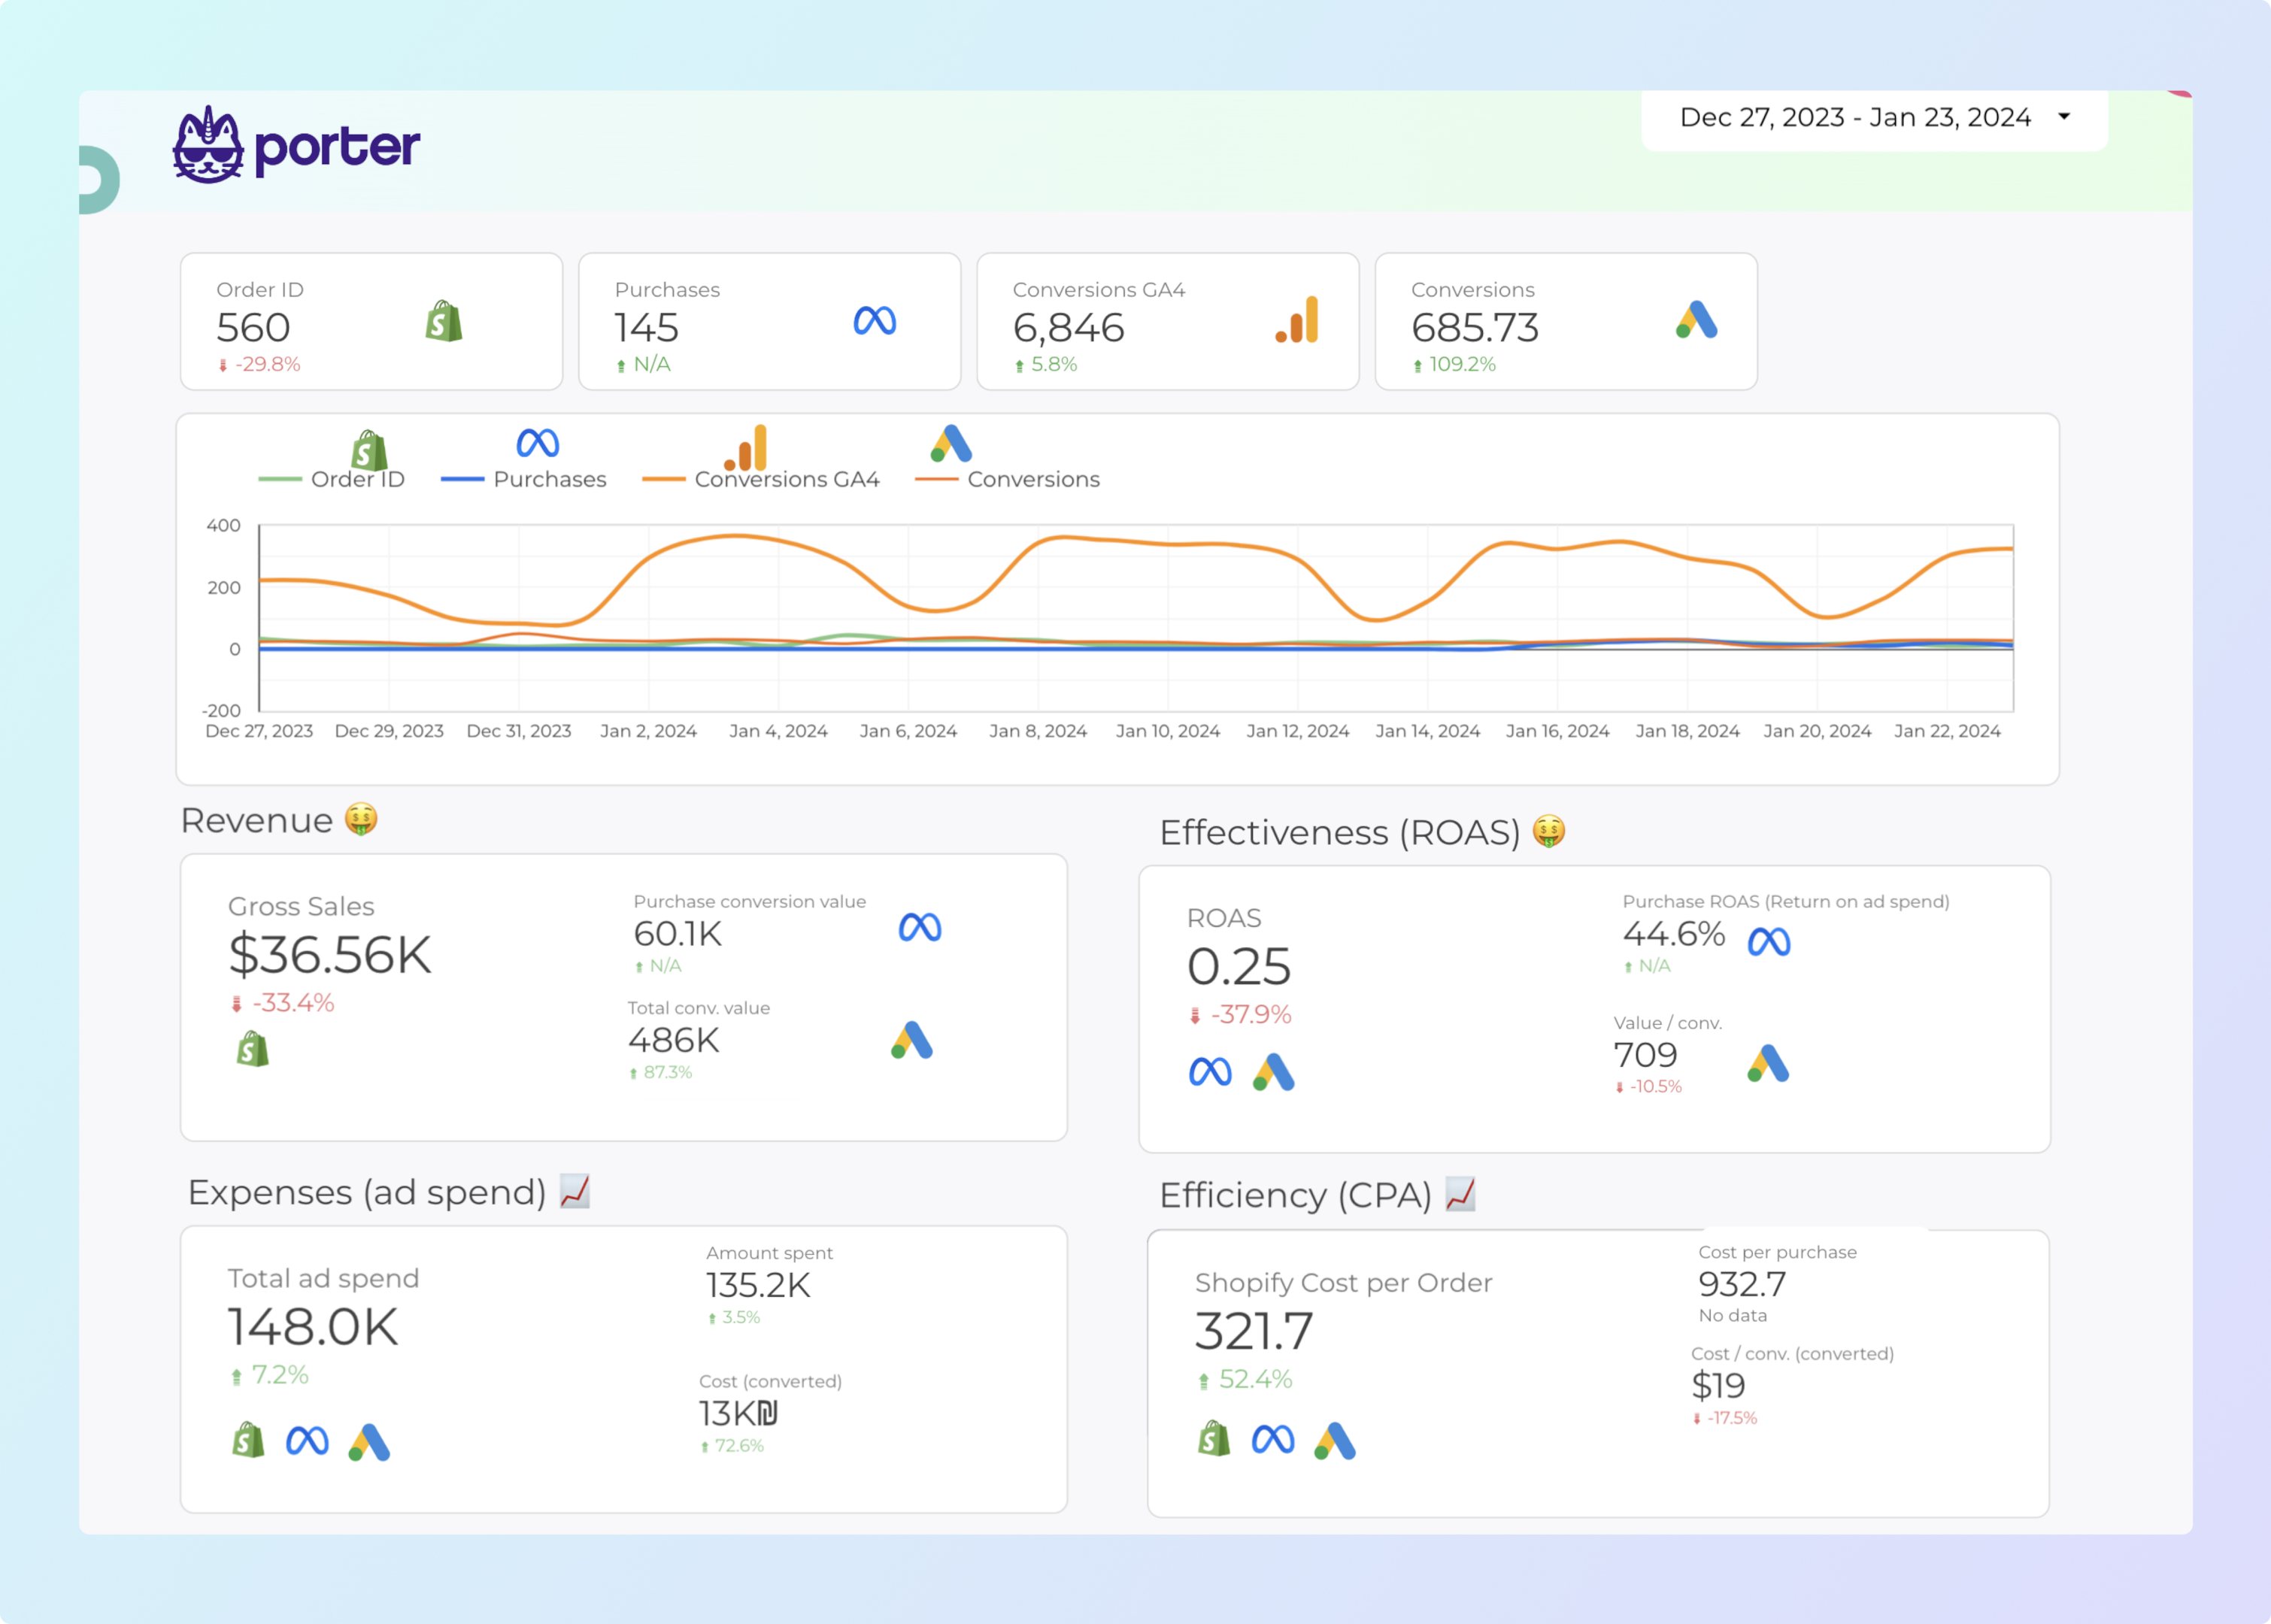
E-commerce GA4, Shopify, and Facebook Ads Template: This template showcases the integration of data from Google Analytics 4 (GA4), Shopify, and Facebook Ads to provide a comprehensive overview of your e-commerce performance.
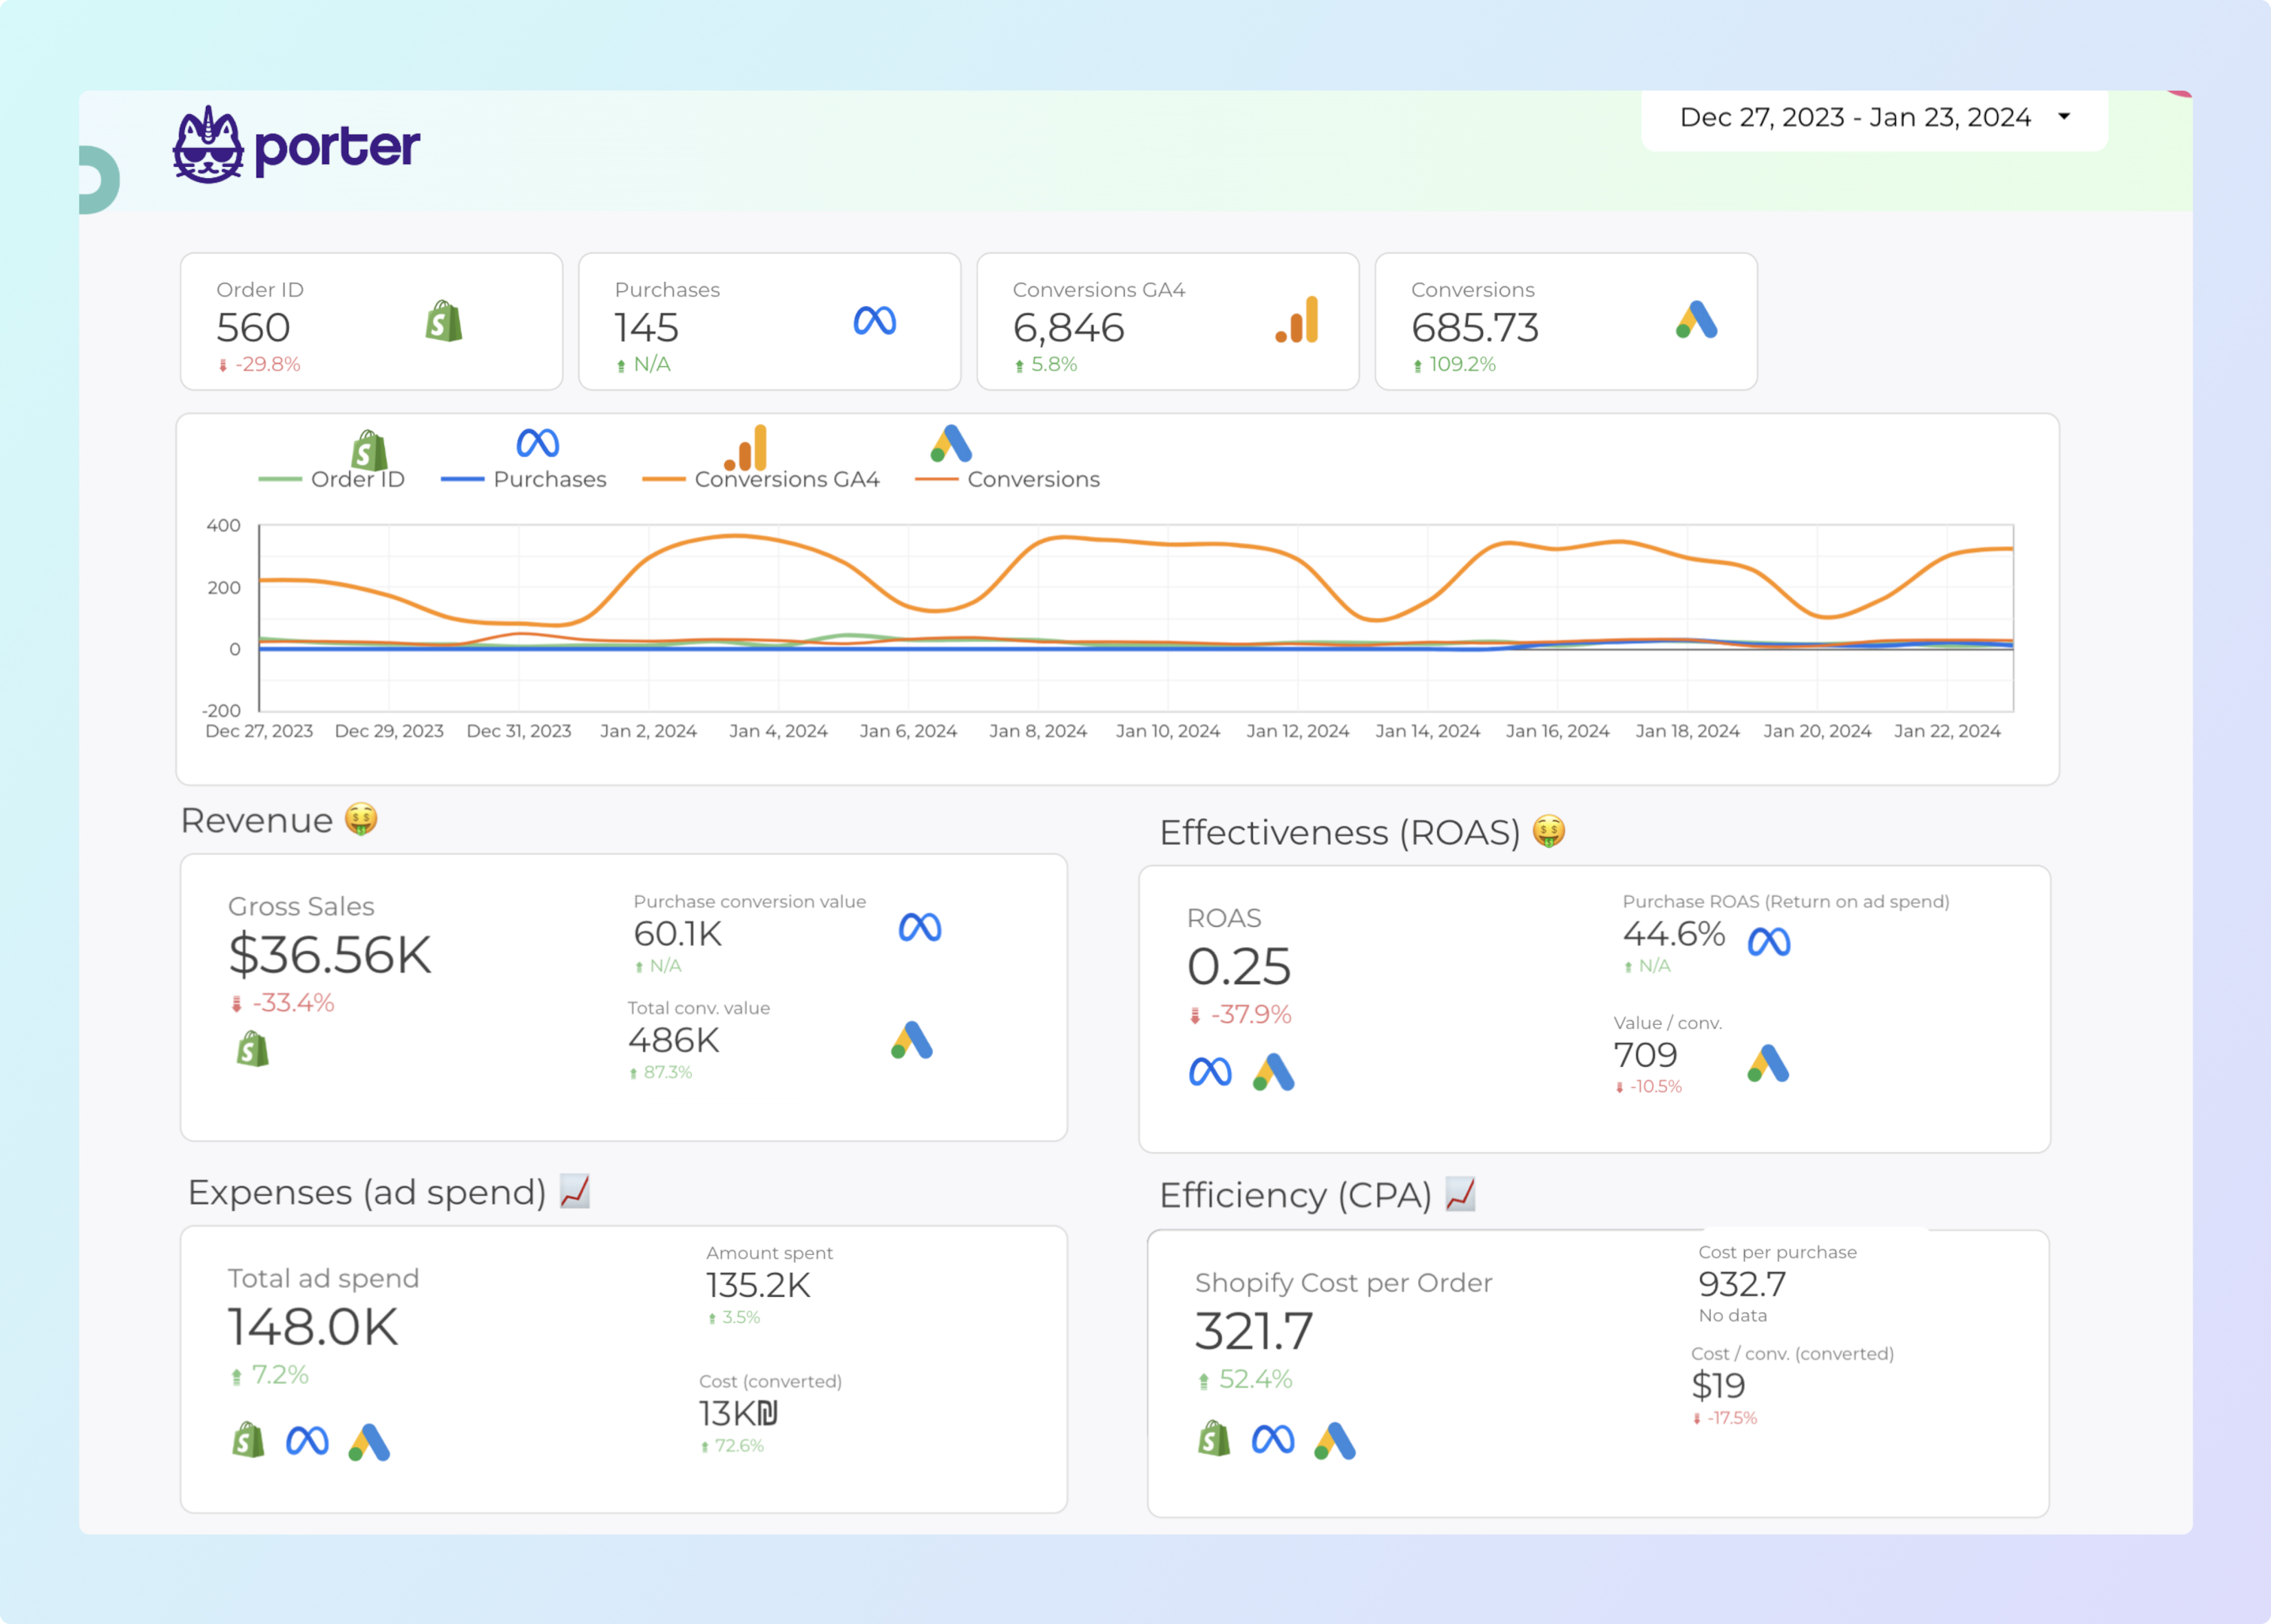
By blending data from these three sources, you can track the customer journey from acquisition to conversion and gain insights into the effectiveness of your marketing efforts.
The template includes visualizations that display key e-commerce metrics such as revenue, average order value, conversion rate, and more, allowing you to monitor the health of your online store.
Common errors when blending data
If there is too much information when combining data, the report can break.
If there is too much information in the blended data, it can cause performance issues and even break your report. The report may become slow to load, unresponsive, or fail to render properly. This is because the system has to process and display a large amount of data, which can exceed its capacity or cause memory limitations.
Solution: to mitigate this problem, you can create different pages within your report to distribute the load and improve performance. Instead of trying to display all the blended data on a single page, you can split it across multiple pages.
Null values causing broken charts
When blending data from multiple sources, it’s common to encounter null values in the resulting dataset. Null values can cause issues when creating charts or performing calculations because they represent missing or unknown data.
Solution: use an IFNULL function to replace the null values for ‘0’ as we did previously.
Limitations Of Data Blending In Google Looker Studio
Blending data in Google Looker Studio has many advantages compared to other reporting tools. Nevertheless, it comes with its unique set of limitations.
1. Blended data can be inaccurate.
Blending data on Looker Studio often returns an inaccurate result, especially when working on complex projects. These errors are sometimes difficult to spot unless you pay detailed attention to your reports.
To mitigate this error, you should blend data in bits at different levels of your reports.
2. You can only join 5 data sources simultaneously
Google Data Studio, unfortunately, doesn’t permit users to blend more than 5 data sources. This can be very frustrating for agency owners who want to create advanced and in-depth client reports.
3. Missing values
When there’s an error in a data blend, Google Looker Studio does not fix the errors automatically. The missing fields are displayed as “null.” You have to troubleshoot the problem and get it fixed.
Conclusion
Google Lookers Studio is a powerful data visualization tool that allows users to blend data from multiple sources. This makes it easy to create custom reports and dashboards that can be shared with others.
Build your first report and visualize all that data on Google Lookers Studio via our free connectors.
In creating custom reports, we understand how terrifying it is to start from scratch; hence, we’ve created beautiful report templates you can use for your reports.
This concludes this article; we hope you found it interesting and informative. If you have any questions, write us to support@portermetrics.com and we’ll be happy to answer them.
Frequently Asked Questions
Can you blend more than one data source on Looker Studio?
Yes, you can blend more than one data source on Looker Studio. You can add up to five data sources for your reports.
How do I fix system errors when blending data?
A system error could be due to the connector not being set up correctly. Ensure you properly set up our connector. You can also reach out to our support team to help you.
How to solve “unknown data source” error.
To solve this error, ensure you add a data source when making your report. If you’ve confirmed that you’ve added a data source, disconnect the connector and connect it again.
If the problem persists, wait a few hours and refresh.