An E-commerce report should include visibility metrics such as impressions, reach, and click-through rates. Engagement metrics would consist of likes, comments, shares, and time spent on site. Conversion metrics should cover conversion rate, average order value, and customer acquisition cost. These metrics should be segmented by campaign (e.g., holiday sale), channel (e.g., Facebook, Google AdWords), audience (e.g., age, location), content (e.g., blog posts, videos), objective (e.g., brand awareness, sales), and date (e.g., weekly, monthly). For example, a report might show that a Facebook campaign aimed at young adults in the United States generated a high conversion rate during the holiday season.
To analyze e-commerce data, 1) choose visibility metrics like website traffic, impressions, and reach; engagement metrics such as click-through rate, average time on page, and bounce rate; and conversion metrics including conversion rate, average order value, and customer acquisition cost. 2) Add context by comparing against previous cost per click, date range performance, sales goals, average industry rates, and benchmarks. For example, comparing the conversion rate against the industry average of 2% or analyzing the cost per acquisition compared to the budgeted amount. 3) Segment data by campaign (Black Friday sale, summer promotion), channel (social media, email marketing), audience (millennials, women), content (video, blog post), objective (brand awareness, direct sales), and date (monthly, quarterly).
To build an e-commerce dashboard, 1) connect your data and accounts from platforms like Google Analytics, Shopify, or WooCommerce. 2) Select metrics such as sales, conversion rates, and customer retention to monitor performance. 3) Segment data by campaign, channel (like email, social media), audience demographics, product categories, customer content (like reviews), objective (like increasing sales), and date. 4) Add filters or buttons for metrics like region, product type, or time period to make your report interactive. 5) Share your dashboard via PDF, scheduled emails, or links to relevant stakeholders.
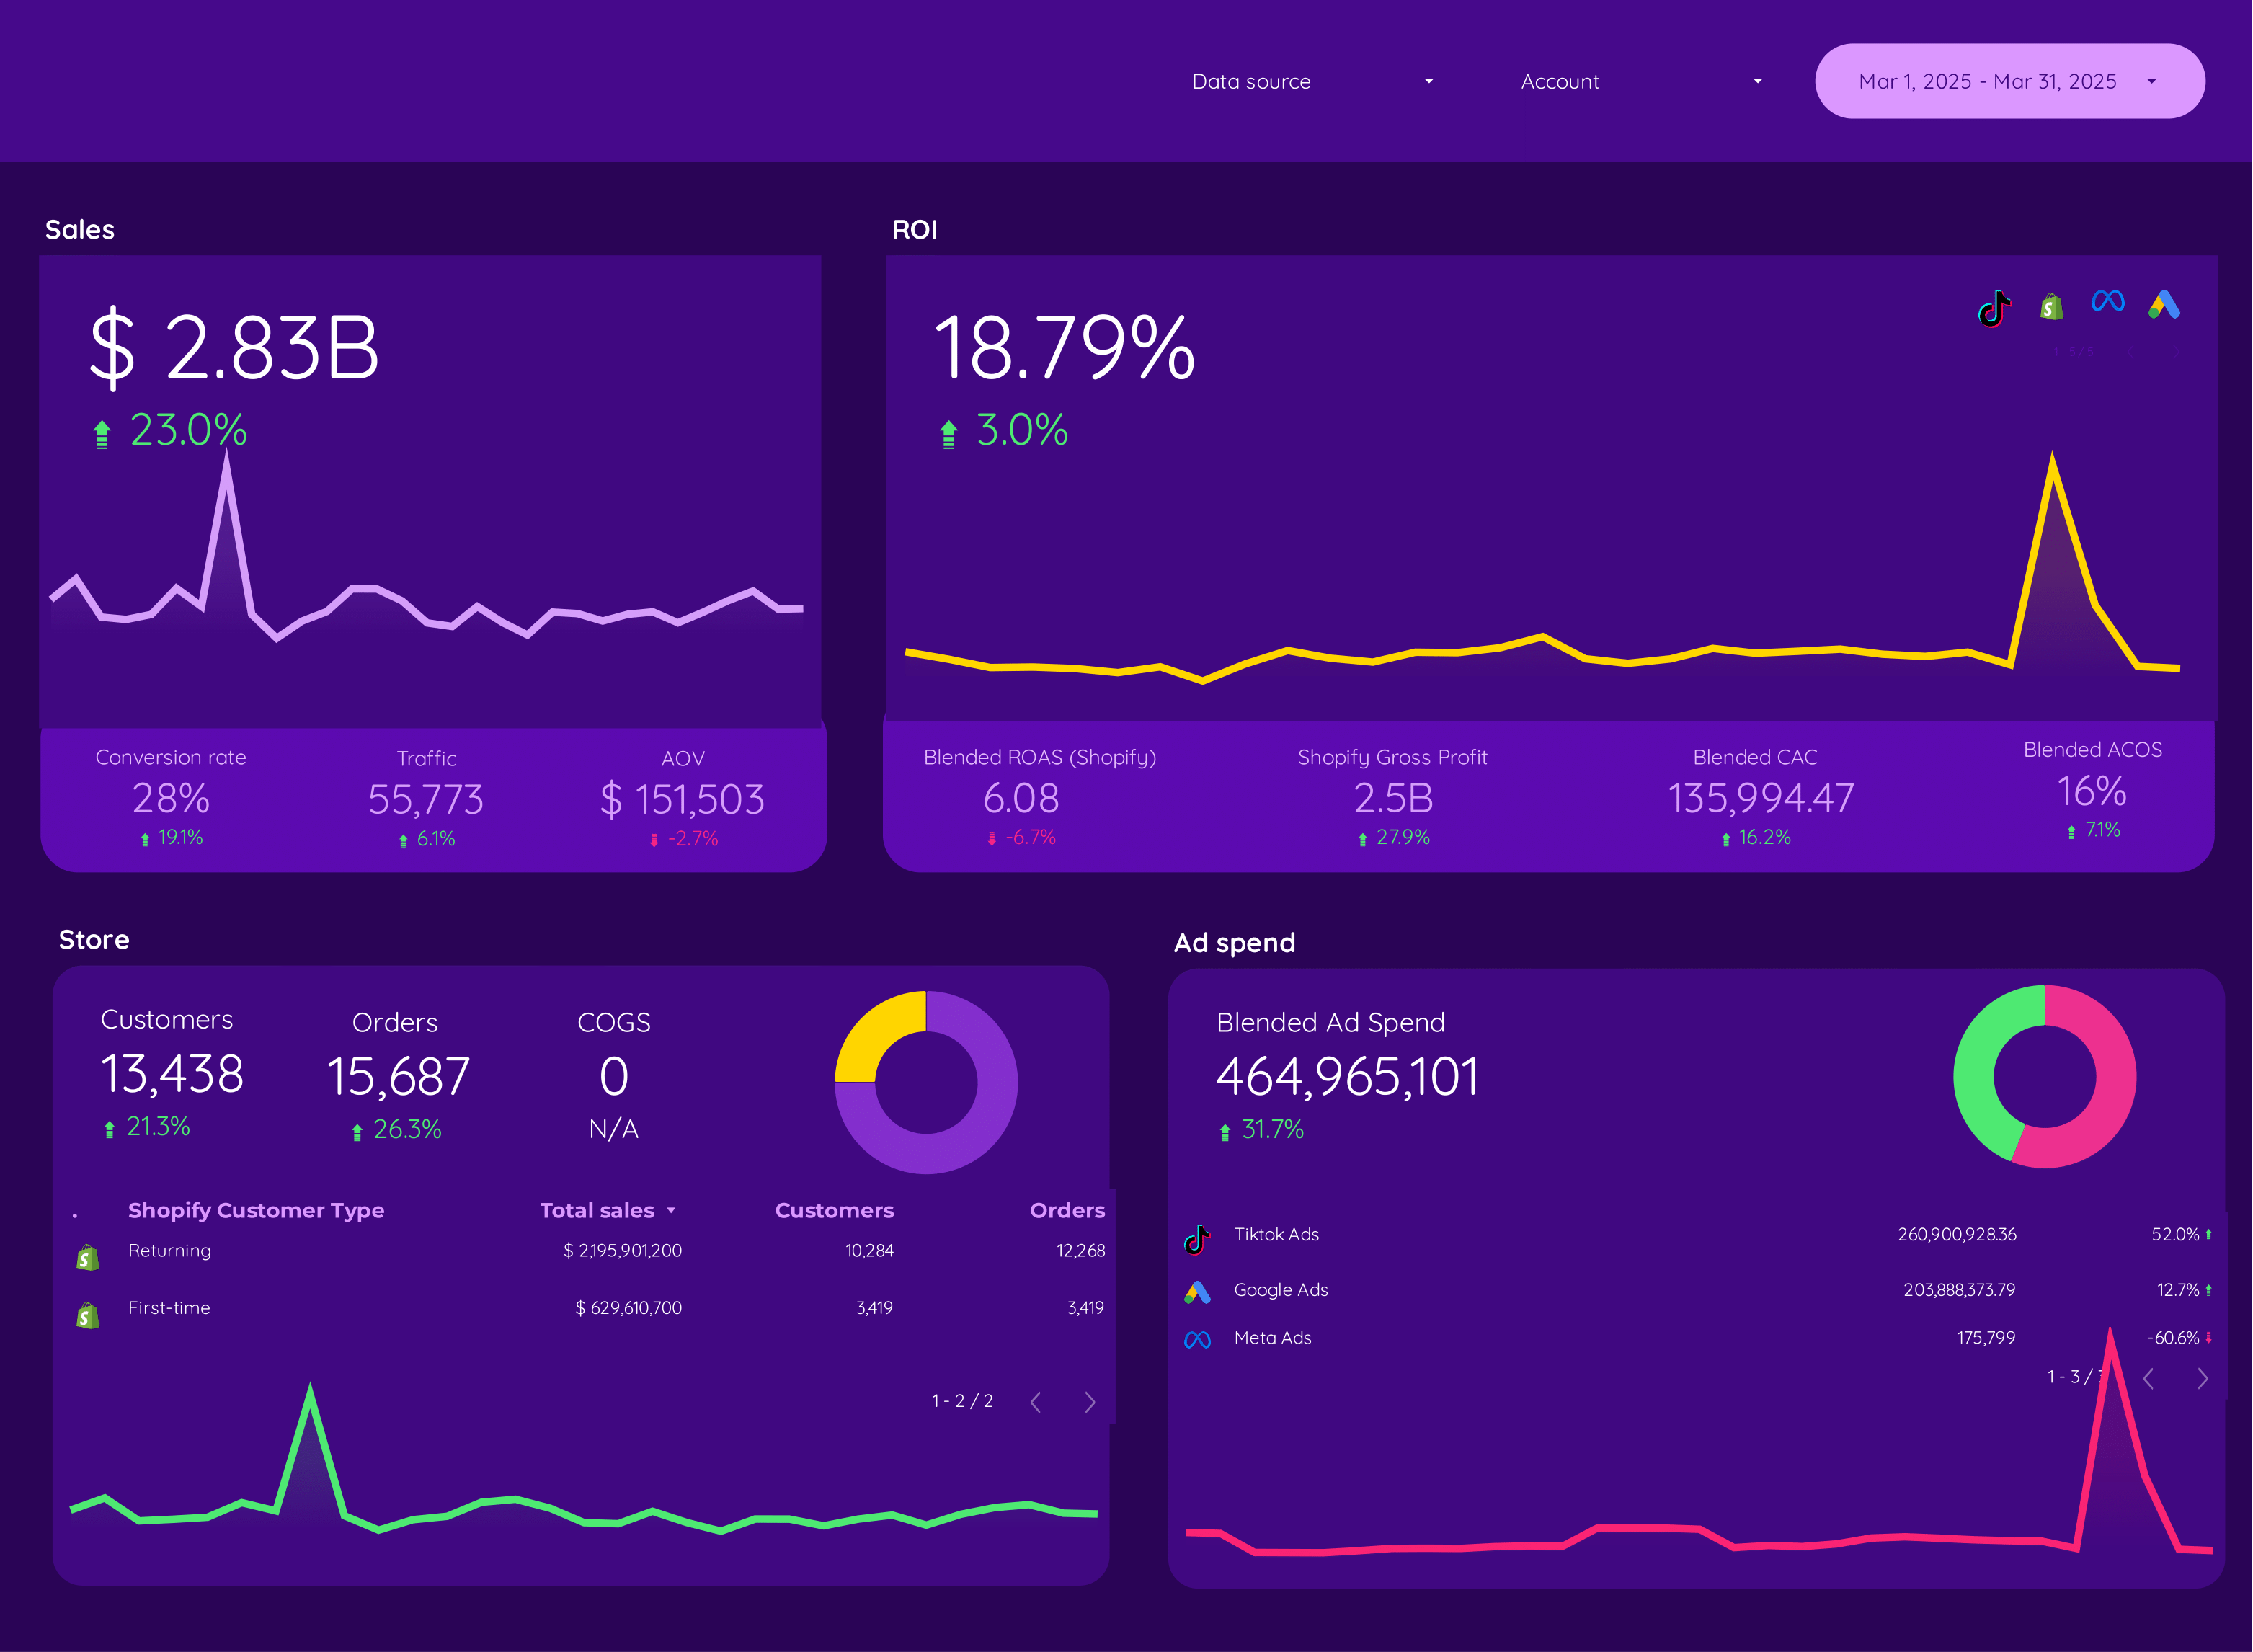
An e-commerce dashboard is a visual tool that aggregates and displays key performance metrics and data related to online sales and marketing activities. It typically includes data from various platforms such as Google Analytics 4, Facebook Ads, Google Ads, Shopify, Klaviyo, and others. The dashboard provides insights into metrics like impressions, clicks, ad spend, conversion rates, CTR, ROAS, CPC, CPM, open rates, bounce rates, sessions, orders, and revenue. This helps businesses monitor and analyze their e-commerce performance, optimize marketing strategies, and make informed decisions.


 Shopify
 Facebook Ads
 Google Ads
 Klaviyo
 Google Analytics 4
 TikTok Ads
 Instagram Insights
 Facebook Insights
 TikTok
 Impressions