Connect Amazon Seller Central to Google Looker Studio
+1500 customers worldwide, including


Honestly, do we need another Amazon reporting tool?
Or you can use Porter, so you get your reports in the tools you’re already familiar with and where your data is already.


Still wasting time with manual reporting?
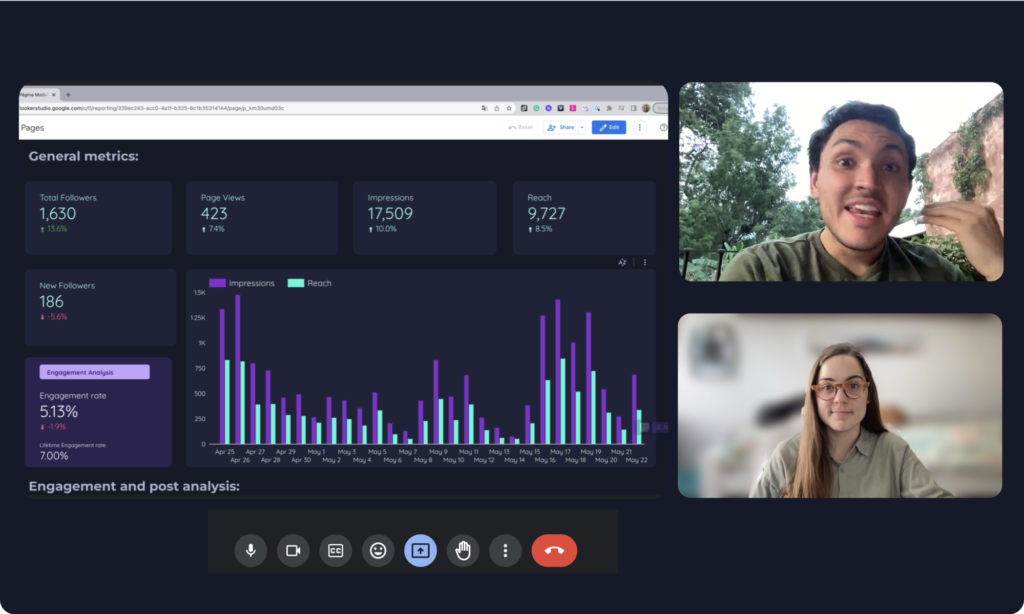
Most marketers still spend 10% of their time copy-pasting data on sheets and taking screenshots for their reporting
❌ Typos and data entry mistakes happen often
❌ Don’t know what to improve on time
❌ You don’t have time to focus on what matters

Other reporting tools just make you slower
Every new Shopify reporting solution comes with great new problems:
❌ Your team needs re-training on yet another marketing tool
❌ You to require developers (and wait for them for weeks for an implementation)
❌ Commonly not self-service; you need to wait weeks for quotes, implementations, and changes


Here’s How to automate your Amazon reports within minutes
With Porter, you get your Shopify reports in the tools you’re already familiar with so you


- Do it yourself
- Don’t need to learn just another tool
- Don’t code or hire developers

Step #1
Securely connect your data
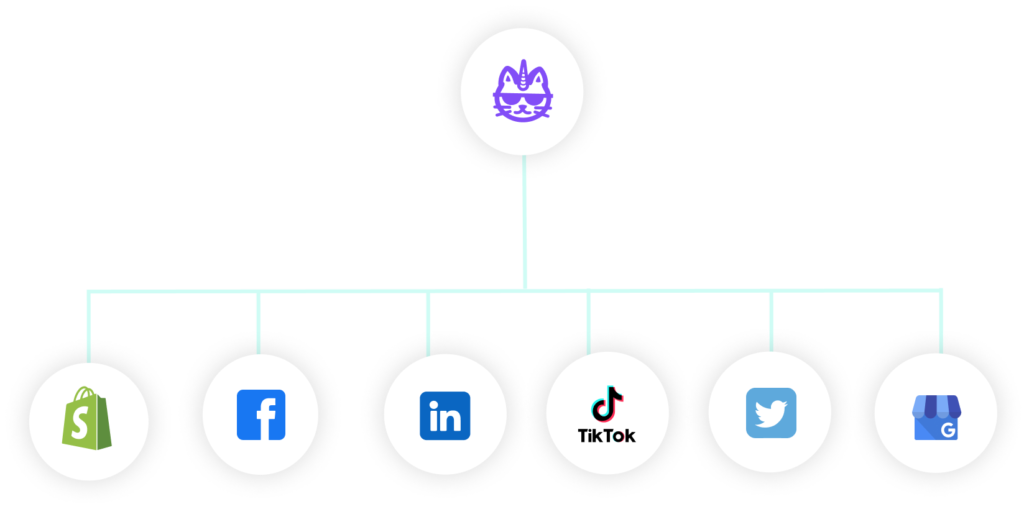
We connect your Shopify accounts—along with all your marketing data—so you can get it all in one place.
- Blend and combine your data from different sources
- Bring multiple Shopify accounts data consolidated
- Connect with Google

Step #2
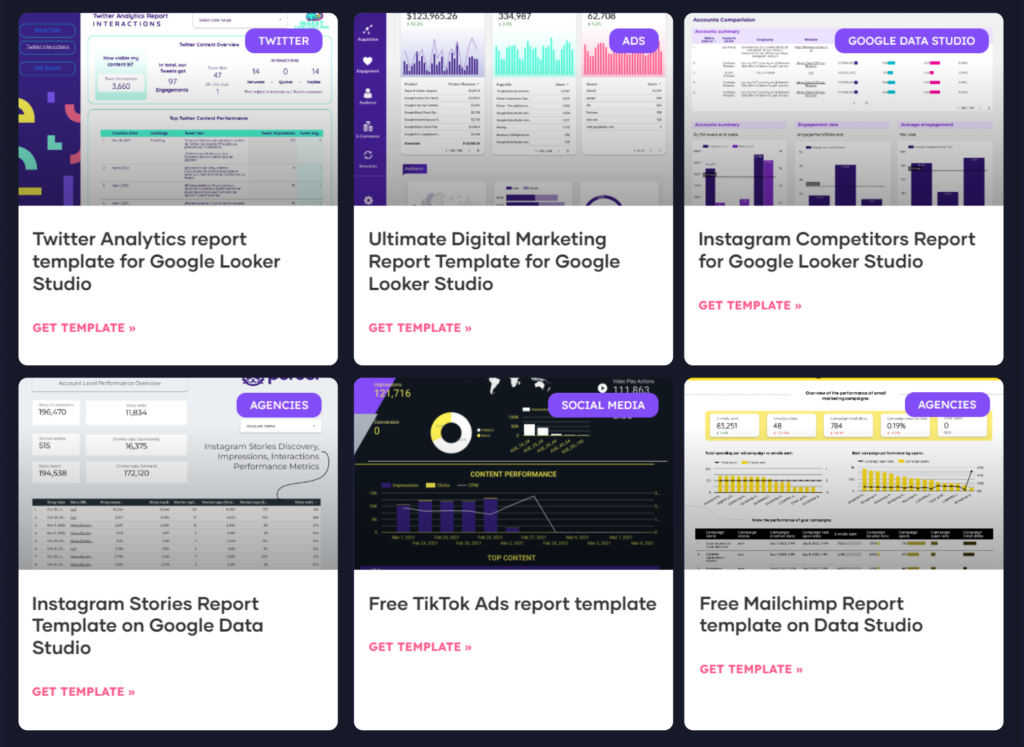
Use our +80 report templates
Once data is connected, you’ll load our default report templates so you don’t need to do it yourself or learn anything.
- 100% customizable
- +80 templates for every use case
- Made by marketers and agencies
- Import your existing reports to a fresh and comprehensive template
- Copy and paste charts from a template to your reports

Step #3
Custom widgets and charts

Step #3
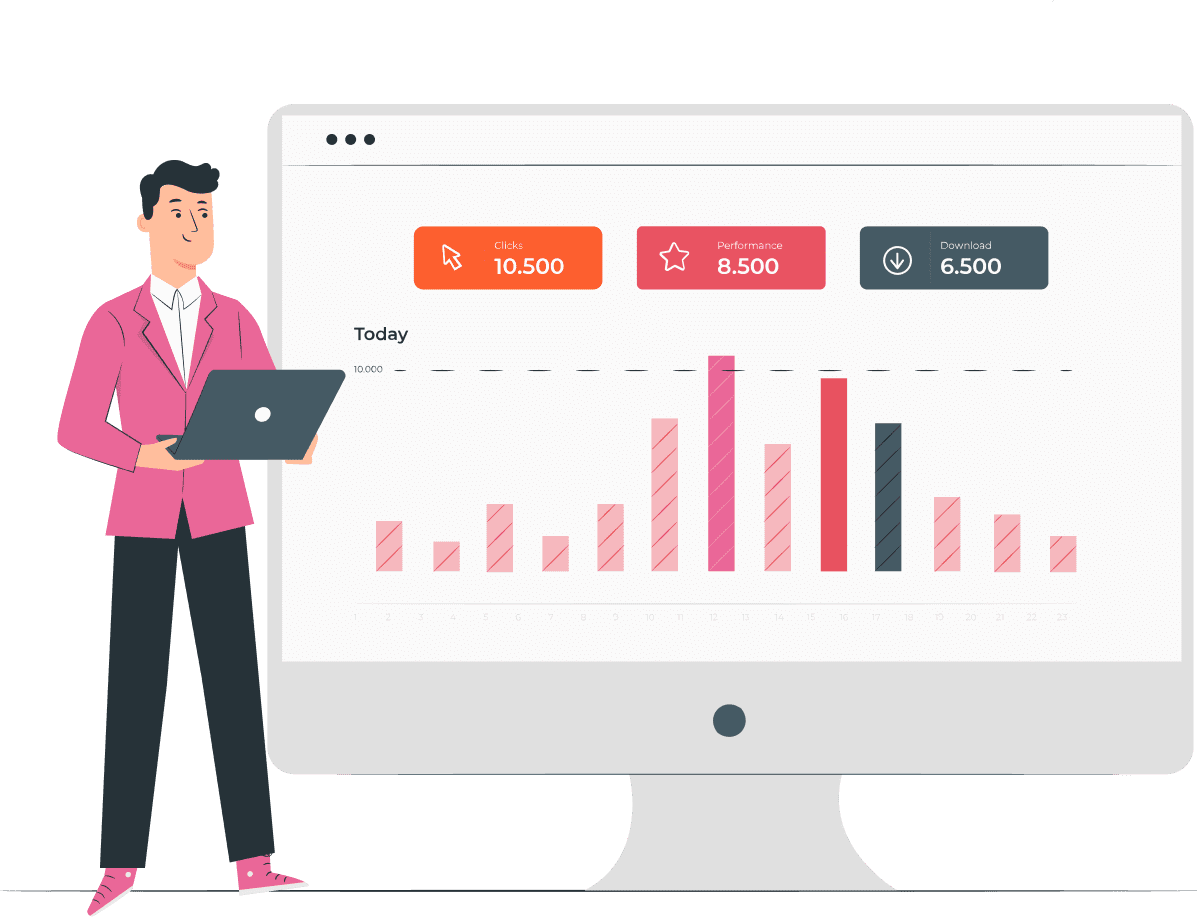
Create custom widgets and charts
Leverage Google Data Studio’s dashboarding capabilities with dozens of chart types like.
- Scorecards
- Time-series and area charts
- Bar charts or pie charts
- Tables and pivot tables
- Geo maps
- Bring your ads images, texts, CTA, link and previews

Can I have a preview of my Facebook Ads?
Yes, you can bring your ads images, text, CTAs, links, and previews
Step #4
Visualize all your metrics and KPIs
+200 metrics and dimensions to analyze your Shopify data as needed.
- Create your own custom metrics like done on Google Sheets
- Custom metrics like CPA or engagement rate included
- Custom and standard conversions included
- 5+ Currency conversion options for amount spent

What Shopify metrics do you offer?
We’re creating a Shopify field list for you to access soon.
Can I create any type of chart or table?
Yes, Data Studio is versatile, and allows you and your team to visualize data as you wish.
Combine metrics and use filters to create meaningful analyses.
Step #5
Make interactive reports
- Custom and preset date ranges
- Compare against last period, last year, or custom ranges
- Apply filters, search bars, and breakdowns
- Break down your data by campaign, country, device, and dozens of options more
- Pull your historical data that Shopify API allows (generally 2 years).
- Group your campaigns data by product, funnel stage or content type
Step #6
Leverage white-label Shopify reports
- Custom fonts
- Change dashboard layout size
- Charts and background colors
- Add logos and images


Can I schedule weekly and monthly reports?
Yes, Google Data Studio lets you schedule report emails with any frequency to the email addresses you choose.
Step #7
Share your reports
Choose how you want others to access your Shopify reports.
- Download PDF version of your reports
- Schedule automated email deliveries
- Export your data to Google Sheets or CSV
- Share viewer or editor access through public or private links (like all Google Suite products)
- Embed your reports on any website
- Customize your report pages’ height and width to adjust to any device, make them mobile friendly


Shopify reporting use cases included


Tutorials
Learn how to analyze your Shopify data
- How to set up a Shopify report
- Shopify reporting video tutorial
- Access our Shopify report templates
- Help center and troubleshooting


Support
Customers choose us for our support
- Live chat and email support for everyone
- Schedule a free report setup; get our team making your reports for free!
- Get community support on our Facebook group
Get inspired with the templates Porter has prepared for you!
Get your reporting done in seconds with our ever-growing gallery of Data Studio report templates inspired by our clients and marketers from all around the world.
- Combine multiple sources in one visualization
- Leverage the power of Google Data Studio
- Initial template with multiple use cases included


+1520 companies and agencies are fully automating their Shopify reporting now


What are you waiting for?
In a nutshell, Porter is built for marketers who don’t code, want to do things by themselves, appreciate personalized support and hate bureaucracy.
Start with a 14-day trial. It takes less than 1 minute to set up your first report.
- Unlimited charts and historical data
- Built for busy or lazy marketers
- No credit card required
- No coding skills needed


