Both Manychat and Google Data Studio are some of my favorite software products.
I will honor them with a step-by-step tutorial to help you automate Manychat reports on Google Data Studio automatically and for free.
We will follow three steps:
- Sending Manychat Data to Google Sheets
- Connecting Google Sheets to Data Studio
- Creating a Google Data Studio report
But first, let’s see some use cases so you can understand why reporting Manychat on Google Data Studio makes sense.
Manychat reports use cases.
I attended Conversations 2019 in Austin, Texas, an event hosted by Manychat. Mikael Yan—CEO of Manychat—did something quite interesting: he asked people to upvote new features on stage by shouting.
The louder, the more upvoted a feature was.
The most requested features were the tracking pixel – already released – and better reporting.
They changed their reporting layout but, to me, it missed the point: to show reports to clients and teams it shouldn’t happen inside Manychat.
While their layout is simple and cool, some businesses would like to visualize their data in other ways.
And, more importantly, there’s a lot of data that you can get on Manychat, but it only gives audience insights.
But there are many Manychat reporting use cases.
Client reporting: the most important use case, to me, is showing your Messenger performance to others who don’t know or care about Manychat, like your customers and team. For doing this, you should place the data where users need it—such as a Business Intelligence tool like Google Data Studio or Power BI— not where Manychat can.
Workflows reports: if you want to report for specific flows like promotions, quizzes, or Facebook Ads flows, you can create them on Google Data Studio.
Combining with other reports: with Porter, you can automatically connect your Facebook Ads data so you can map your marketing funnel y from Facebook Ads to your Manychat flows.
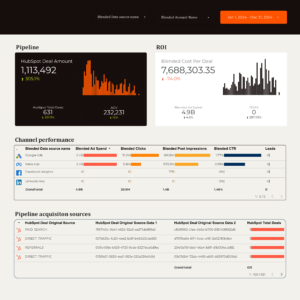
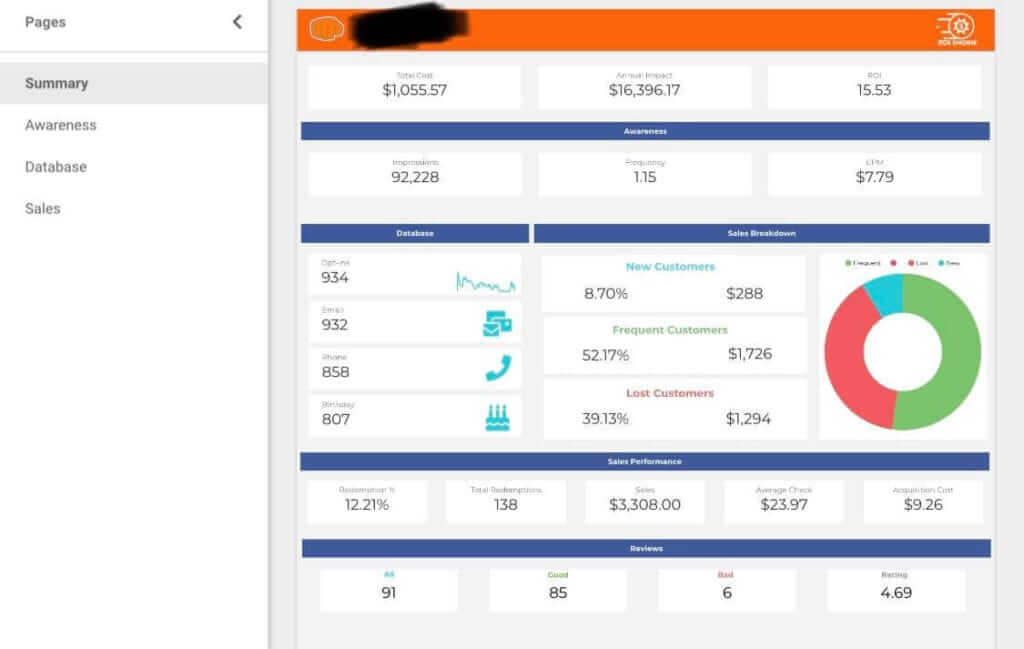
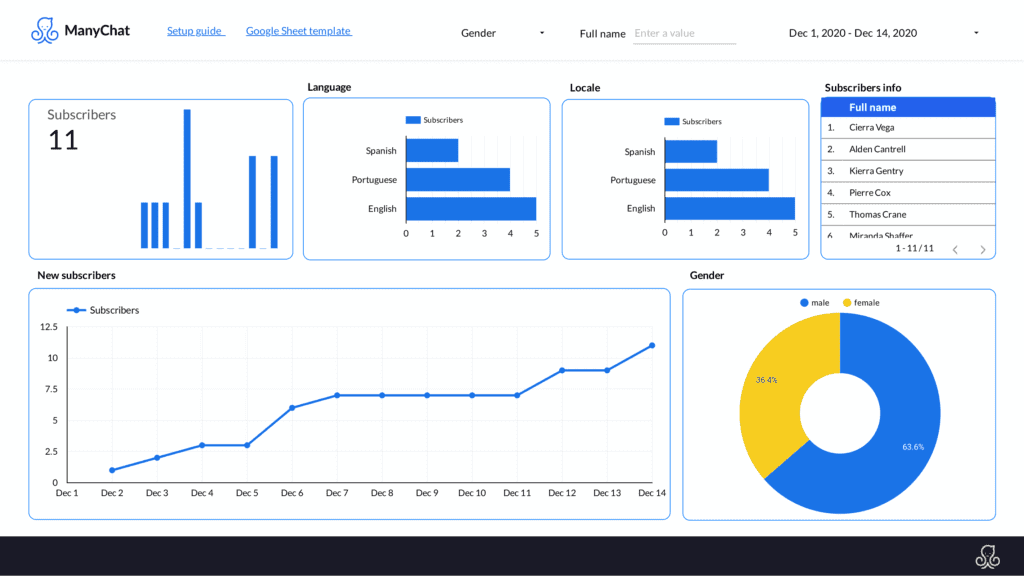
This is an actual example of a Manychat report on Google Data Studio, showing subscribers’ data, engagements, demographics, and workflow behavior.
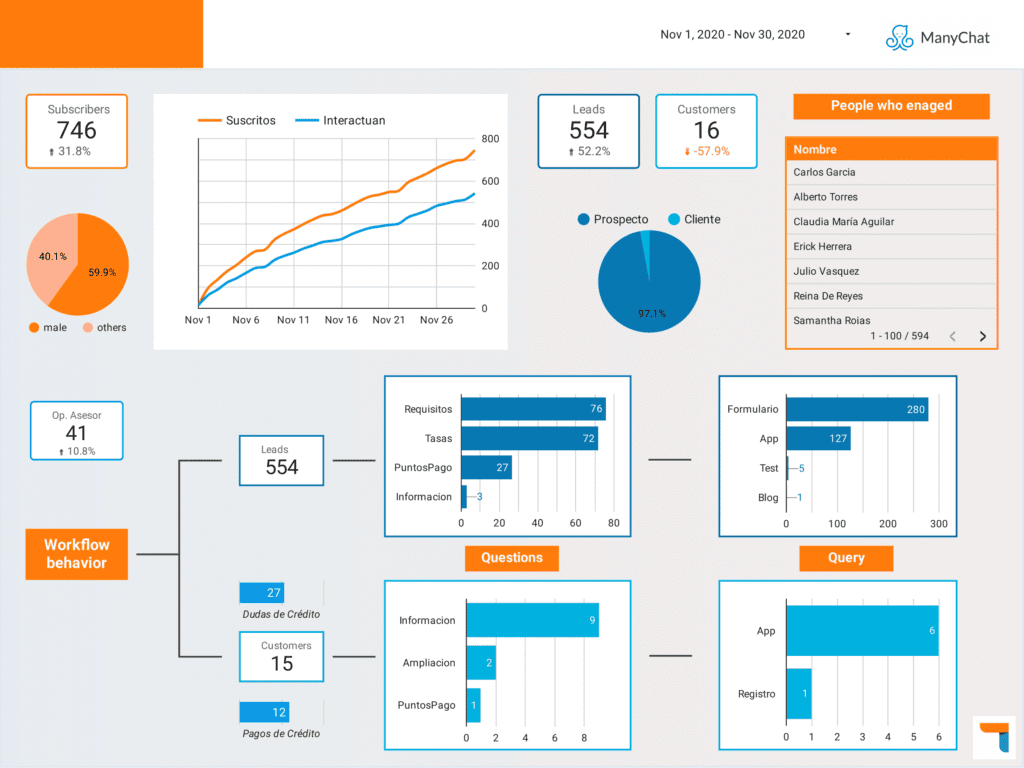
Here’s another example of a Manychat report on Data Studio. In this case, this Manychat flow lets users redeem coupons so sales can be tracked and customer data requested during the flow.
Let’s create our Data Studio reports with Manychat.
Sending Manychat Data to Google Sheets
The objective of this step is creating a new Google Sheet row with data brought from Manychat.
Two ways to send data to Google Data Studio are by using rules or creating actions inside flows. They work pretty similar, though.
Manychat offers documentation for these features:
In this case, I will use Manychat rules.
Login to Manychat and go to Automation – Rules.
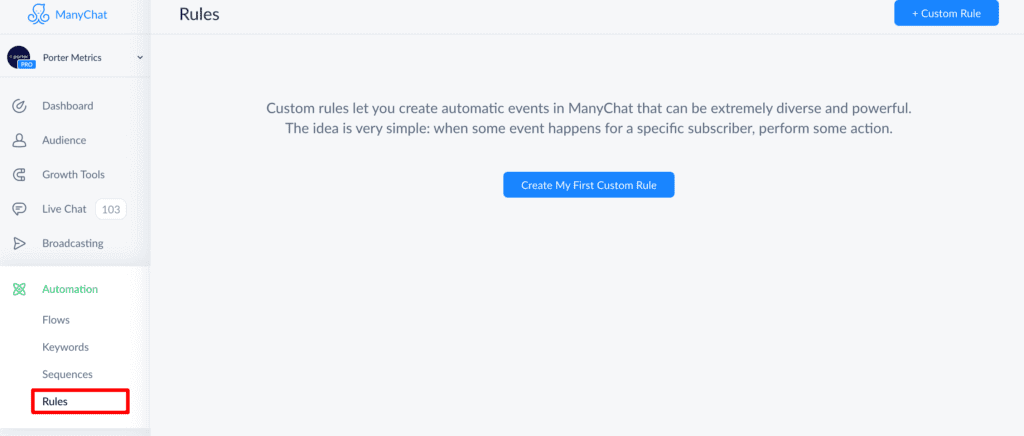
Create a new rule and set a trigger.
Rules let you activate automations. A trigger is the first step to call out such automations.
You may select a trigger based on the data you want to report:
- if you want to track a specific flow or user behavior, you may trigger based on tags and custom fields.
- If you want to monitor audiences and subscribers, the trigger could be set whenever a new subscriber joins your list.
- The log conversion event trigger would fit for monitoring conversions and sales performance.
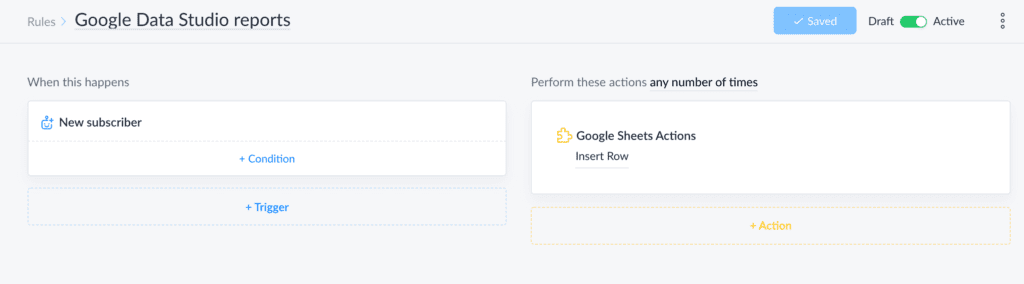
For this example, I want to have a generic report that includes data of all our new subscribers, so I will choose the New subscriber trigger.
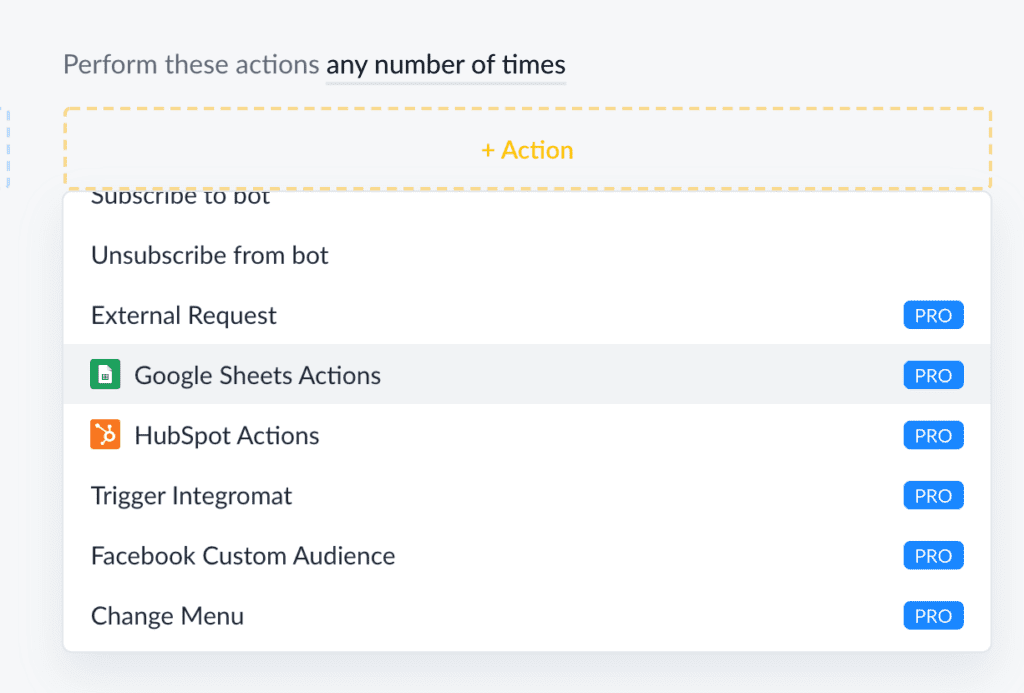
Choose Insert Row.
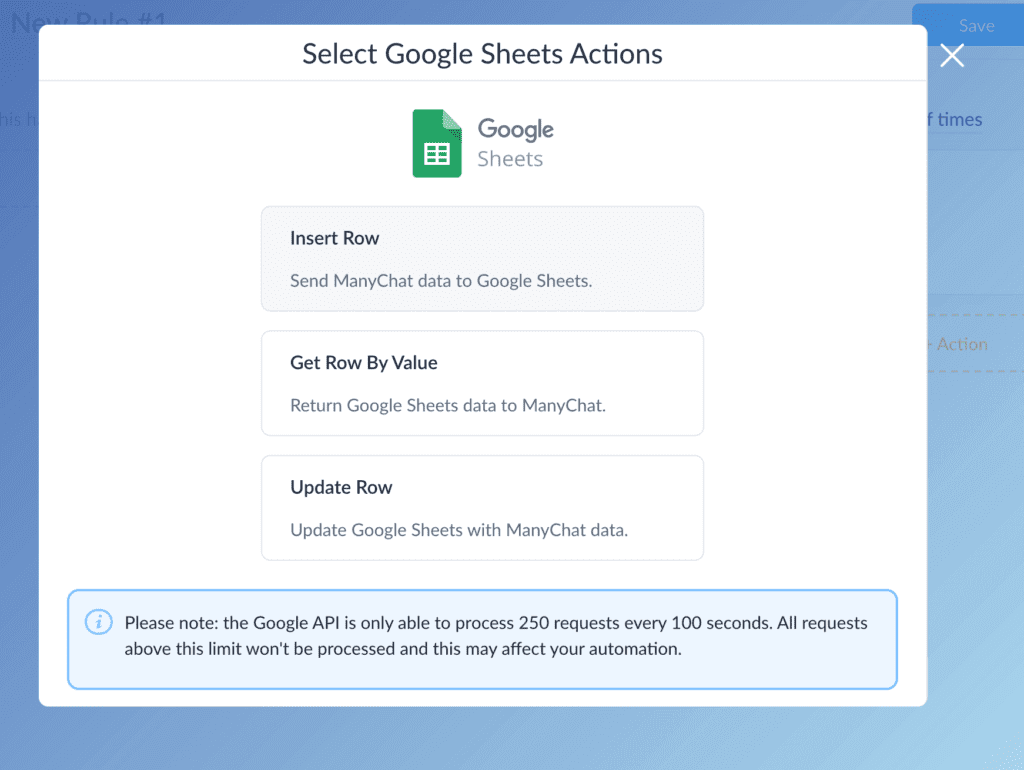
Now it is time to link to a Google Sheet. You can create yours or use our Google Sheets template.
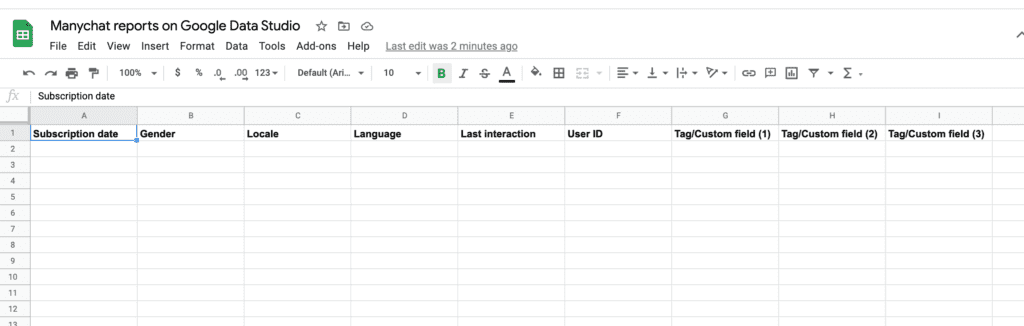
In this template you will find the most relevant default fields that Manychat brings from all subscribers.
Yet, you can add more columns to add other data like tags and custom fields (to bring emails or phone numbers, for instance).
Once linked, you should match the Manychat fields with the column titles of the Google Sheet.
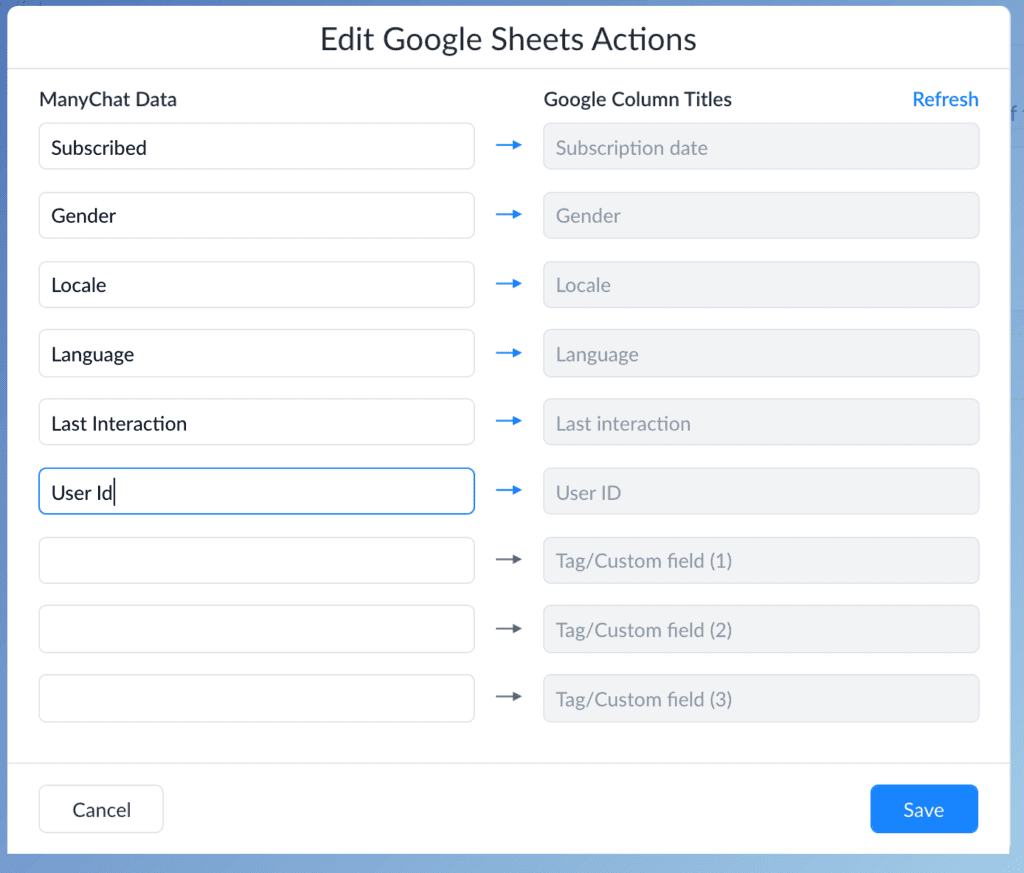
Your new rule should look like this. Remember to activate it.
Connecting Google Sheets to Google Data Studio
We already cover how to create Google Sheets reports on Google Data Studio in several tutorials
- how to use google data studio with google sheets: step-by-step tutorial
- Google Data Studio tutorial for 2021: automate your reports in 10 steps
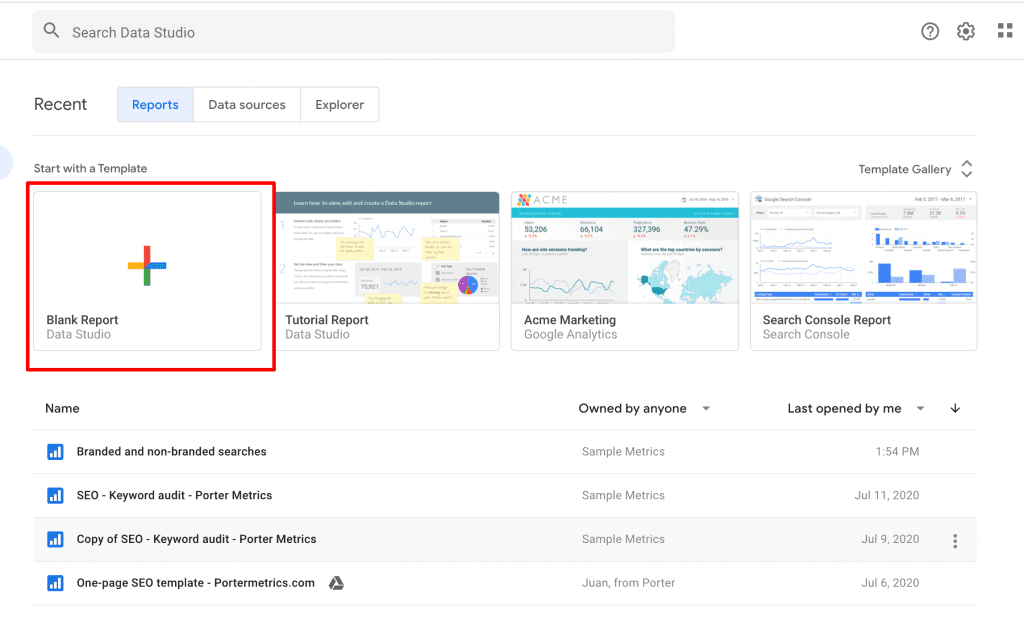
Go to Google Data Studio and create a new report.
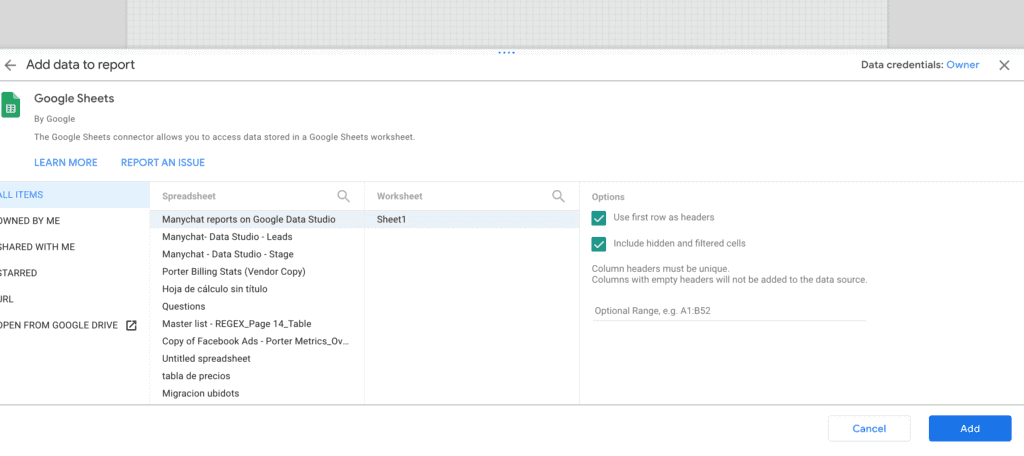
Choose Google Sheets as a data source.
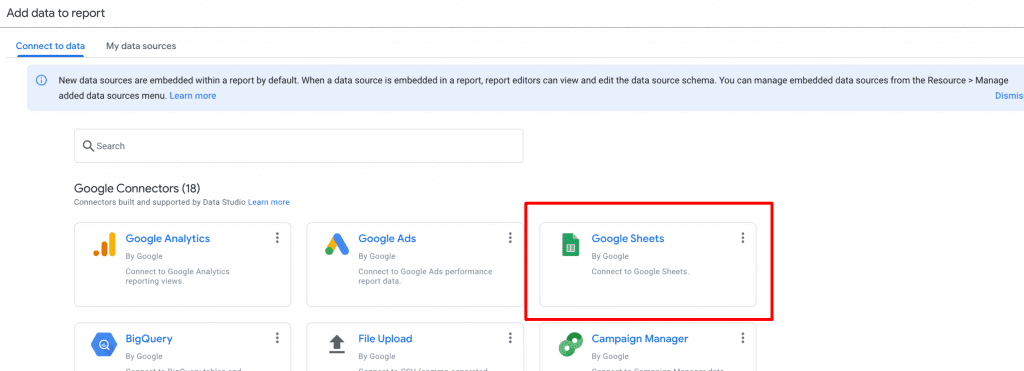
Link to the Google Sheet we just created to store Manychat data.
It’s time to create our dashboards!
Creating a Google Data Studio report
To create the report on Data Studio, we will follow two steps:
- making sure Google Data Studio “understands” the underlying data of the Google Sheets.
- Dragging and dropping charts and other elements.
Once on your blank report, go to Resource – Manage added data source, and click Edit on the Google Sheet we have just connected.
You will see all the fields that we can bring.
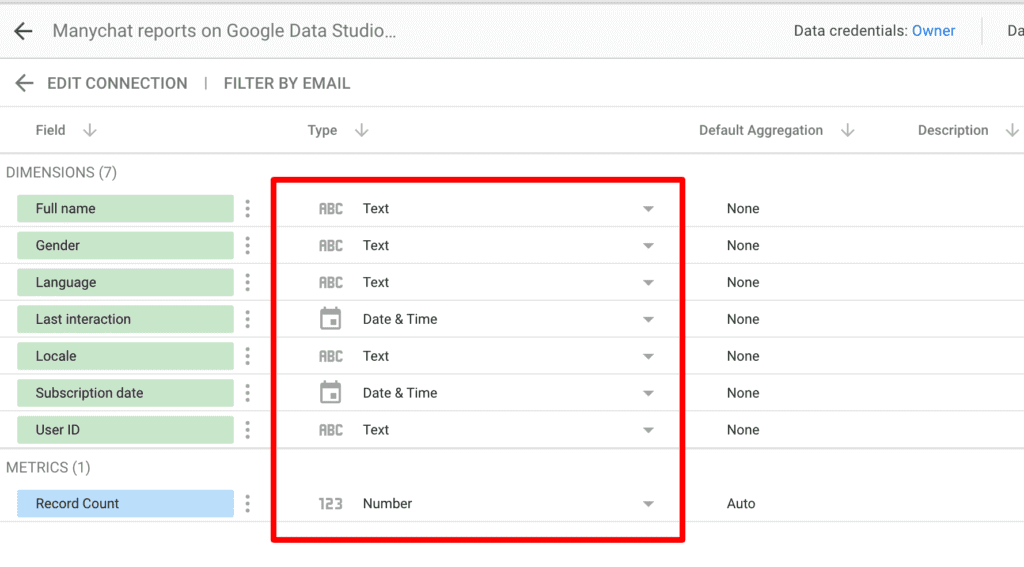
In the data type drop-downs, you can indicate Data Studio to choose the type of data that the field refers to.
In the case of dates, Google Data Studio identified them automatically.
But there are some data types like countries, cities, ZIP codes, numbers or links, that you would like to set as such, as Data Studio will likely identify them as strings (text).
Let’s go back to our blank report. I encourage you to watch this tutorial: How to create dashboards on Data Studio.
With Data Studio, you have the freedom to build dozens of visualizations in many ways. Actually, we share a free report template with you so you don’t need to do it.
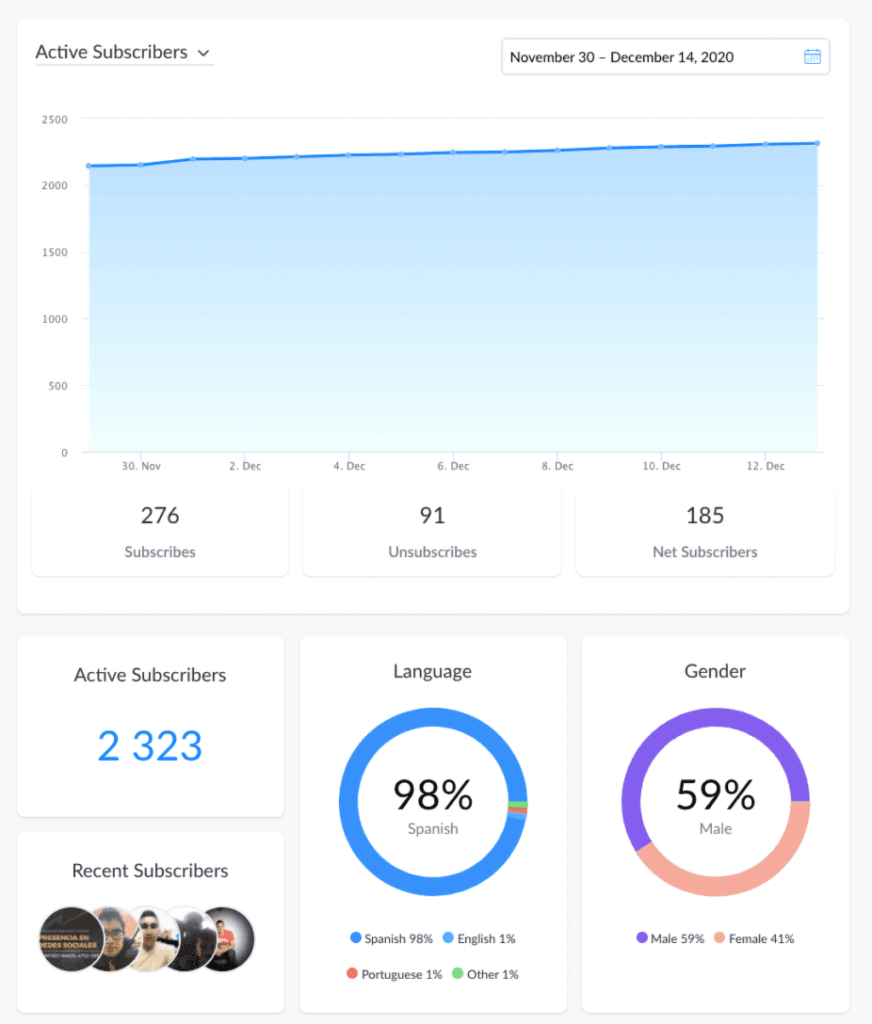
But for the sake of this tutorial, we will create 4 visualizations or charts:
- A time series showing new subscribers over time
- A pie chart to know our audience’s gender composition
- A bar chart to break down our audience by language
- A scorecard to show the total number of subscribers
- A table, to show subscribers’ names.
They work all the same.
- Go to Insert and add a chart type (time series, pie charts, etc.).
- Choose a dimension, which defines the way you break down the data (date, language, gender, etc.).
- Choose a metric that represents numerical values, just like currencies, percentages, etc.
This would be the setup for the time series, for instance:
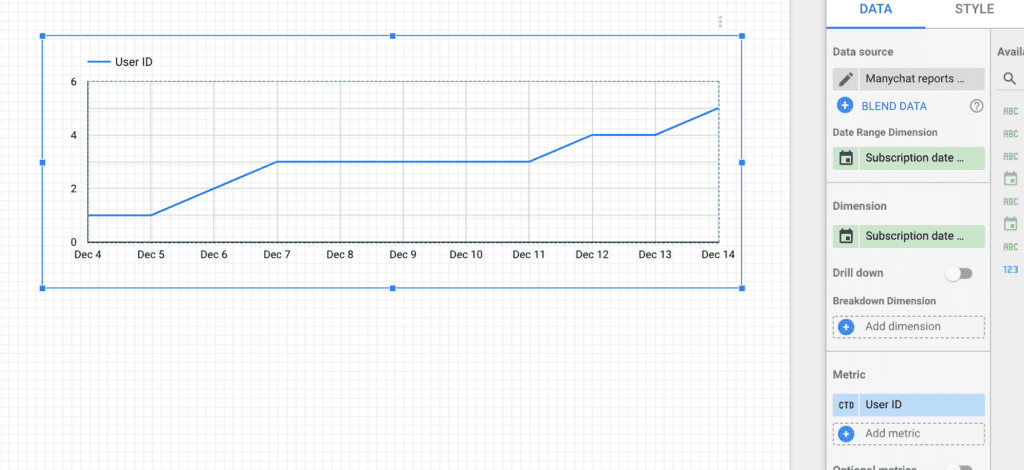
- Chart type: time series
- Date range dimension: Subscription date
- Metrics: User ID (Count Distinct)
User ID is not numerical (you don’t operate IDs mathematically).
Yet, they can become metric if we use an aggregation; we ask Data Studio the number of unique IDs in our Google Sheet.
To make the chart cumulative, go to the Style tab, and check Cumulative.
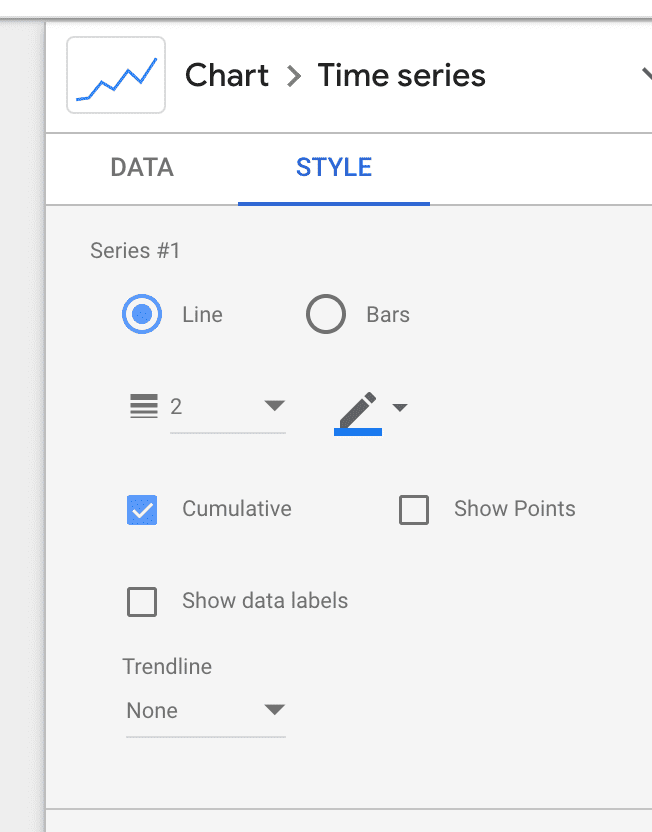
I encourage you to explore the design options so you can change colors, backgrounds, add reference lines, and more.
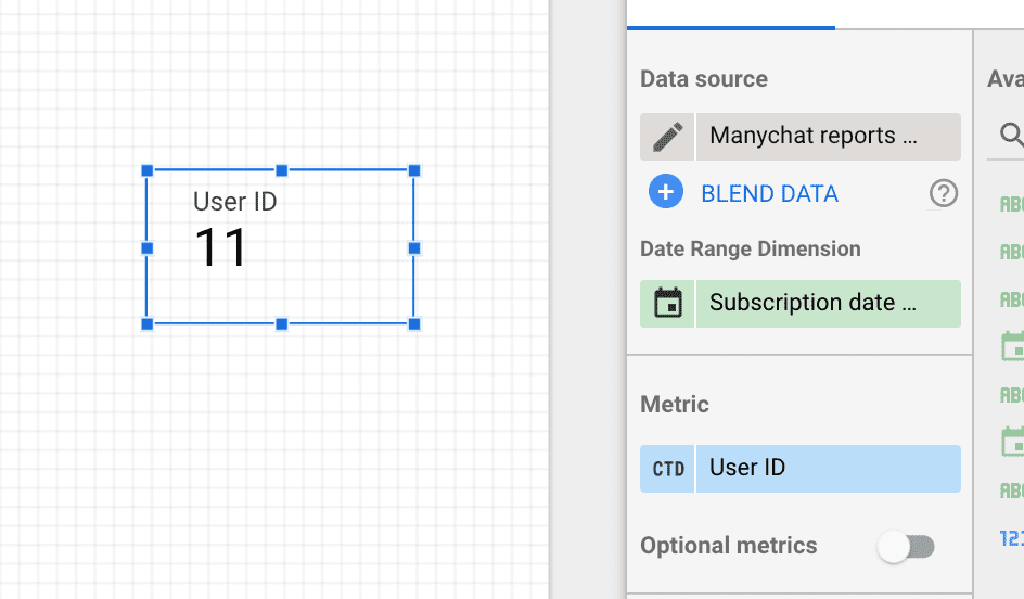
For the scorecard, we only need to set User ID (Count Distinct) as our metric and subscription date to set a date range dimension.
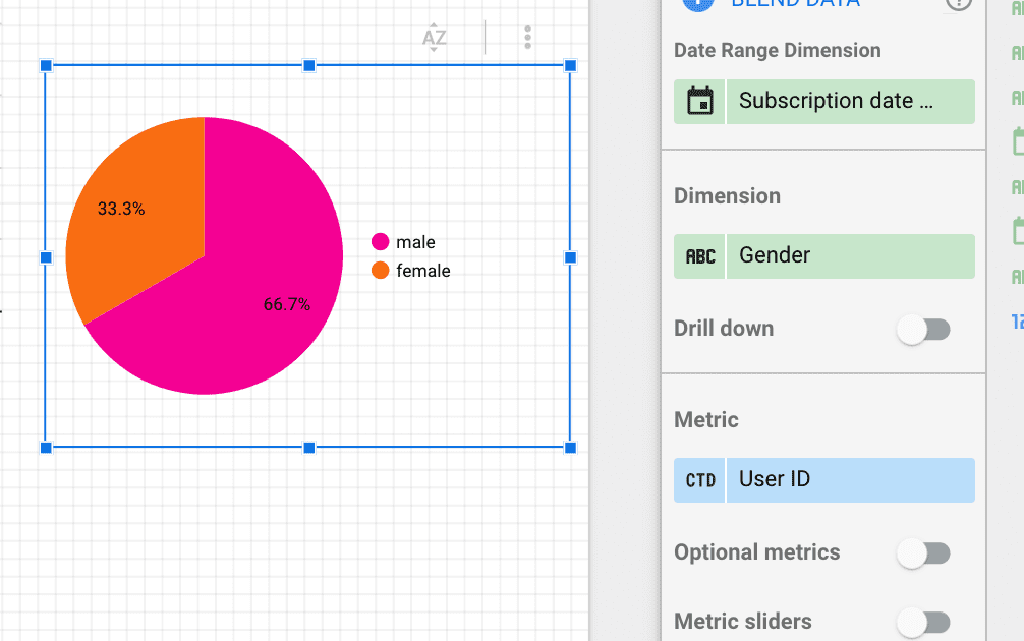
For the pie chart, use Gender as the dimension and User ID (Count Distinct) as the metric.
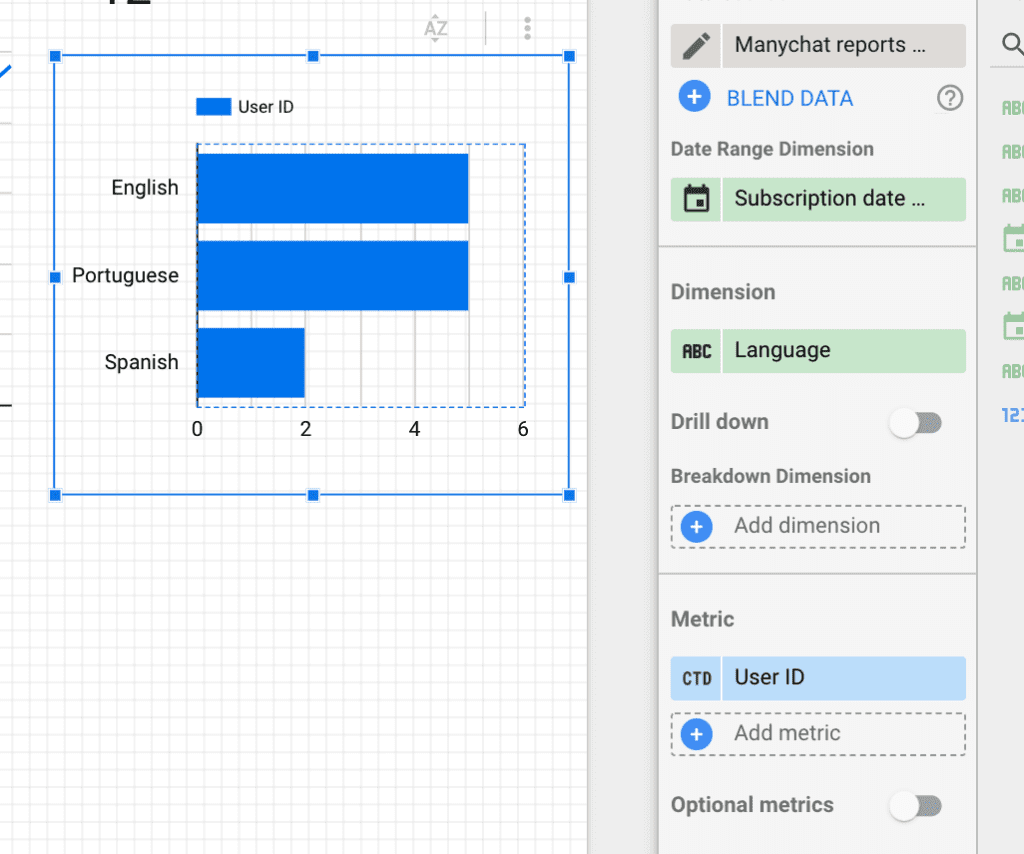
Do the same for the pie chart, but use Language instead of Gender as the dimension and User ID (Count Distinct) as the metric.
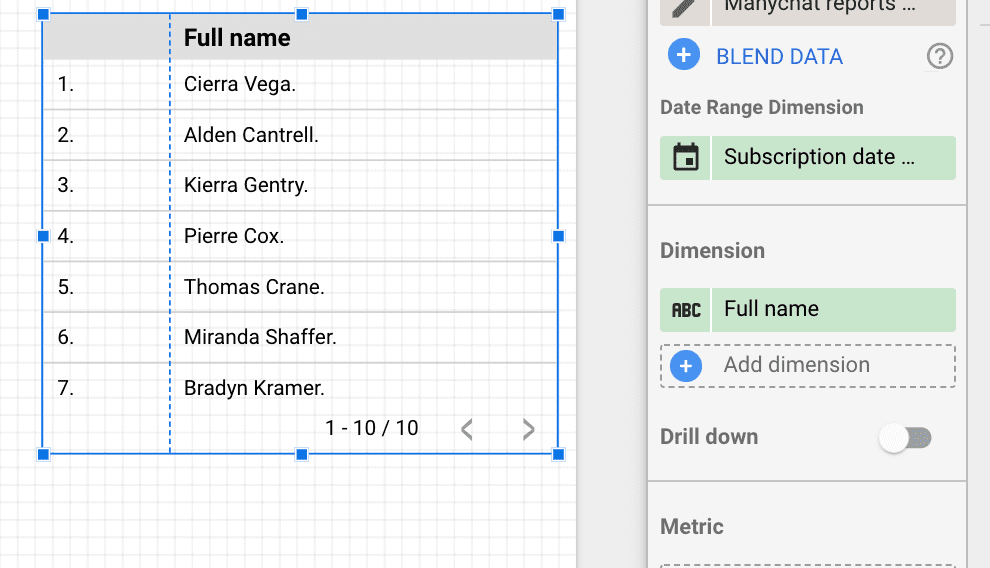
Finally, we’ll create a table by choosing Name as a dimension. Metrics are not mandatory in tables.
You have officially created a Manychat dashboard on Google Data Studio that will update automatically. It refreshes every 15 minutes with the data on Google Sheets.
If you want to add date range controls, filters, more charts, custom formulas, styling, and other options, I strongly encourage you to take a look at our resources:
Free Manychat report template on Data Studio
You can use our report template so you don’t build yours. You just need to connect the Google Sheet and make sure the fields match. You can customize it as much as you need.
Don’t stop automating reporting…
We thought you may want more of Data Studio love.