


Data analytics has become crucial to every organization’s strategy. The data you collect from various sources helps you gain insights into your customers, employees, and other stakeholders.
You can then use this data to improve customer service, develop new products, or identify potential threats. Supermetrics allows you to create reports easily and share them with your team or clients.
This means you don’t need to spend time creating complex charts and graphs. Instead, you can focus on analyzing your data and gaining actionable insights.
In this article, I’ll take you through an overview of Supermetrics and how to create a Data Studio (formerly Looker Studio) report with Supermetrics.
Supermetrics Overview
Supermetrics is about helping marketing predictive and prescriptive analytics teams use data to create better businesses.
This platform is one of the best business intelligence tools that assist you in getting the precise marketing data that makes a difference when and where you need it.
It also helps you make data-informed decisions to advance your business.
Over half a million people, including data analysts, marketers, and data engineers, use Supermetrics to move data from popular marketing platforms (such as Facebook, Google Ads, and HubSpot) to destinations like Google Sheets, Data Studio, Excel, BI tools, data warehouses, and data lakes.
How to Create a Data Studio Report Using Supermetrics?
Here, I’ll take you through the step-by-step process of creating a Data Studio report using Supermetrics:
1. Log in to Data Studio
The first step to creating a Data Studio report with Supermetrics is to go to the Data Studio site and ensure the account connected is the account you want to create a report with. If it isn’t, you can change it to your preferred Gmail or Gsuite account at the top right corner of your screen.
2. Create a report
Next, click + Create in the top left of your screen.
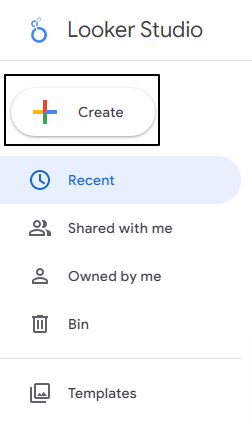
Then, click Report.
Now, you’ll be prompted to add a data source.

3. Add data sources
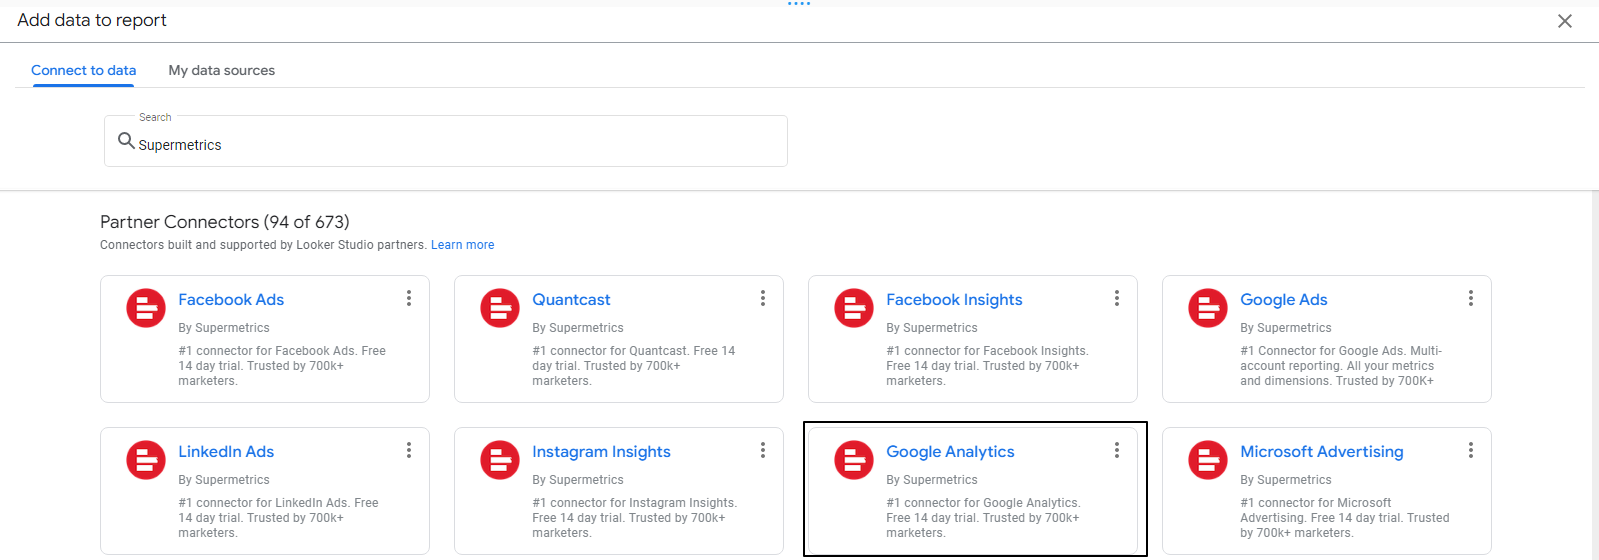
To add a data source using Supermetrics, input Supermetrics in the search field, then select the connector you would like to use.
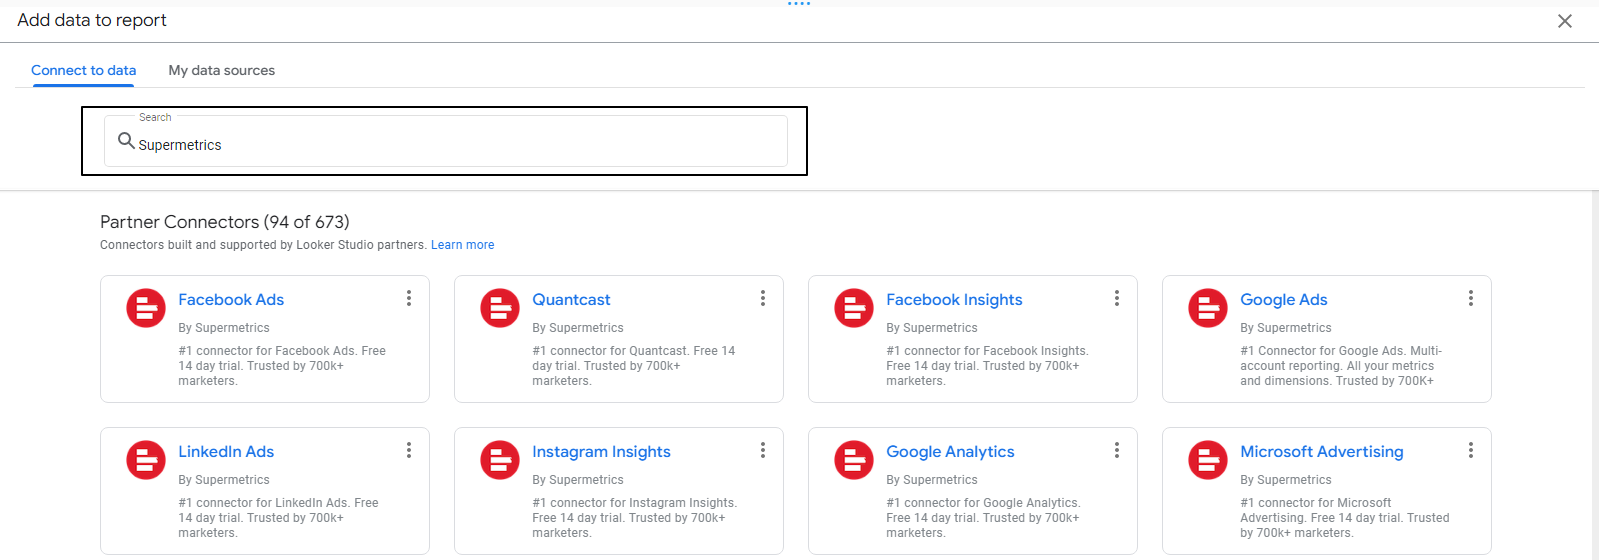
In this article, I’ll use the Google Analytics by Supermetrics connector to create a report. Here are the steps to connect your data source to Supermetrics:
Step 1: Select the connector.
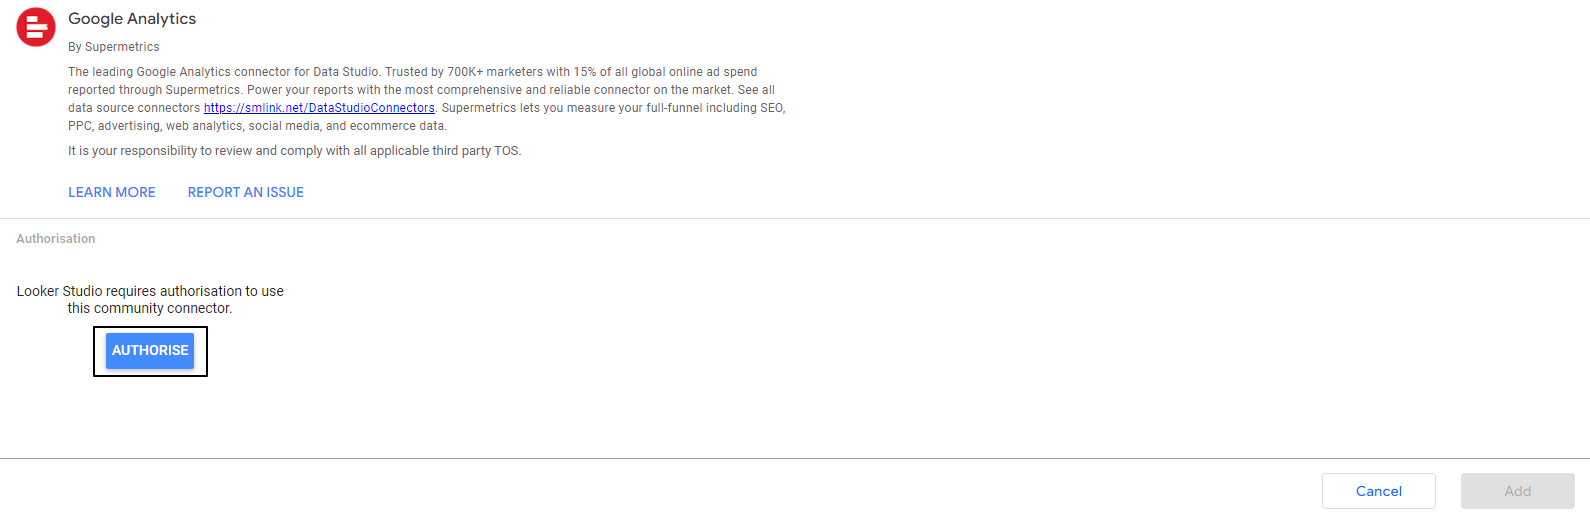
Step 2: Click AUTHORIZE to give Data Studio the authentication to use the community connector.
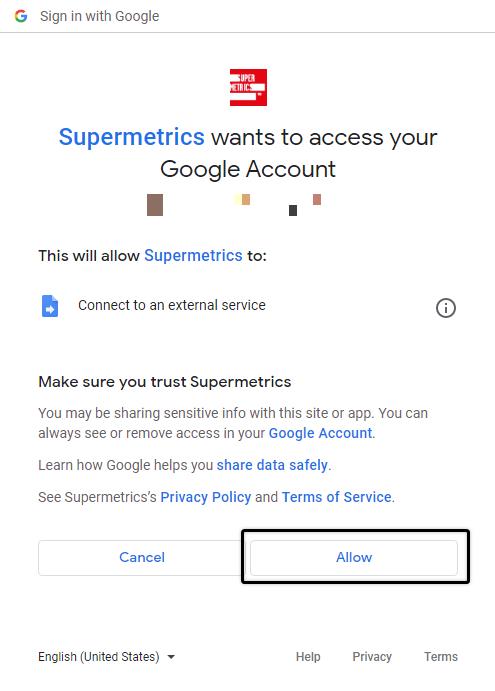
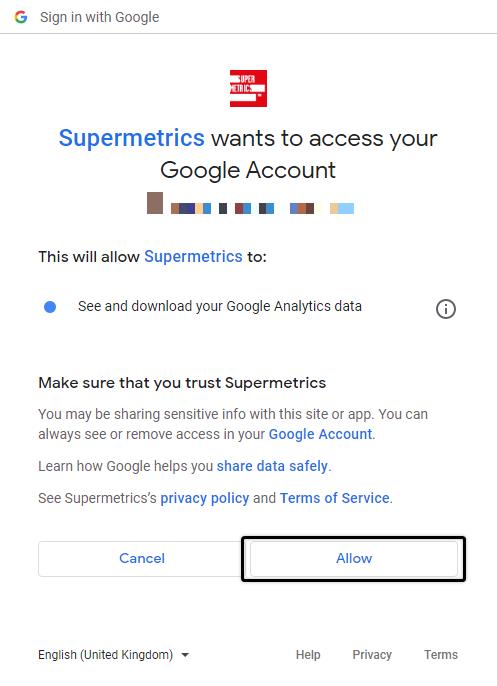
Step 3: Sign in to your Gmail/Gsuite account, then allow Supermetrics to access your account.

Step 4: Click AUTHORIZE to give Google Analytics authorization to connect to data.

Step 5: Select the account that has access to the Google Analytics account you want to connect to, then click Allow to grant Supermetrics access.
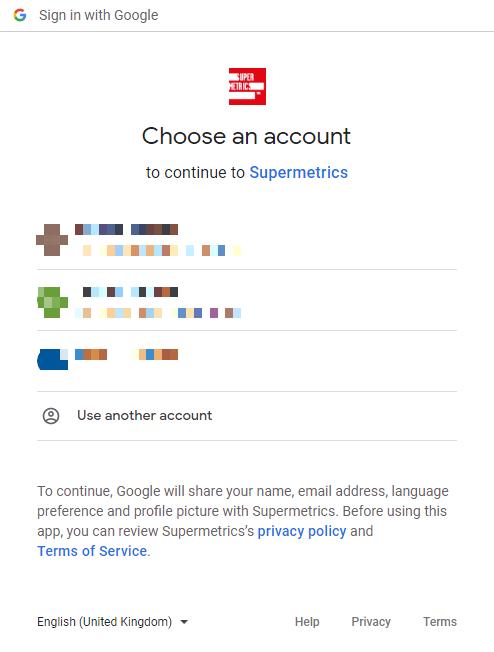
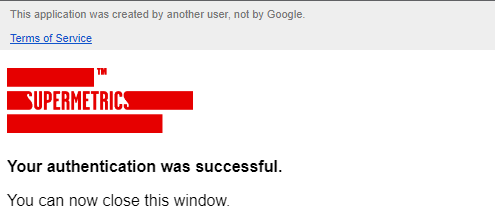
You’ll receive a confirmation if the account is authenticated and connected successfully.
Step 6: Now, set all the required parameters for the connection, then click Add.

Step 7: Confirm that you’re adding your Google Analytics data to Data Studio by clicking ADD TO REPORT.

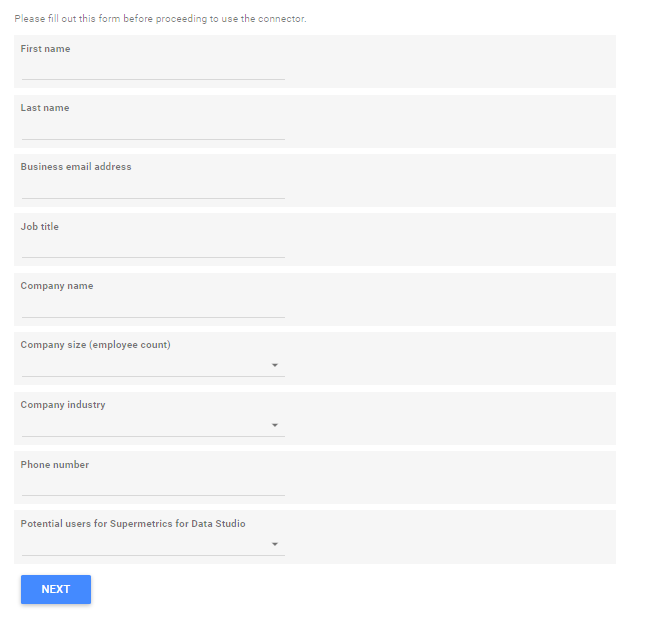
You might also be required to fill out a form with your name, business email, job title, company name, company size (employee count), company industry, phone number, and potential users for Supermetrics for Data Studio.
Cheers. Now, you’ve connected your data source to Data Studio using Supermetrics.
However, I recommend using Google’s Google Analytics connector to connect your Google Analytics account, as the metrics and dimensions will be less distorted, and reporting will be smoother.
4. Add charts
You can add multiple charts to your report based on what you’re trying to communicate. You can start with the Supermetrics template and edit it to meet your preference.

5. Add filters
You might want to clean a time series of new users only to display new users from Google (Organic). The following are the steps on how to Add filters to a Supermetrics chart:
Step 1: Click on the chart you would like to clean. Then, go to the Chart (Setup) section by the right of your screen, scroll down to the Filter part and click +ADD A FILTER.
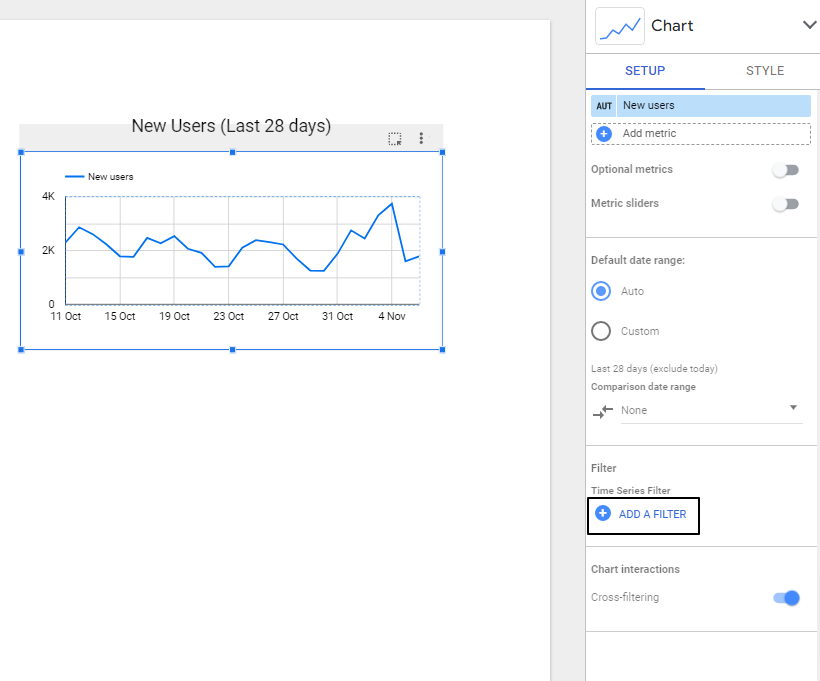
Step 2: If you haven’t created any filter before, a popup will be displayed, prompting you to fill in the name you want to assign to the filter and specify what it does.
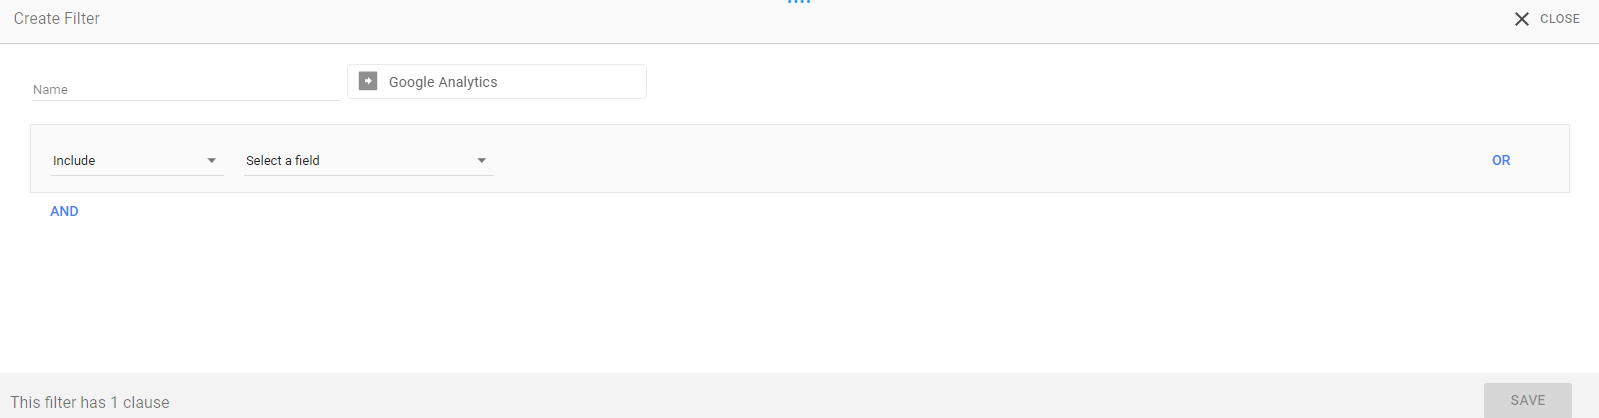
Since we’re trying to filter new users that came from Google, I’ll name this filter Google New Users and then specify the condition to Include the Source field Equal to (=) google.

Step 3: Click SAVE to save the filter and apply it to the chart
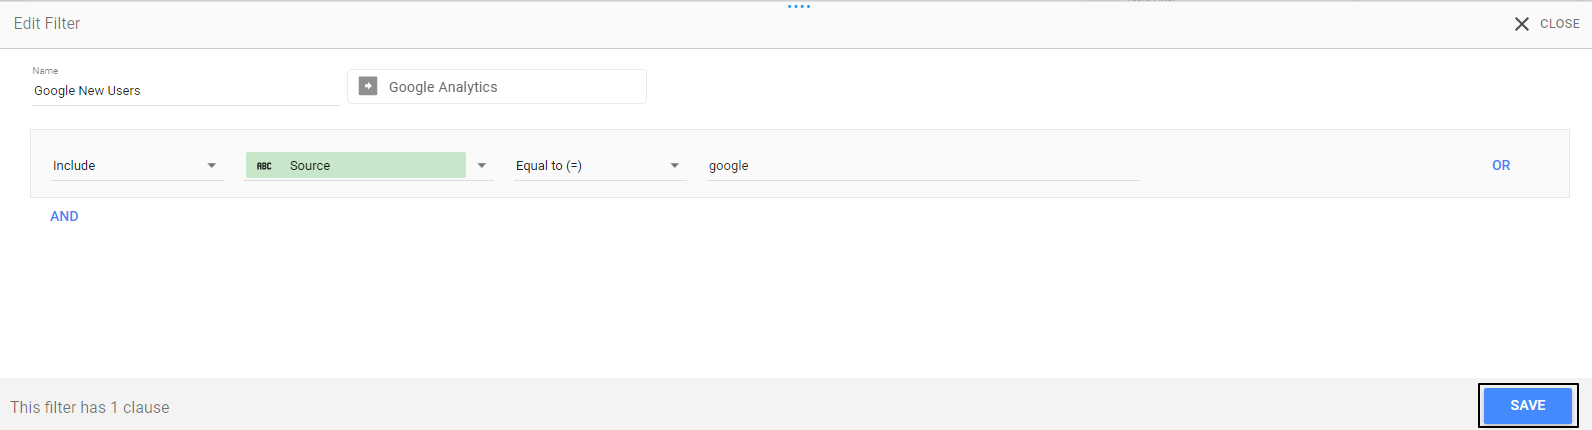
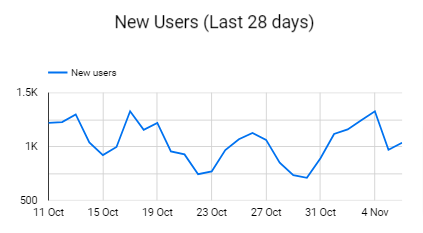
Now, the chart displays only new users from Google.
This method applies to anything you want to filter by. You just have to break it down and implement each step. You can also add multiple clauses to your filter depending on what you want to achieve.
Check out a tutorial we compiled on How To Create Filters On Google Data Studio and Regular expressions (RegEX) for Data Studio to learn more about Filters and how to use regular expressions to filter data effectively.
6. Share your report

There are various ways to share your report. These include:
- Inviting people to view or edit
- Scheduling email delivery to email(s) at a particular time and interval
- Getting report link to share
- Enabling embedding to copy Embed code or URL
- Downloading report as PDF
Check out a helpful guide on How To Share Google Data Studio Reports With Clients to understand all sharing options better.
Supermetrics Pricing and Plans

Supermetrics has five plans for its Data Studio connector ranging from a €39/mo plan to a custom pricing plan. The following are the pricing and plans Supermetrics offers for its Data Studio connector:
1. Single connector
Pricing: €39 per month, billed annually
With this plan, you can use only one data source, accommodating one user. However, you can include ten accounts per data source.
2. Essential
Pricing: €99 per month, billed annually
The essential plan offers you everything you need to get started. You can connect 9 data sources, the plan accommodates one user, and you can include ten accounts per data source. You can also add one more data source at €29/month.
3. Core (Most popular package)
Pricing: €199 per month, billed annually
This pricing plan offers you comprehensive coverage and allows you to connect up to 24 data sources. You can include ten accounts per data source, but the plan only supports one user. You can add up to 2 more data sources at €29/month/source.
4. Super
Pricing: €499 per month, billed annually
This plan is suited for more complex data needs. The Super plan allows you to connect up to 59 data sources and supports three users, ten accounts per data source, and custom fields.
5. Enterprise
Pricing: Custom Pricing (Request for quote)
This plan grants you access to all available data sources, including premium ones. The Enterprise plan supports more than three users, more than ten accounts per data source, and custom fields.
You also get a domain-wide license, data warehouse destinations, premium support, and a dedicated customer success manager.
Supermetrics Features and Benefits
With Supermetrics, you can aggregate siloed data from sales and marketing platforms, such as Google Analytics, Facebook Ads, and Instagram, into your go-to reporting, analytics, and storage platform — whether that’s a BI tool, a spreadsheet, a data visualization tool, a data lake, or a data warehouse.
Supermetrics is well-known for its fantastic platform, and some of the features and benefits of using Supermetrics include the following:
- API
- Alerts/Notifications
- Auto Extraction
- Automated Scheduling
- Campaign Analytics
- Campaign Tracking
- Conversion Tracking
- Customizable Dashboard
- Customizable Reports
- Customizable Templates
- Dashboard
- Dashboard Creation
- Data Connectors
- Data Extraction
- Data Import/Export
- Data Integration
- Data Source Connectors
- Data Transformation
- Data Visualization
- ETL – Extract / Transfer / Load
- Engagement Tracking
- Functions/Calculations
- Integrations Management
- KPI Monitoring
- Keyword Tracking
- Marketing Reports
- Monitoring
- Multi-Campaign
- Multi-Channel Data Collection
- Multiple Data Sources
- Performance Metrics
- ROI Tracking
- Reporting/Analytics
- Sales Reports
- Scheduled / Automated Reports
- Social Media Integration
- Summary Reports
- Third-Party Integrations
- Trend Analysis
- Web Data Extraction
- Website Analytics
Supermetrics Connectors
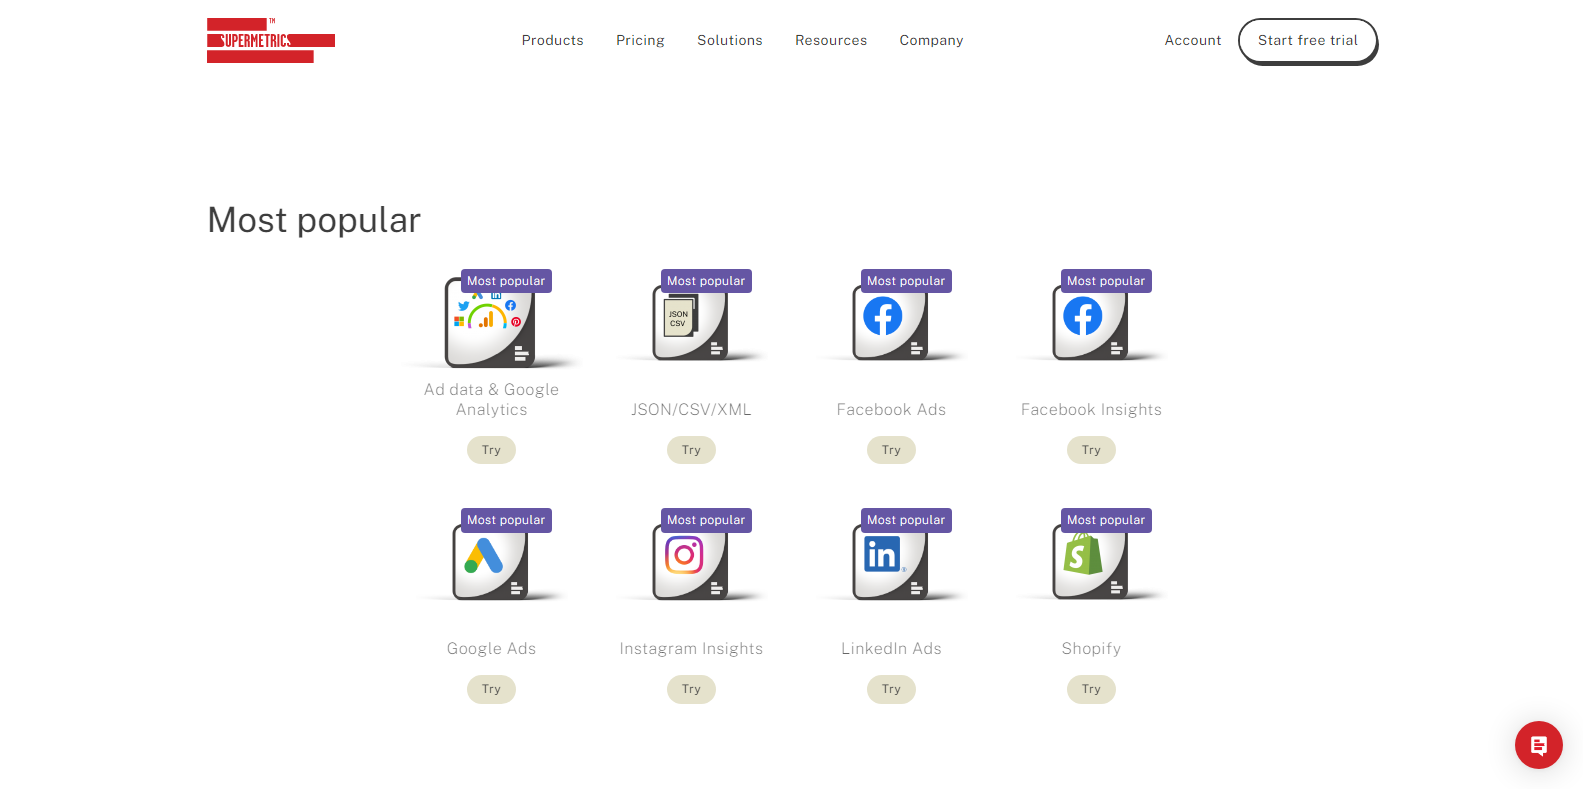
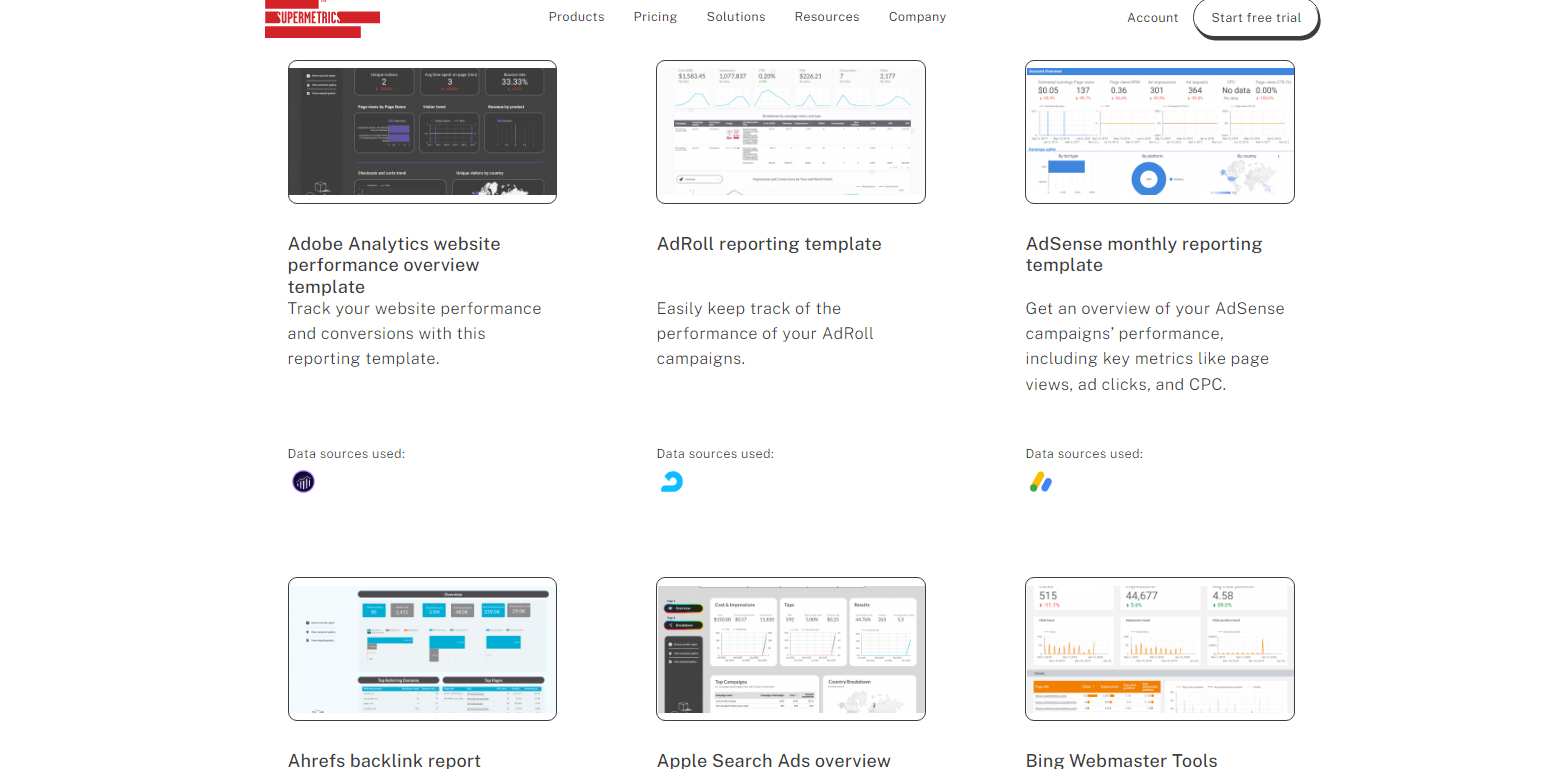
Supermetrics has more than 90 Data Studio connectors. All connectors come with a 14-day free trial. All you need for the free trial is to be logged in to a Google account. The following are the Data Studio connectors Supermetrics has:
- ActiveCampaign
- Ad data & Google Analytics
- Adform
- Adjust
- Adobe Analytics
- AdRoll
- Adtraction
- Affluent
- Ahrefs
- Apple Public Data
- Apple Search Ads
- Appsflyer
- Piano Analytics (AT Internet)
- AWIN
- Azure Synapse
- Bambuser
- Bing Webmaster Tools
- CallRail
- Campaign Monitor
- Capterra PPC
- Capterra Reviews
- Clockify
- Criteo
- JSON/CSV/XML
- Facebook Ads
- Facebook Audience Network
- Facebook Billing Data
- Facebook Insights
- Facebook Political Ads
- Facebook Public Data
- Google Ad Manager
- Google Ads
- Google AdSense
- Google Analytics
- Google Analytics 4
- Google BigQuery
- Google Campaign Manager 360
- Google Display & Video 360
- Google My Business
- Google Play Reviews
- Google Search Ads 360
- Google Search Console
- Google Trends
- Harvest
- HubSpot (<100k contacts)
- HubSpot (>100k contacts)
- Indeed Reviews
- Instagram Insights
- Instagram Public Data
- Klaviyo
- LinkedIn Ads
- LinkedIn Company Pages
- LiveIntent
- Mailchimp
- Microsoft Advertising
- Supermetrics Moz connector logo
- Newsletter2Go
- Omnisend
- Optimizely
- Outbrain Amplify
- Pardot
- Partnerize
- Pinterest Ads
- Pinterest Organic
- Pinterest Public Data
- Piwik PRO[early access]
- Quantcast
- Quora Ads
- Rakuten Advertising
- Readpeak
- Reddit Public Data
- Salesforce
- Salesforce Marketing Cloud
- Searchmetrics
- Semrush Analytics
- Semrush Projects
- Sendinblue
- Shopify
- Simplesat
- Slack
- Smarp
- Snapchat Marketing
- Snowflake
- Spotify Ads
- Sprout Social
- StackAdapt
- Stripe
- Taboola
- The Trade Desk
- TikTok Ads
- Tripadvisor Reviews
- Tumblr Public Data
- Twitter Ads
- Twitter Premium
- Twitter Public Data
- Vimeo Public Data
- VKontakte Public Data
- Yahoo DSP
- Yahoo! Japan Search Ads
- Yahoo Native Ads
- Yandex.Direct
- Yandex.Metrica
- Yelp Reviews
- Yext
- YouTube
Supermetrics Recommended for
Supermetrics is recommended for any marketer or analyst interested in gathering marketing data from different platforms into one location, such as Data Studio and Sheets.
It saves you hours from manually going into each marketing platform (e.g., Google / Facebook) to get the relevant data.
The platform can help you pull data from over 90 tools into your preferred reporting tools like Data Studio, Google Sheets, or Excel.
Supermetrics Support & Documentation
If you have any inquiries or issues with their product(s), you can contact them via live chat and contact page to get the required answers and solutions. Supermetrics also has a documentation page to assist beginners in getting started with the products.
Supermetrics Pros & Cons
Every tool has its upsides and downsides. In this section of the article, I’ll highlight some of the pros and cons of using Supermetrics:
Pros
- Supermetrics works fast and efficiently and gives an accurate measurement report.
- It also has extensive metrics and dimensions to choose from.
- The platform is easy to use, has high uptime, and has excellent customer service.
- Supermetrics pairs well with Excel or Google Sheets to customize the reports to suit your requirements.
Cons
- Supermetrics is more expensive than other tools.
- Even though it’s easy to start, SuperMetrics are sometimes too confusing, making it impossible to understand and taking time to learn.
- Errors are difficult to troubleshoot and fix from the user side.
- Supermetrics doesn’t offer all fields, and the fields offered don’t always correlate with fields in the original platform.
Supermetrics Ratings & Reviews
Ratings and reviews are also critical when selecting a platform to assist you with your data analytics and reporting tasks.
The following are some of the ratings and reviews Supermetrics has gotten from various review platforms:
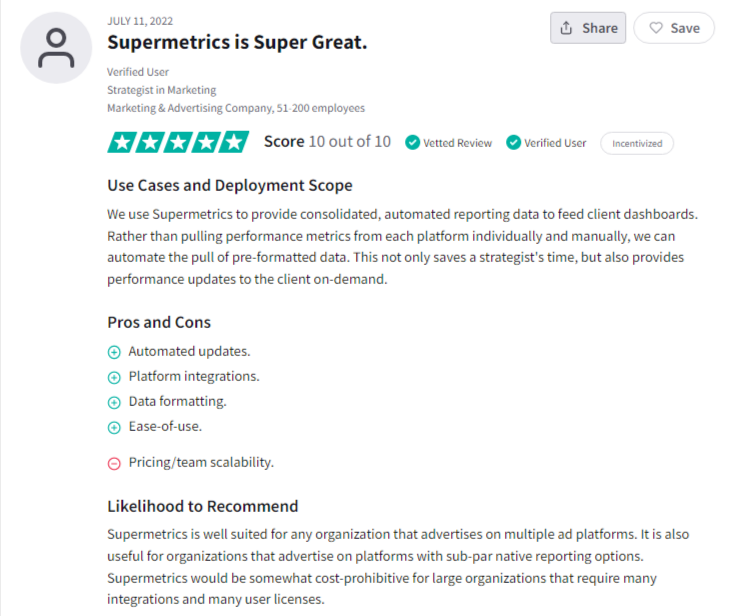
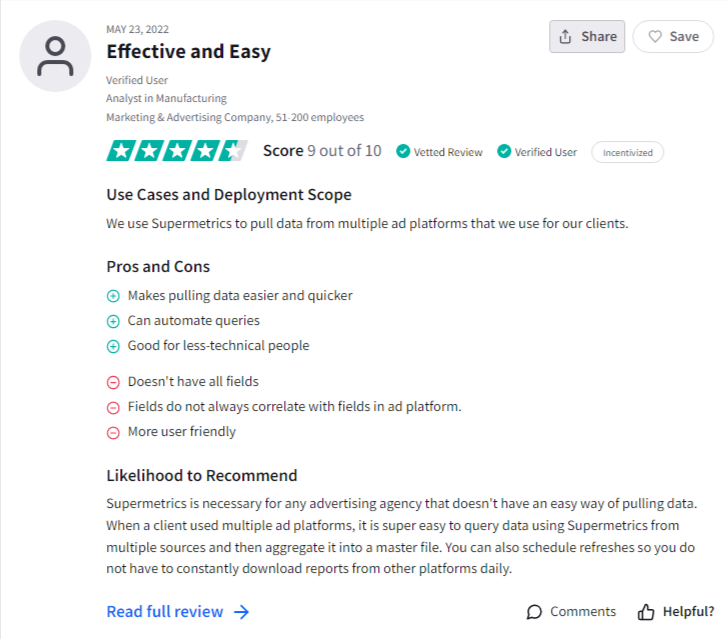
Trustradius
Supermetrics has got a rating of 8.9 out of 10 from 22 reviews on Trustradius. The following are some of them:
GetApp
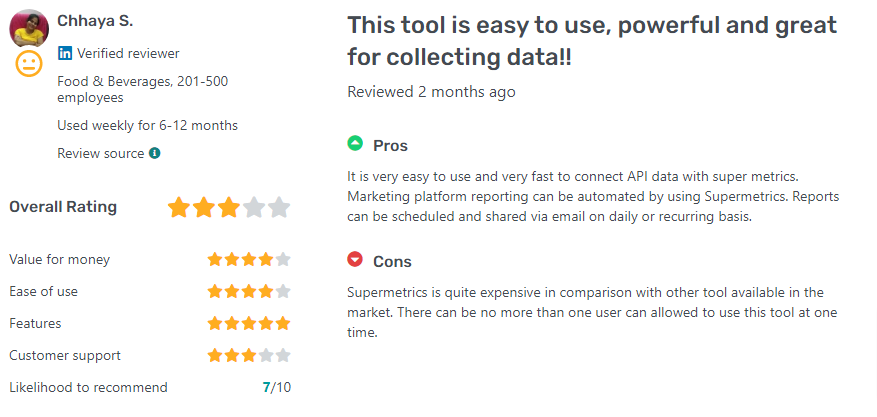
Supermetrics has an excellent review of 4.3 out of 5 from 85 reviews on GetApp. Here are some of the reviews:
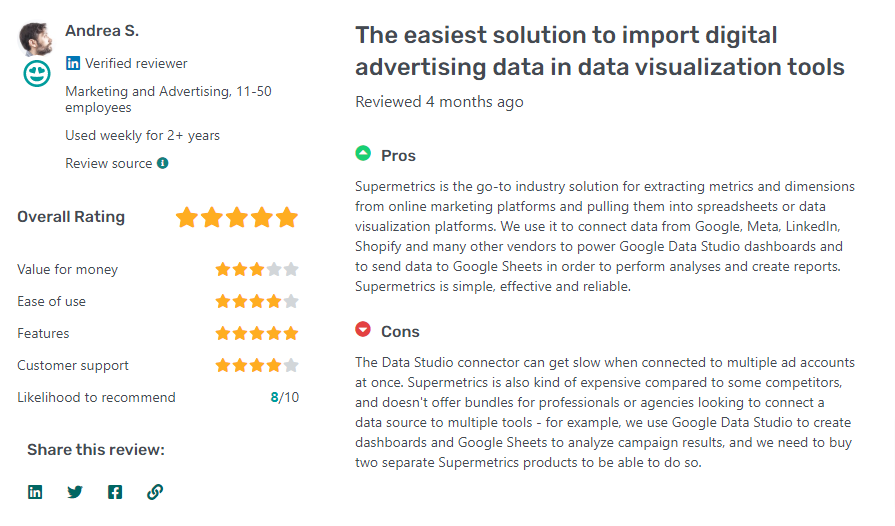
G2
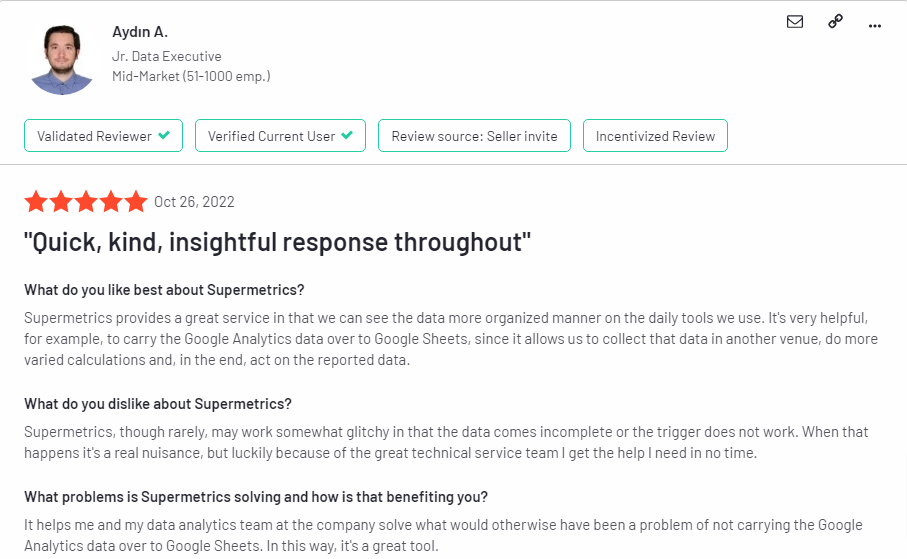
Supermetrics has another excellent rating of 4.4 out of 5 stars from 467 reviews on G2. Below are some insightful reviews:

Conclusion
There you have it, an overview of Supermetrics and how to create a Data Studio report with Supermetrics.
Before you create a Data Studio report with Supermetrics, you should check out Porter Metrics. Porter offers similar reporting services and Data Studio connectors to help you analyze all your marketing data in one place.
Our free template gallery and free report setup are some of the upsides of using the Porter Metrics Data Studio connectors. You can schedule a one-on-one call with us to assist you with whatever you need to get started.
Once you’ve created a report with Porter Metrics, your decision on your preferred platform will be much easier.