


How to add charts and graphs to Looker Studio
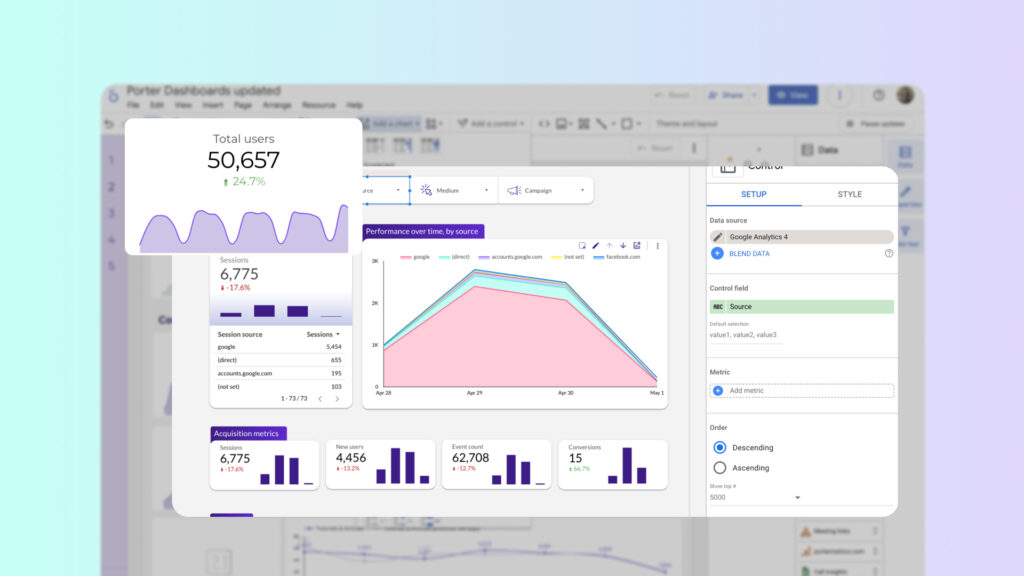
To create a good report you have to understand how to create and edit charts on Looker Studio. If you want better reports, you have to understand: Combining these two ideas will help you create engaging, useful reports. I will cover the step-by-step process of creating charts, the different types, customization options, and interactive filters- […]
How to copy a Looker Studio Report Template
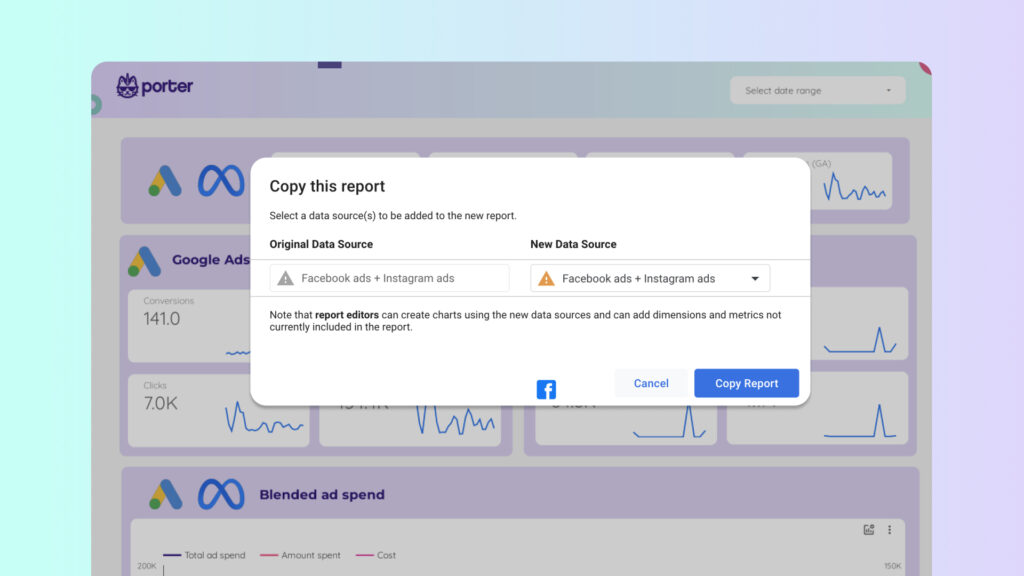
Learn how to copy any Looker Studio template with this complete step-by-step guide. We made a ‘how to video’ in case you prefer to see how we do it! Now, here’s the step-by-step guide. 1. Choose a Looker Studio Template Go to the main menu in Porter Metrics and open the Template Gallery Browse through […]
Facebook Ads and Google Ads Presentation Report
This is the ultimate digital marketing report in Google Looker Studio. Bring all of your marketing data into one place and make decisions faster.
How to Resolve Slow Reports on Data Studio Using Extract Connector
We all know how frustrating it can be whenever Data Studio starts freezing or slowing down our reports. This tutorial discusses how you can resolve slow reports and dashboards on Data Studio using Extract Connector. Why are slow dashboards an issue? The more people use a dashboard, the slower overall performance may become. And the […]
How to Create a Pivot Table in Google Data Studio
Pivot tables allow you to view your data in multiple dimensions simultaneously, making them ideal for summarizing trends and answering business questions! This guide will show you how to make pivot tables in Google Data Studio and the benefits, drawbacks, and unique features they provide. So let’s get started! What Are Pivot Tables? Pivot tables […]
How To Group Data on Google Data Studio

Grouping data is an excellent tool in Google Data Studio. What are the primary benefits of grouping data? First and foremost, it generates valuable new insights (a few examples will follow below). Second, it can provide you with cleaner data. Consider the Facebook data in Google Analytics. The following sources can be found in the […]
How to Set up Google Analytics Tracking for Data Studio
Do you spend numerous hours preparing reports and dashboards to wonder if anyone reads them? Not knowing which reports are used versus which ones are not would be good, right? It’s no secret right now that you can create and share reports with your coworkers or clients using Google Data Studio. This helps to drive […]
How to Embed Data Studio Report on WordPress
Do you want to incorporate Google Data Studio reports into your WordPress site? Because Google is a tech behemoth, it should come as no surprise that WordPress provides numerous options for integrating with various Google products and services. You could install Google Tag Manager on your website, or embed Google Data Studio reports. This guide […]
How to Create Charts on Data Studio
We all know that visualizing data can make it easier to understand, share, and explore. But creating the right chart for the right scenario isn’t always easy. You might not know what visual representation is most effective when working with your data. And if you don’t have a design background, it can feel like an […]
How To Create A Date Filter In Data Studio
If you regularly work with marketing data, chances are you’ve had to filter a chart based on a date range at some point. Date filters allow you to focus on a specific period in your data, which can be helpful when you are trying to track trends over time or compare data from different periods. […]