


If you regularly work with marketing data, chances are you’ve had to filter a chart based on a date range at some point.
Date filters allow you to focus on a specific period in your data, which can be helpful when you are trying to track trends over time or compare data from different periods.
In this article, I’ll highlight everything you need to know on how to create a data filter in Data Studio (formerly Looker Studio). This will include the following:
- Using Date Filters in Google Data Studio
- How to add standard date filters to your Data Studio report
- Advanced date selection
- Comparing metrics for advanced date ranges
- How to create a filter for a select group of reports within Data Studio.
Using Date Filters in Google Data Studio
Date filters allow you to customize all kinds of date ranges and timeframes for your data reports. Using the Advanced Date Filters feature, you can enter rolling dates into any of your dashboards on Data Studio.
For instance, you can create a data visualization based on the data from the last two weeks without editing your daily date range.
How To Add Standard Date Filters to Your Data Studio Report
If you’re using Data Studio to create reports, you know how important it is to be able to filter your data. Standard date filters are a great way to do this and are easy to add to your reports.
In this section of the post, I’ll show you how to add standard date filters to your Data Studio report.
Rolling Time Frame with Static Dates
The following are the steps to add a rolling time frame with static dates:
Step 1: Open the report that you would like to give a rolling timeframe on the Data Studio site. If you don’t have a report, you should follow these steps to create one.
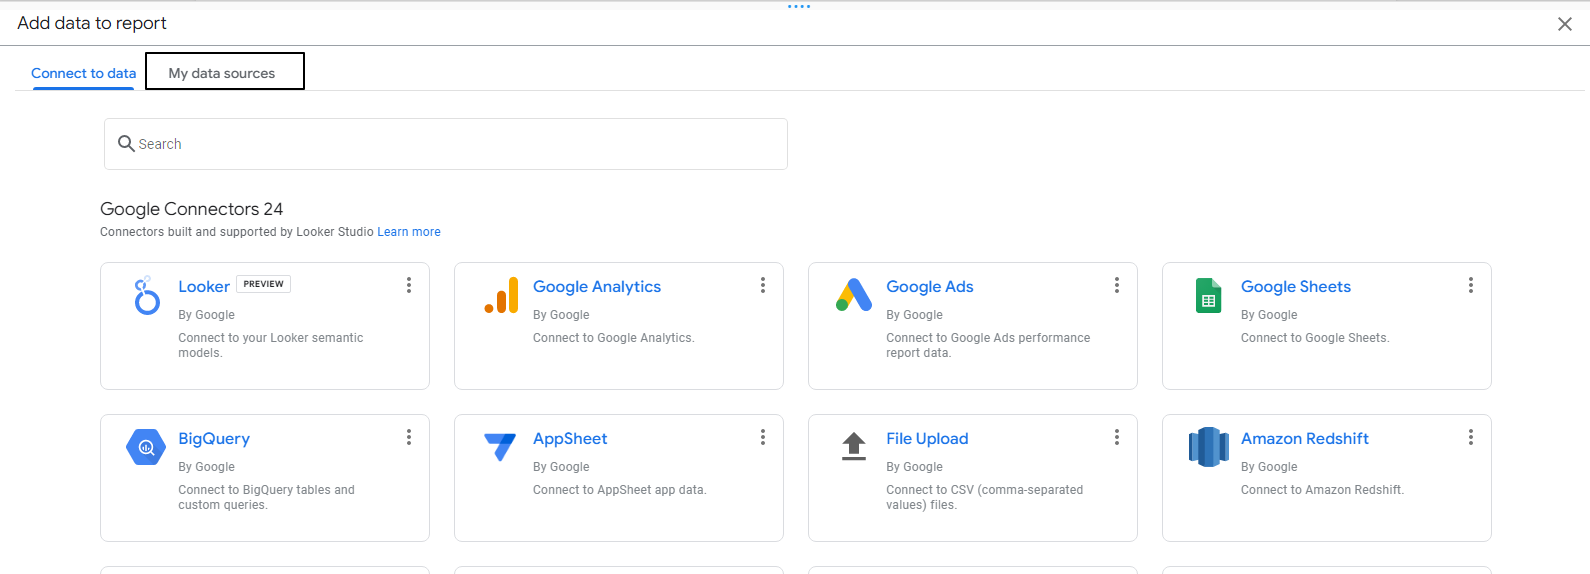
- Click the Blank Report box.
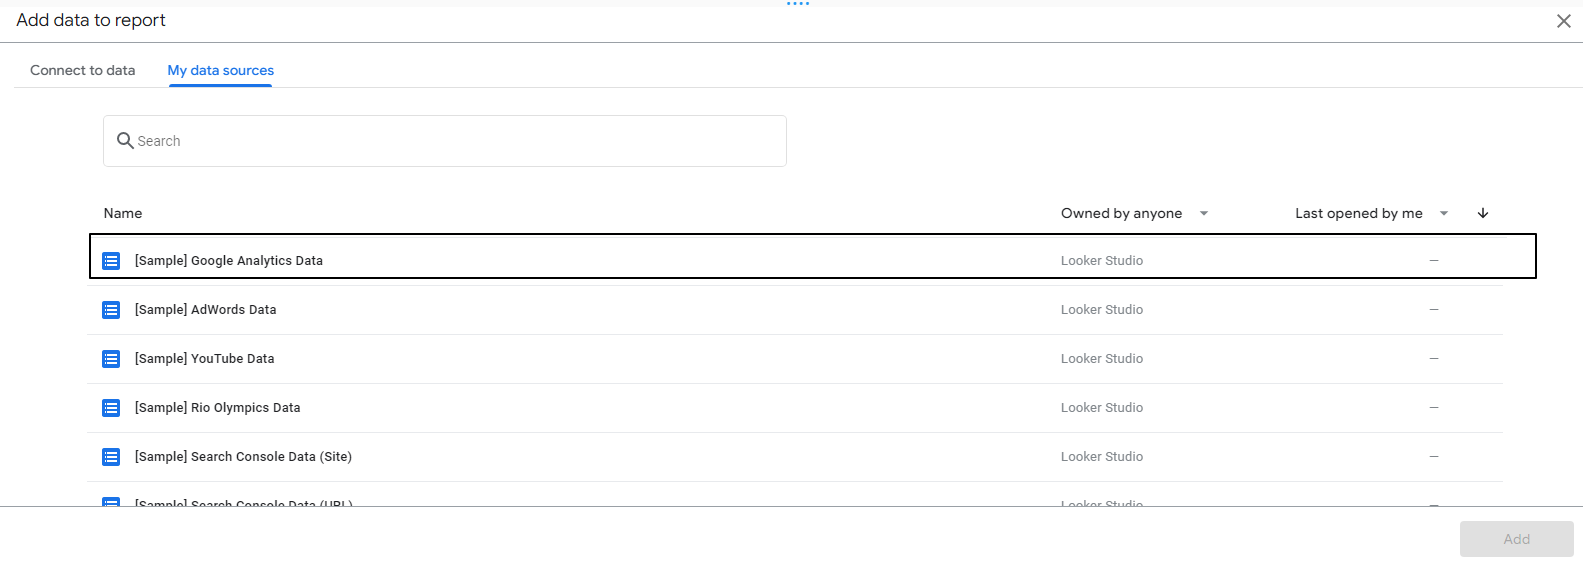
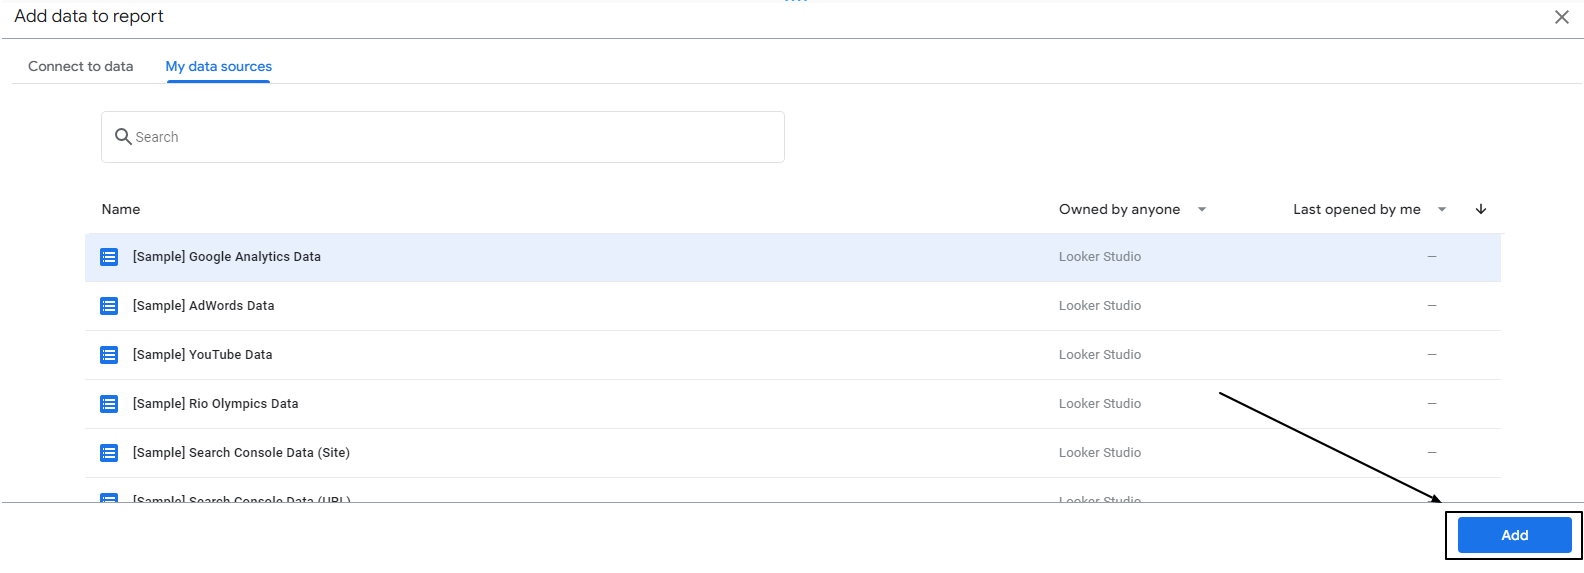
- Connect a data source. I’ll use the sample Google Analytics data source for this tutorial in the My data sources section.
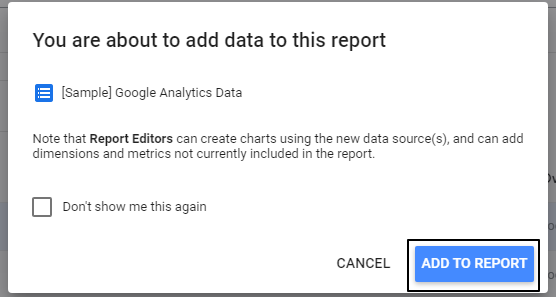
- Confirm that you want to add the data source by clicking ADD TO REPORT.
- The new report is now set. You can change the name of the report to a better-suited name.


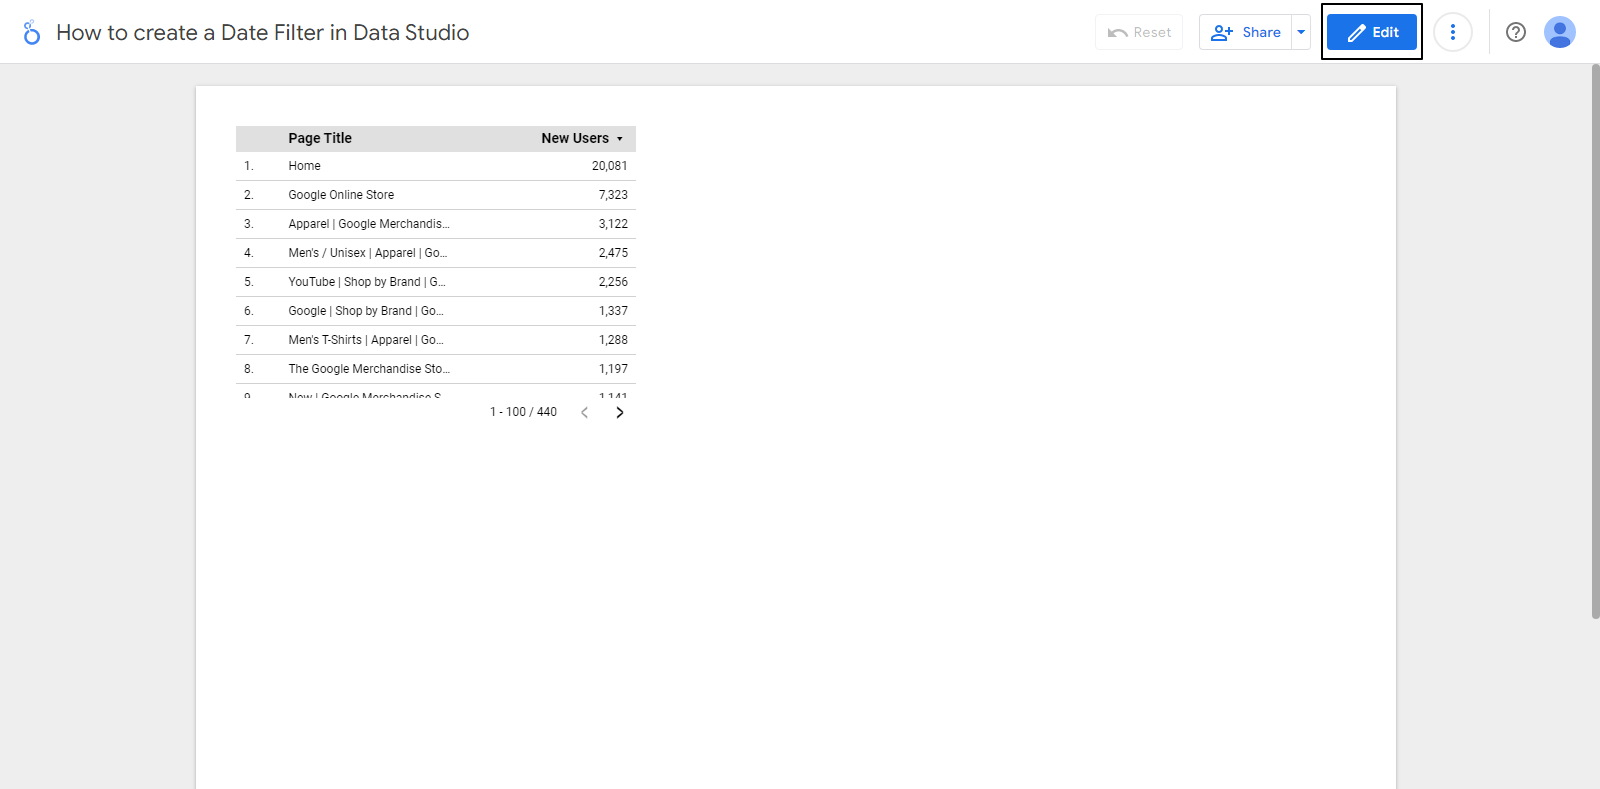
Step 2: If you already have a report, click on Edit.
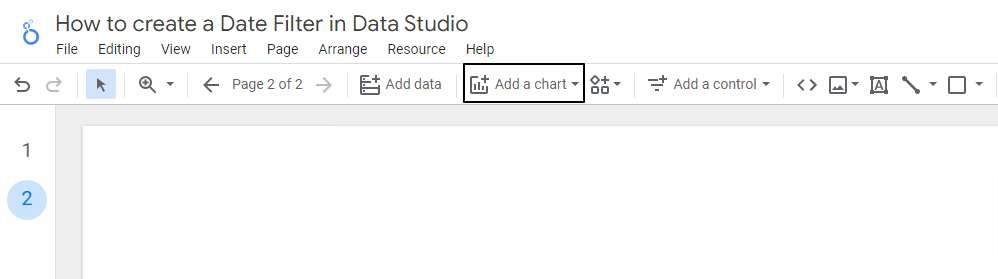
Step 3: Next, let’s create a time series chart to have a glimpse of our choices for selecting the date range. Here’s how to create a time series chart in Data Studio:
- Click Add a chart in the menu bar at the top of the screen.
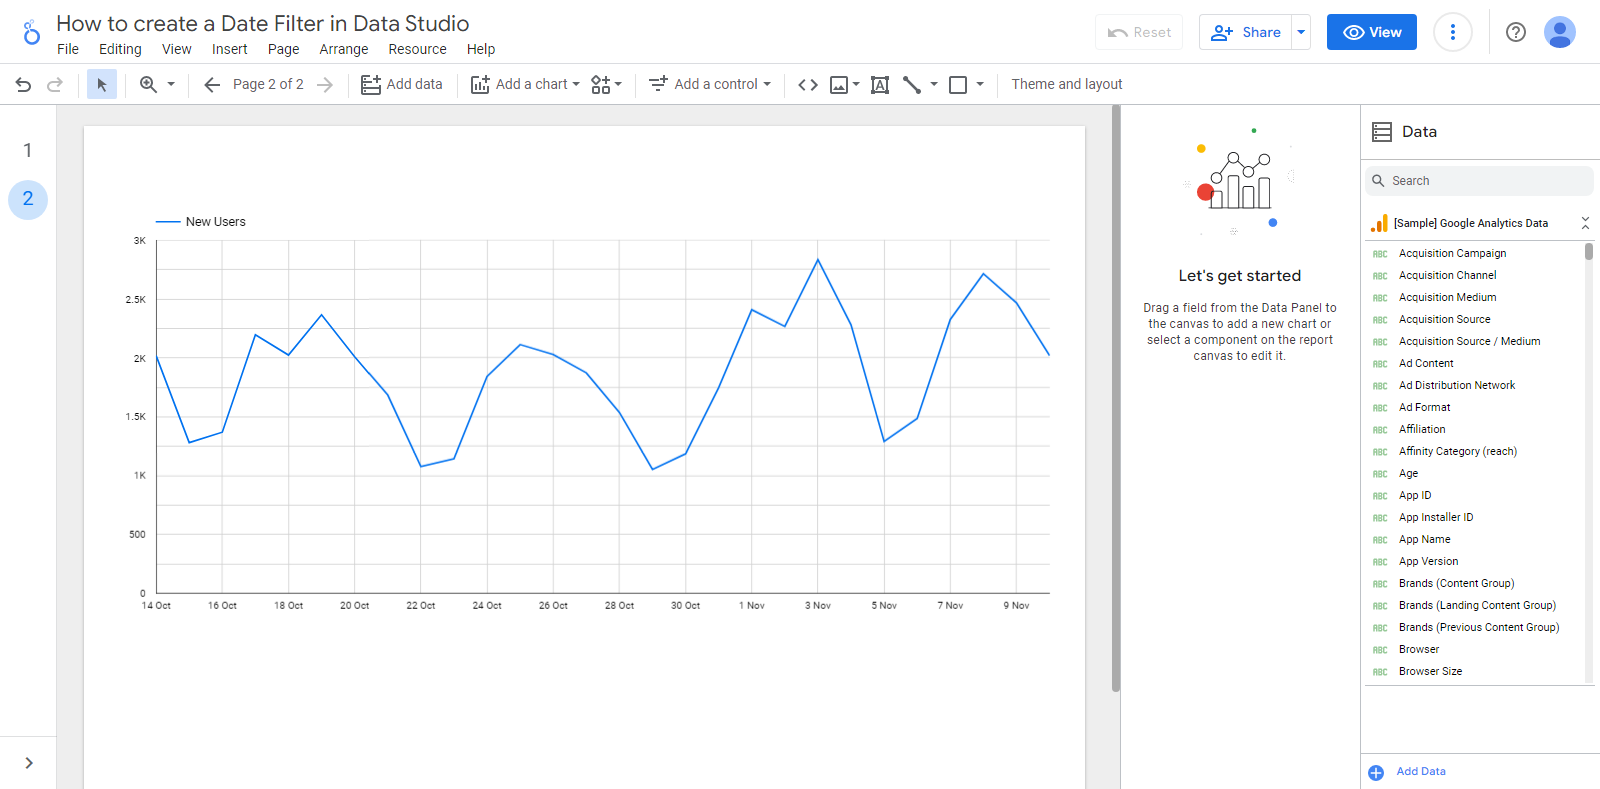
- Then, select the first chart in the Time series section and drag and drop it to where you want to place it on the page.
- You can then change the date/time dimension and metrics to what you want to visualize. I’ll visualize the New Users metric over the Date dimension.
- You can drag the lower right side of the chart to the right to increase the size and view more data.


Step 4: By default, the date range of 28 days (Auto) is applied to a chart in Data Studio. To view this, follow these steps:
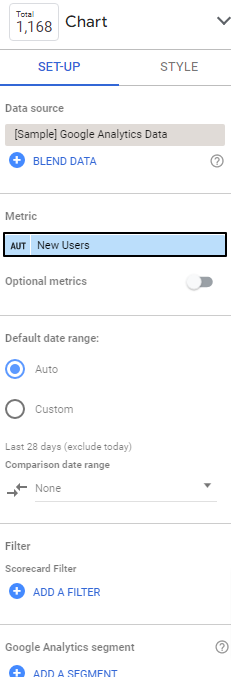
- Click the chart, then head to the Setup on the right of the page
- Then, scroll down to the Default date range section.
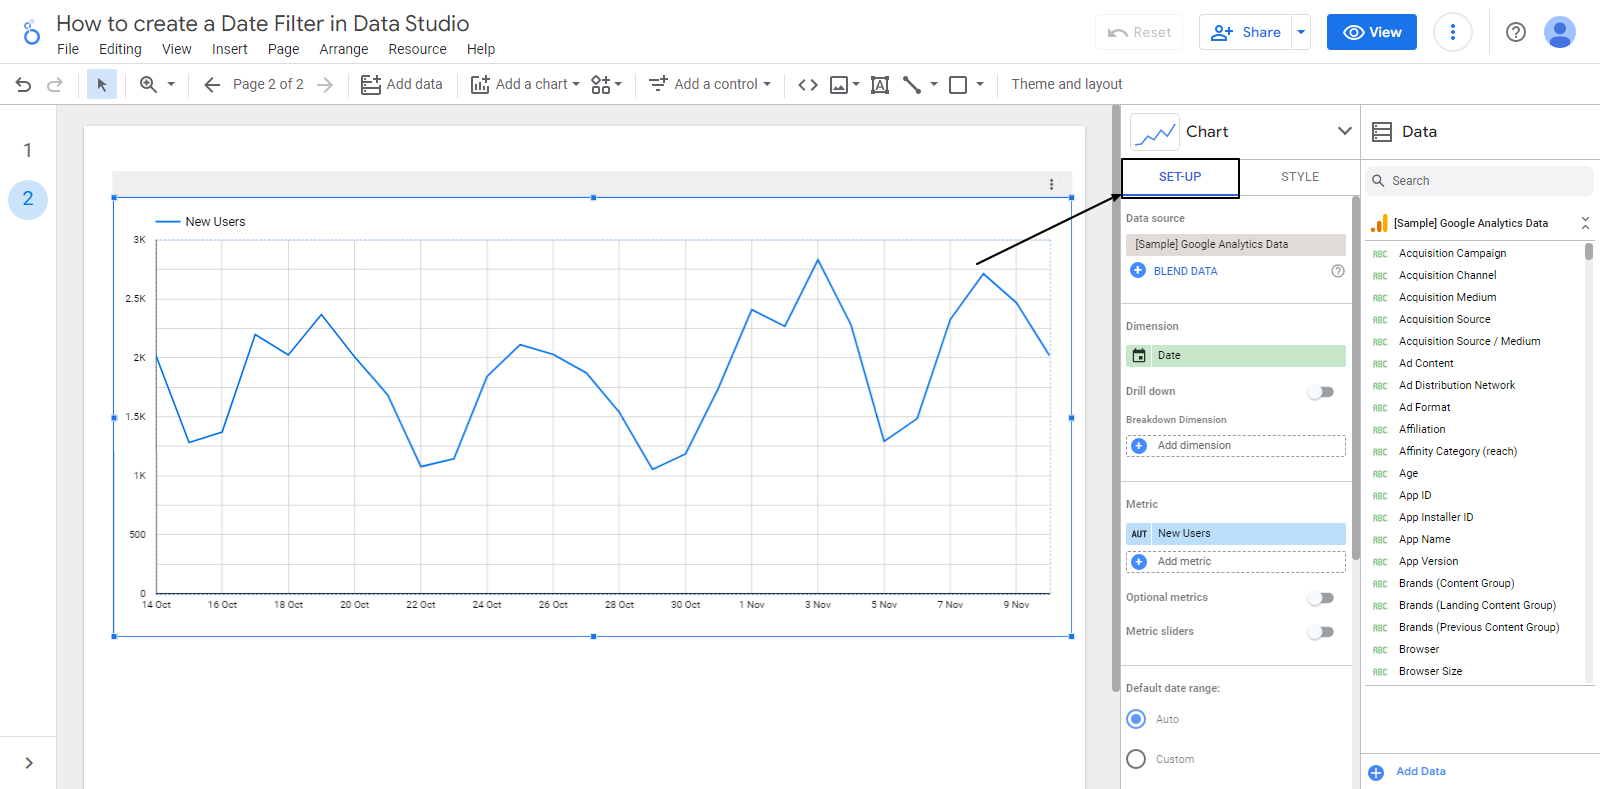
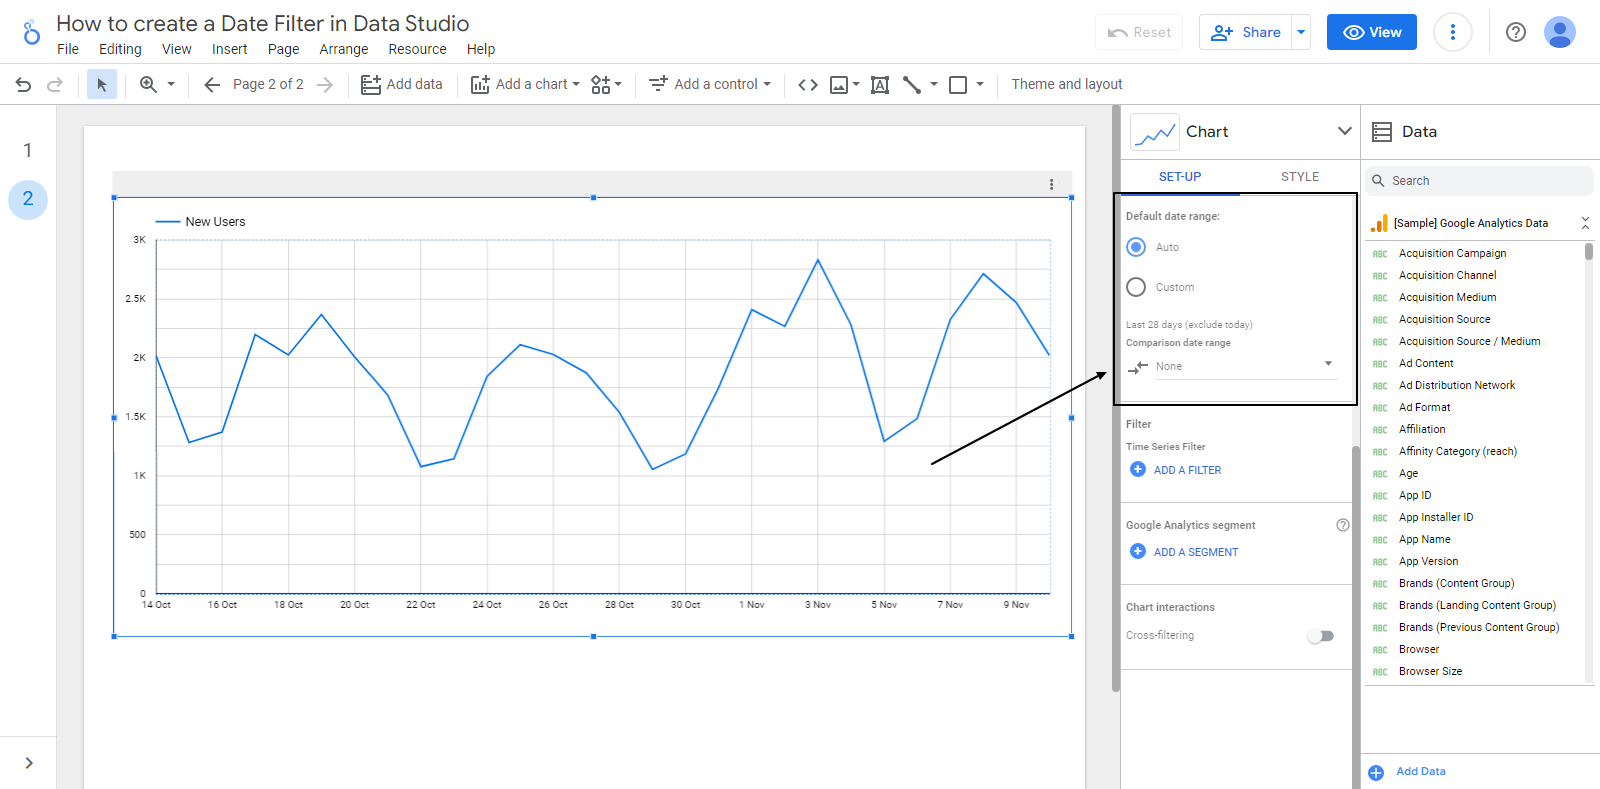
There are numerous date range options available in Data Studio, but only Fixed can create a date range that will be constant regardless of when the report is accessed.
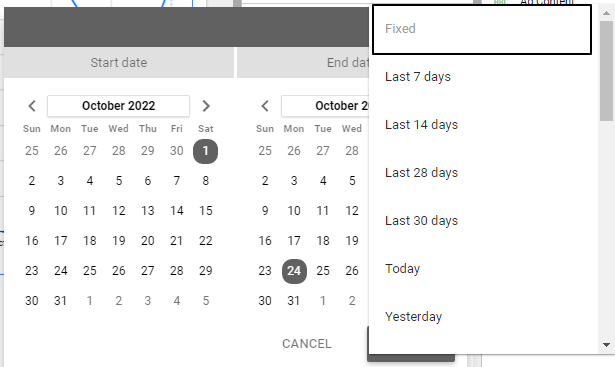
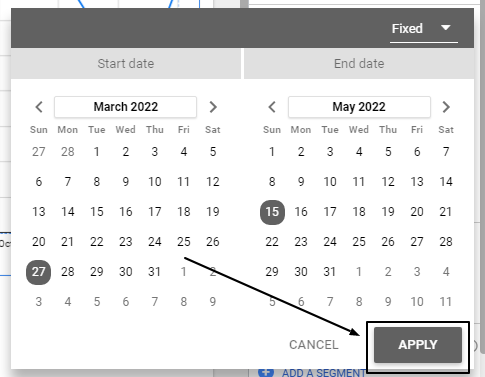
Step 5: Select the Fixed date filter and specify the date range by choosing a start and end date. I’ll choose 27 March 2022 and 15 May 2022 as my start and end dates, respectively.

Step 6: Click Apply to effect the changes on the report.
Step 7: Switch to view mode and ensure the changes have been effected.

Now, you know how to create a rolling time frame with static dates. Regardless of when you view this report, it’ll always show data from 27 March 2022 to 15 May 2022.
Rolling Time Frame with Dynamic Dates
The fixed date option is static, but Data Studio also has a lot of dynamic options. These dynamic date options will display data based on the date the report is being accessed.
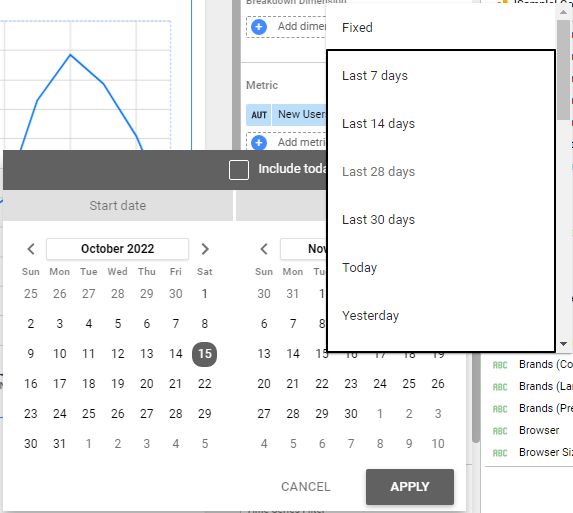
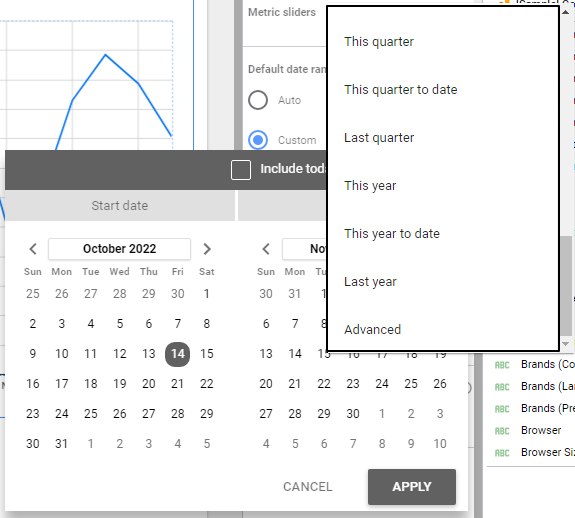
The dynamic date ranges available on Data Studio include the following:
- Last 7 days
- Last 14 days
- Last 28 days
- Last 30 days
- Today
- Yesterday
- This week (Starts Sunday)
- This week to date (Starts Sunday)
- Last week (Starts Sunday)
- This week (Starts Monday)
- This week to date (Starts Monday)
- Last week (Starts Monday)
- This month
- This month to date
- This quarter
- This quarter to date
- Last quarter
- This year
- This year to date
- Last year
- Advanced (Can be static and dynamic)

To create a date filter with the dynamic date range:
Step 1: First, follow steps 1 – 4 on how to create a rolling time frame with static dates in the section above if you’ve not done that before.
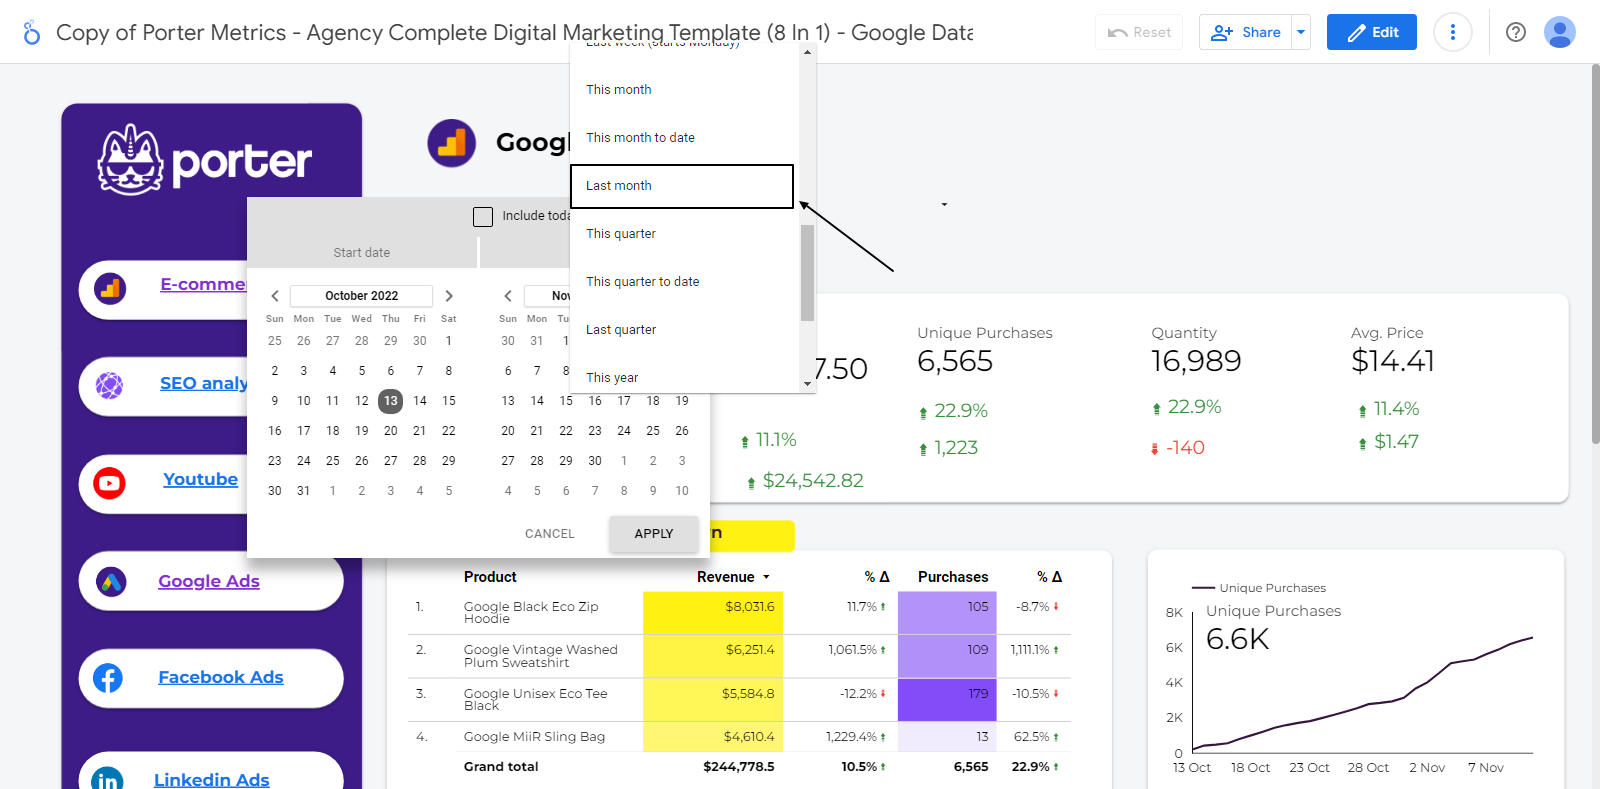
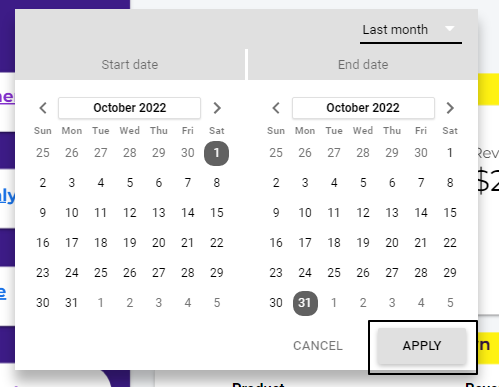
Step 2: Select a dynamic date range from the options. I’ll select the Last month’s date range.

Step 3: Click Apply.
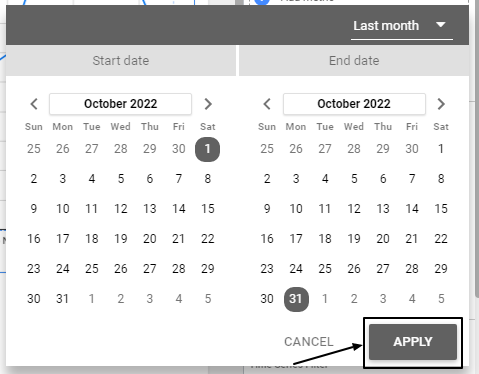
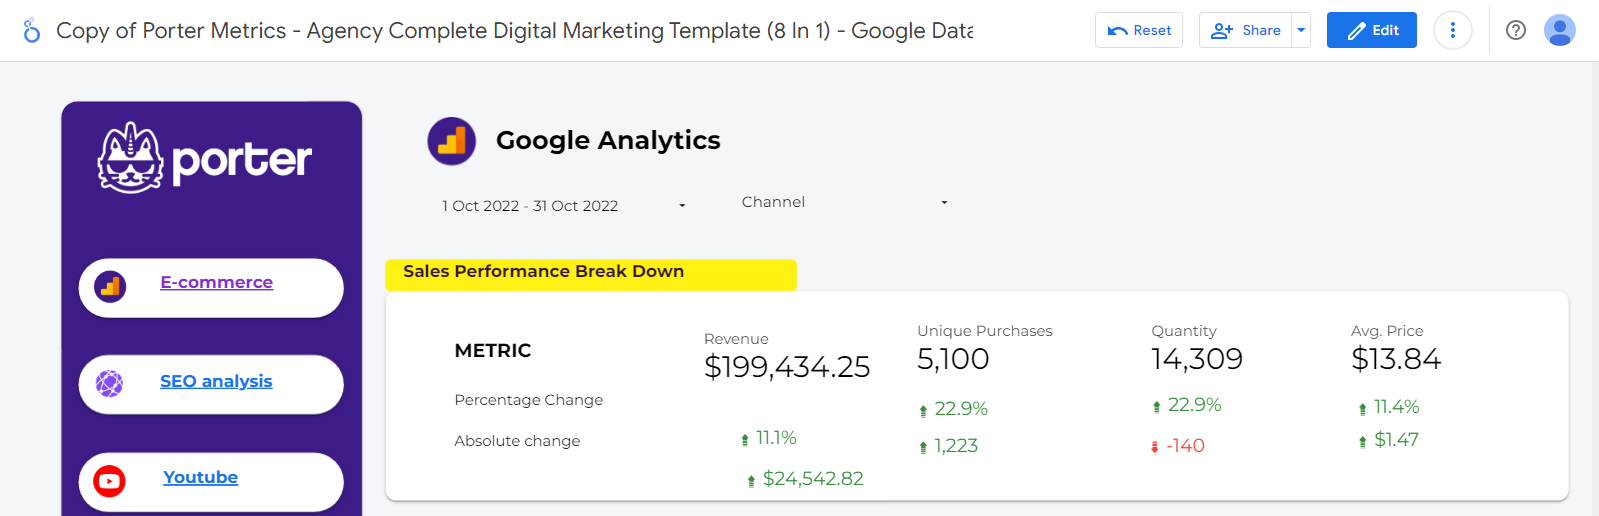
Step 4: Change the report to view mode to confirm that the changes have been effected. Since the current date is in November 2022, the chart will show data from October 2022.

So, say the current date is 25 February 2023; the chart will display only data from January 2023.
Now, you might want to set the date range for a chart to display data from two months ago until 7 days ago. You can use the Advanced date range for this, and I’ll take you through how to implement it.
Advanced Date Selection
Advanced date selection allows you to customize all kinds of date ranges and timeframes for your data reports.
To access this date range, click on the Advanced option from the dropdown when you open your date range control.

Here are the steps to implementing the Advanced date range:
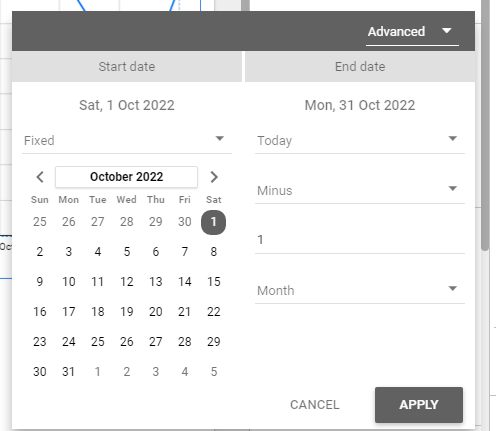
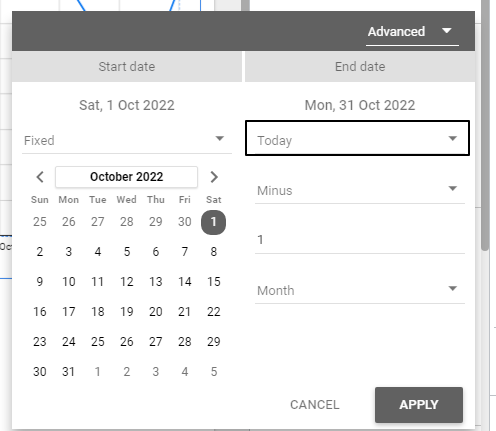
Step 1: Select the start date. Today and Fixed are the two options that can be selected for the first field in the start date column. Choose Fixed.
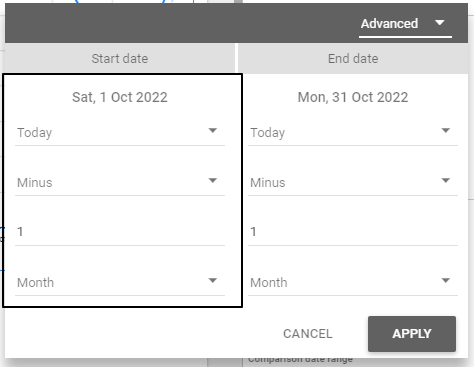
For instance, we want to visualize all data from the beginning of the fourth quarter (October 2022) till the current date.
Here, I’ll select Sat, 1 October 2022 (Fixed) as the start date.
Step 2: Select the end date for Today. We don’t want our report to include all data up to today, but we’ll address that in the next steps.
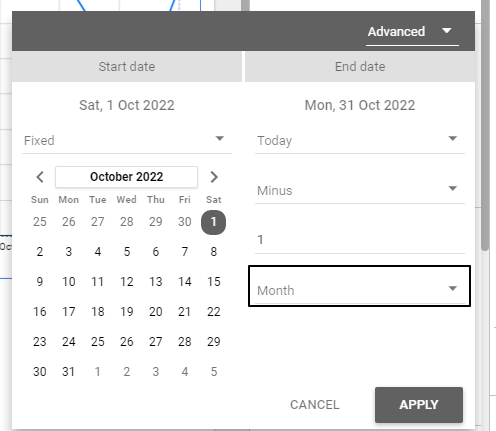
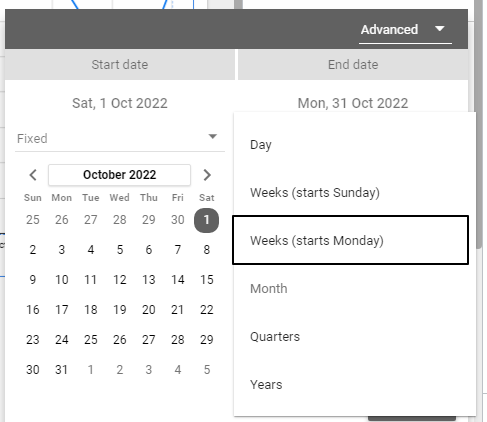
Step 3: Change the field with Month as its default value to Weeks (Starts Monday), as we’re planning to visualize data from the beginning of the fourth quarter to the last week.
Step 4: Then click Apply.
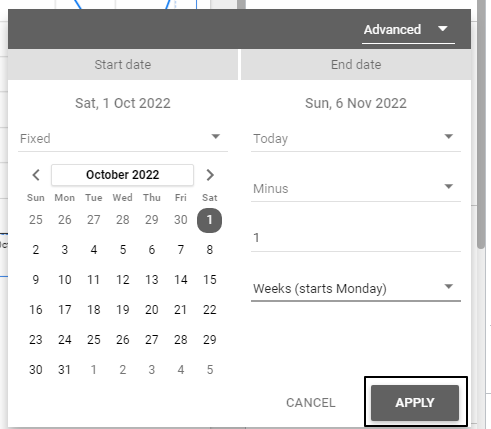
Step 5: Change to View mode to check that the date range has been affected on the chart.
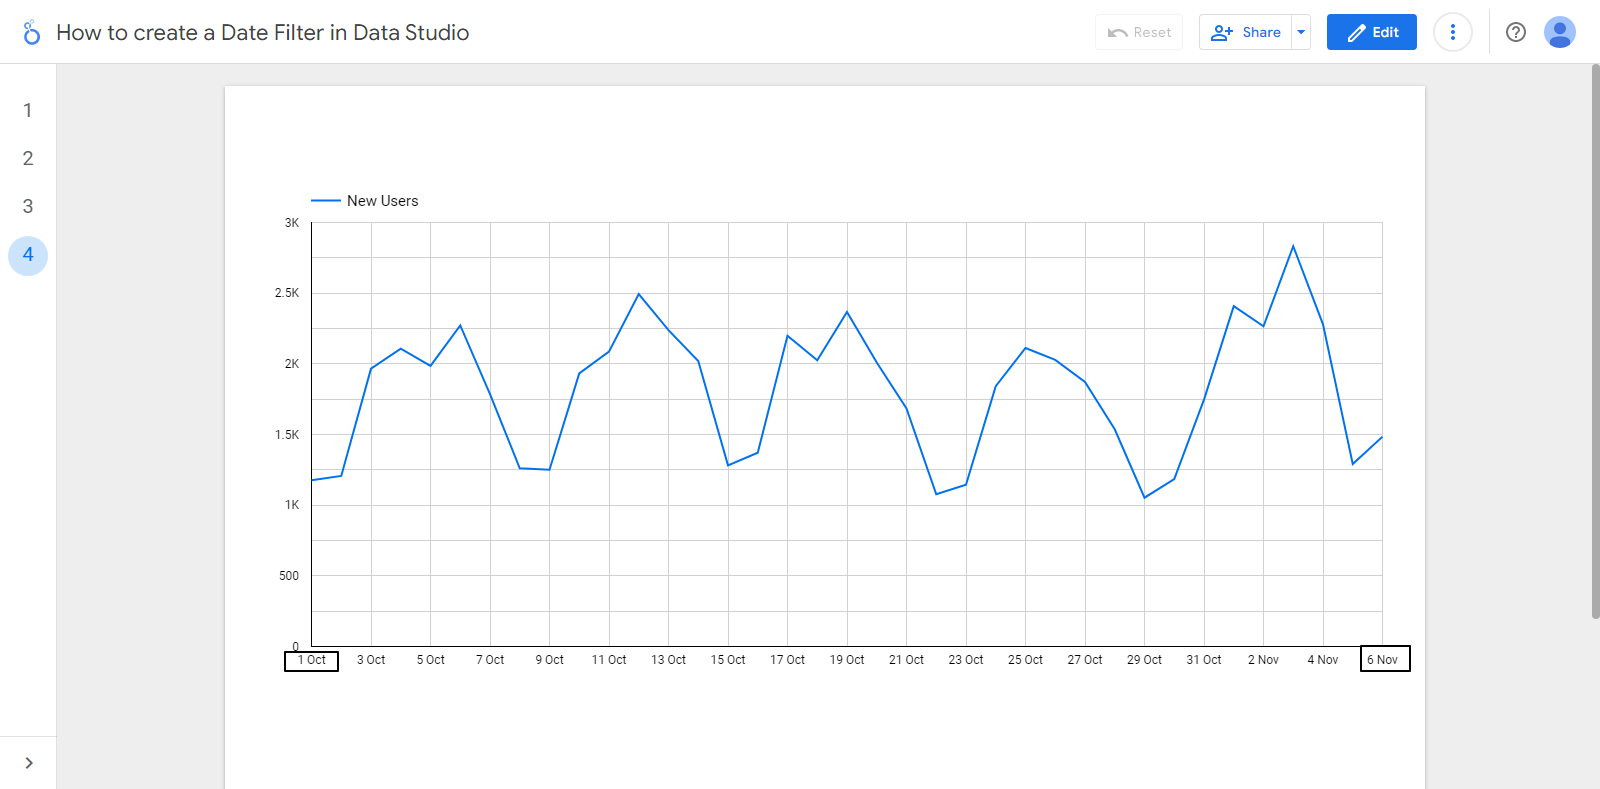
Now, whenever an end-user views the report above, they will notice that it starts on 1 October 2022 and displays up to the previous week.
How to Choose a Dynamic Start Date
You can also choose a dynamic start date for your reports. Here are the steps to create one:
Step 1: Select the Advanced option in the date range menu.
Step 2: Select the start date.
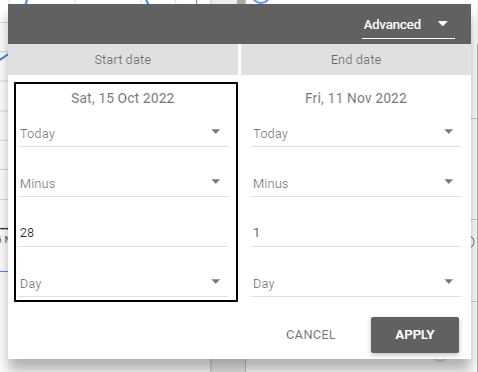
For this example, I’ll set the date range to visualize data from four weeks ago to a day before Today.
To set the start date, I’ll change the third field (with a default value of 28) to 4 and the fourth field (with a default value of Day) to Weeks (Starting Monday).
Step 3: Select the end date.

The end date can be kept the same, as the goal of the date range is to visualize the data from the last four weeks till the day before the current date (Today).
Step 4: Click APPLY.
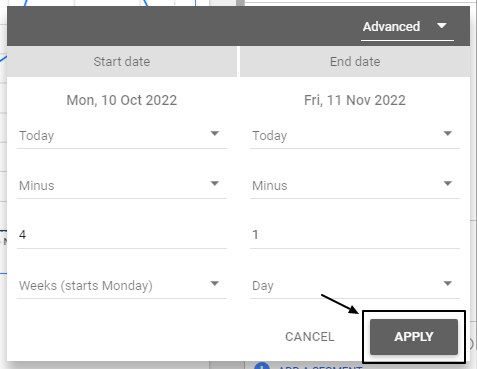
Step 5: Switch to View mode to see the new changes.
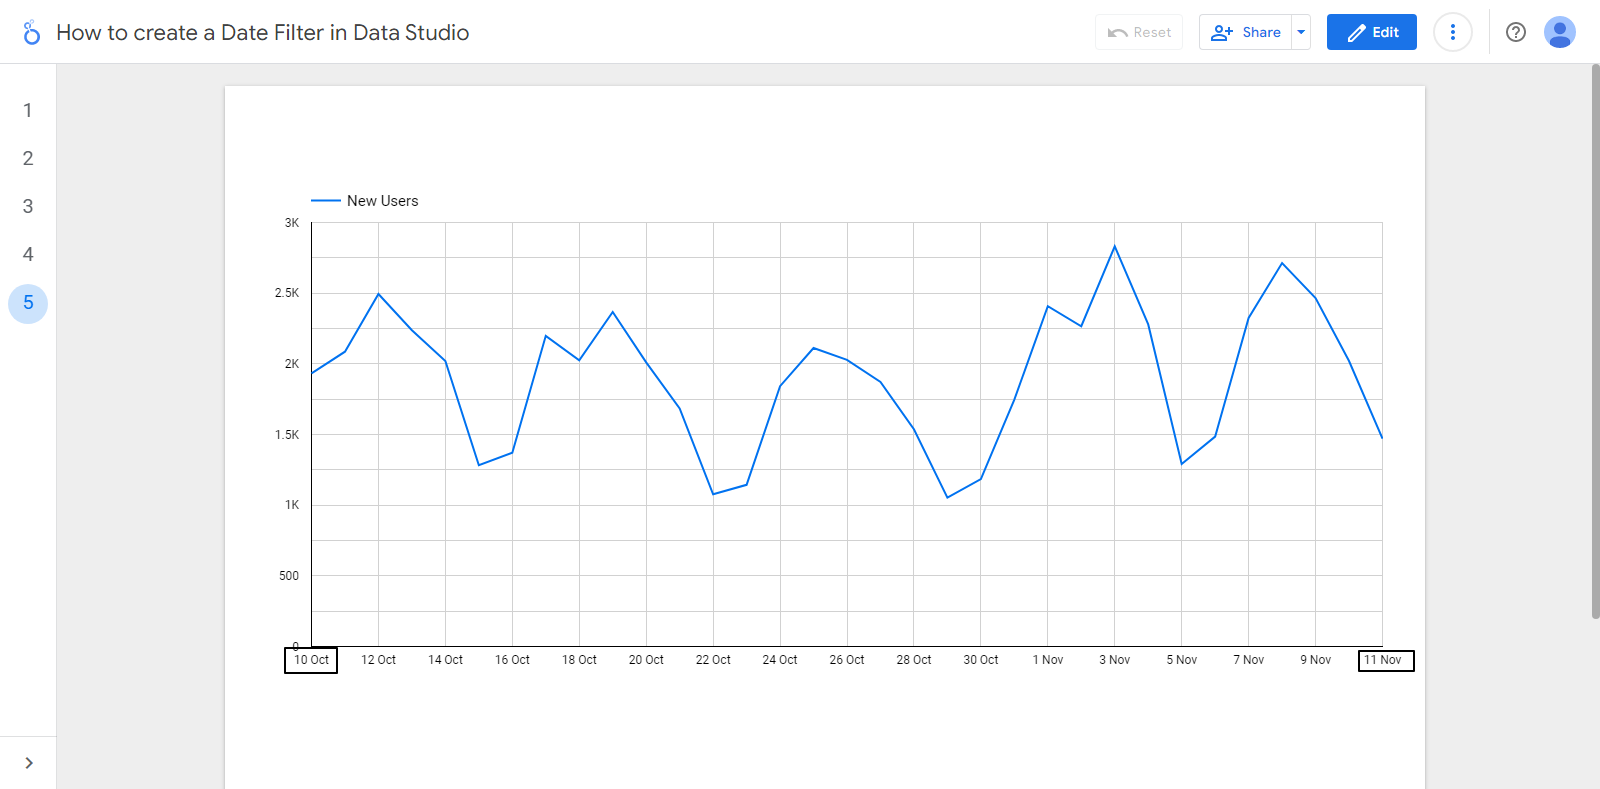
After applying the changes, the chart will always display data from the last four weeks to the day before the current day.
Comparing Metrics for Advanced Date Ranges
You should know that we can use the advanced date range option for more than time series charts. In this section of the post, I’ll use a scorecard to demonstrate changes in statistics between periods.
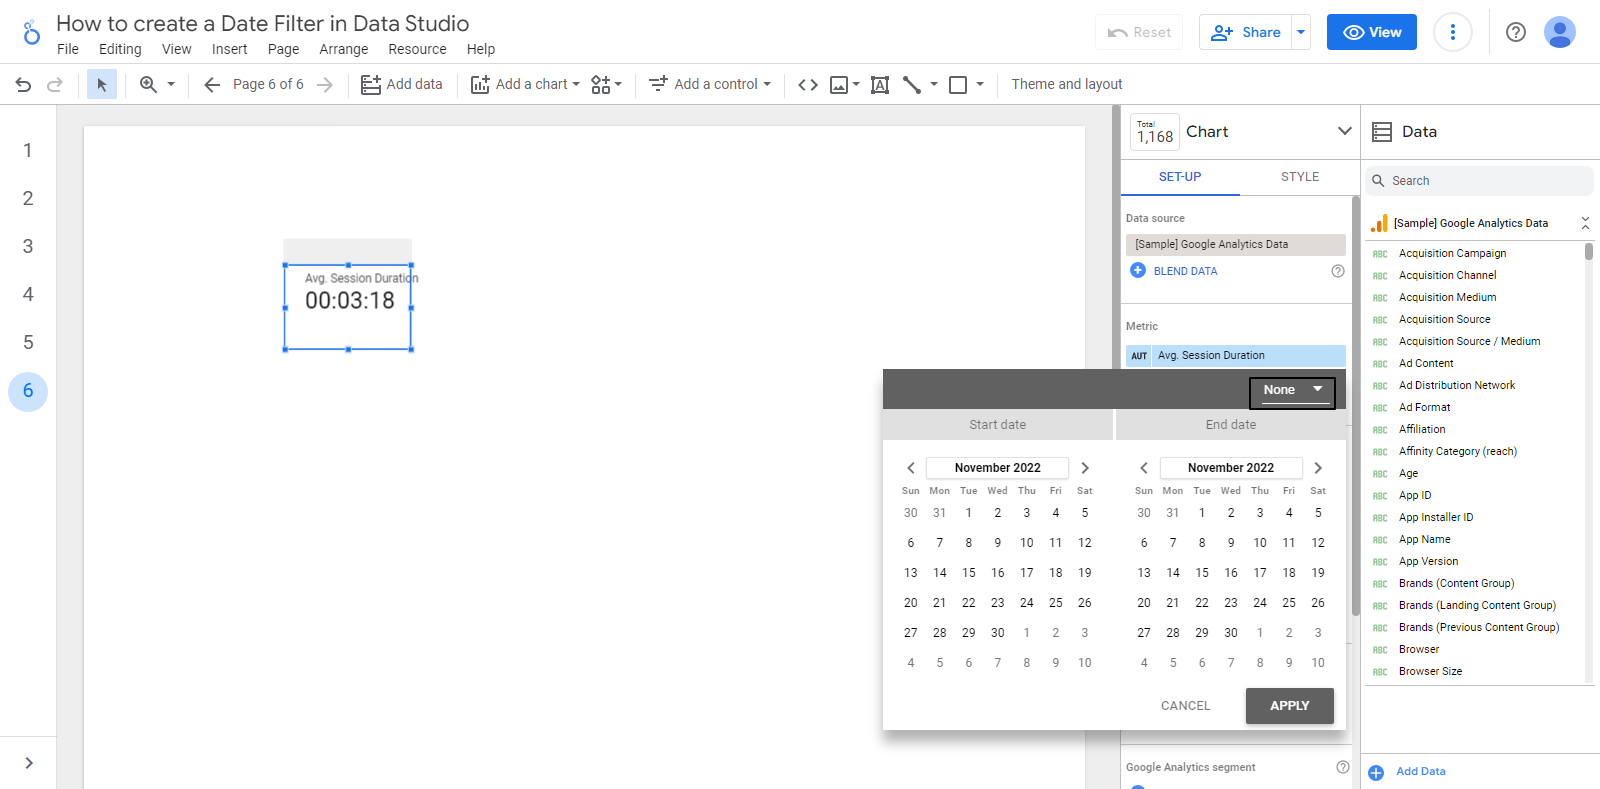
Step 1: First, Click on the Add a chart dropdown, then choose Scorecard.


Since a scorecard shows you a single metric, it’s suitable for significant total counts and averages. For this section, I’ll use the scorecard to visualize the average session duration.
Step 2: Drop the scorecard where you want to place it on the page.
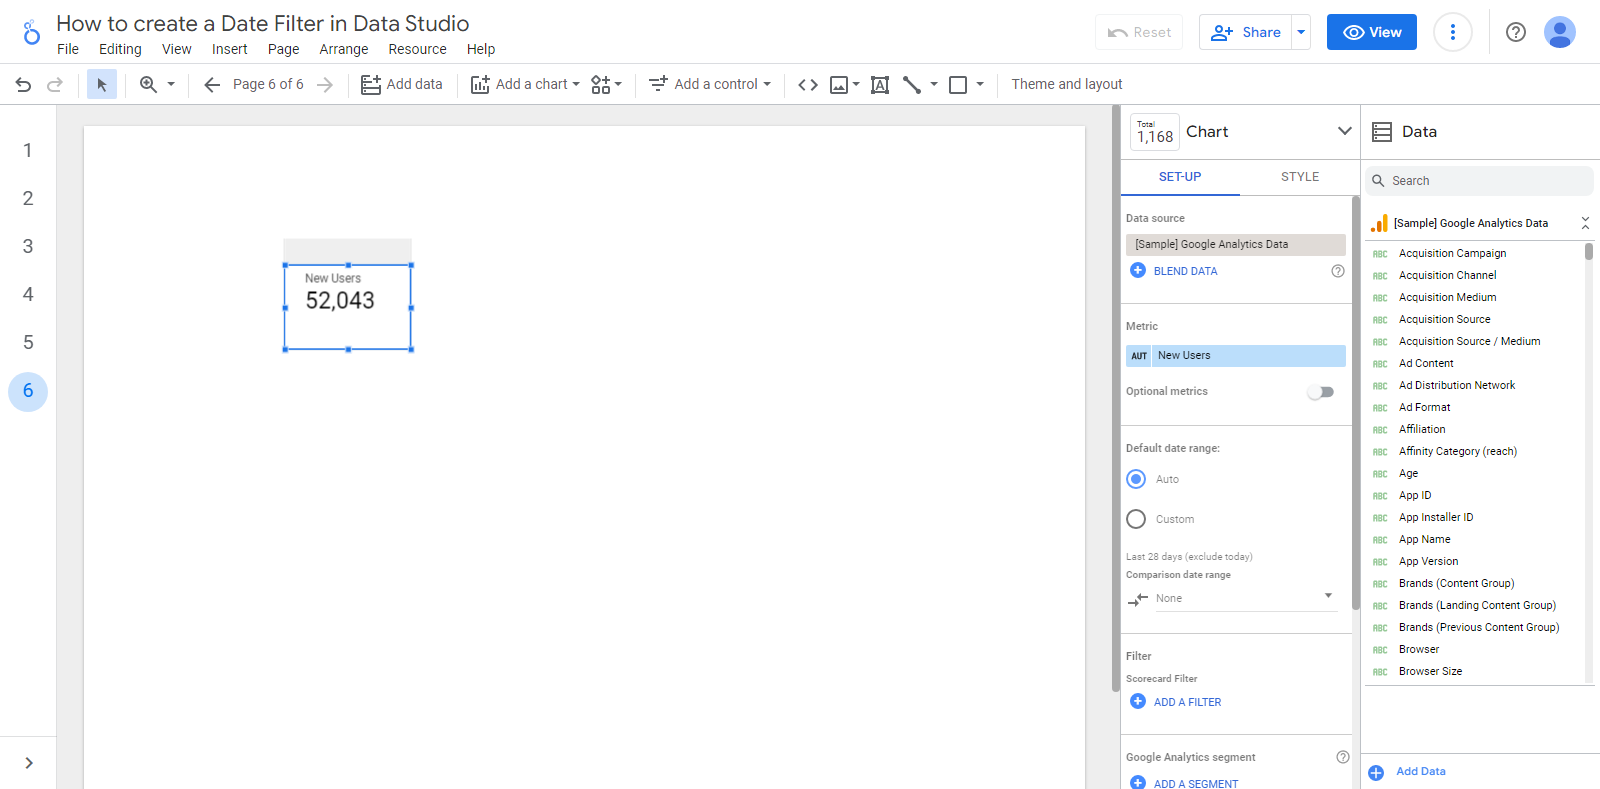
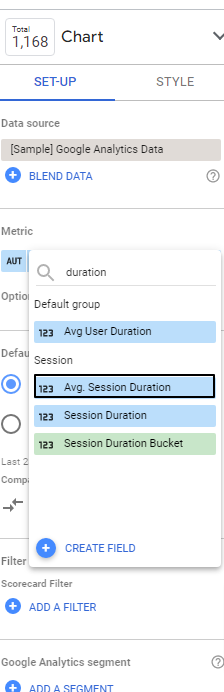
Step 3: Change the metrics to your preferred metrics (In my case, Average Session Duration)
Input the name of the metric in the search box

Select the metrics you want to visualize.
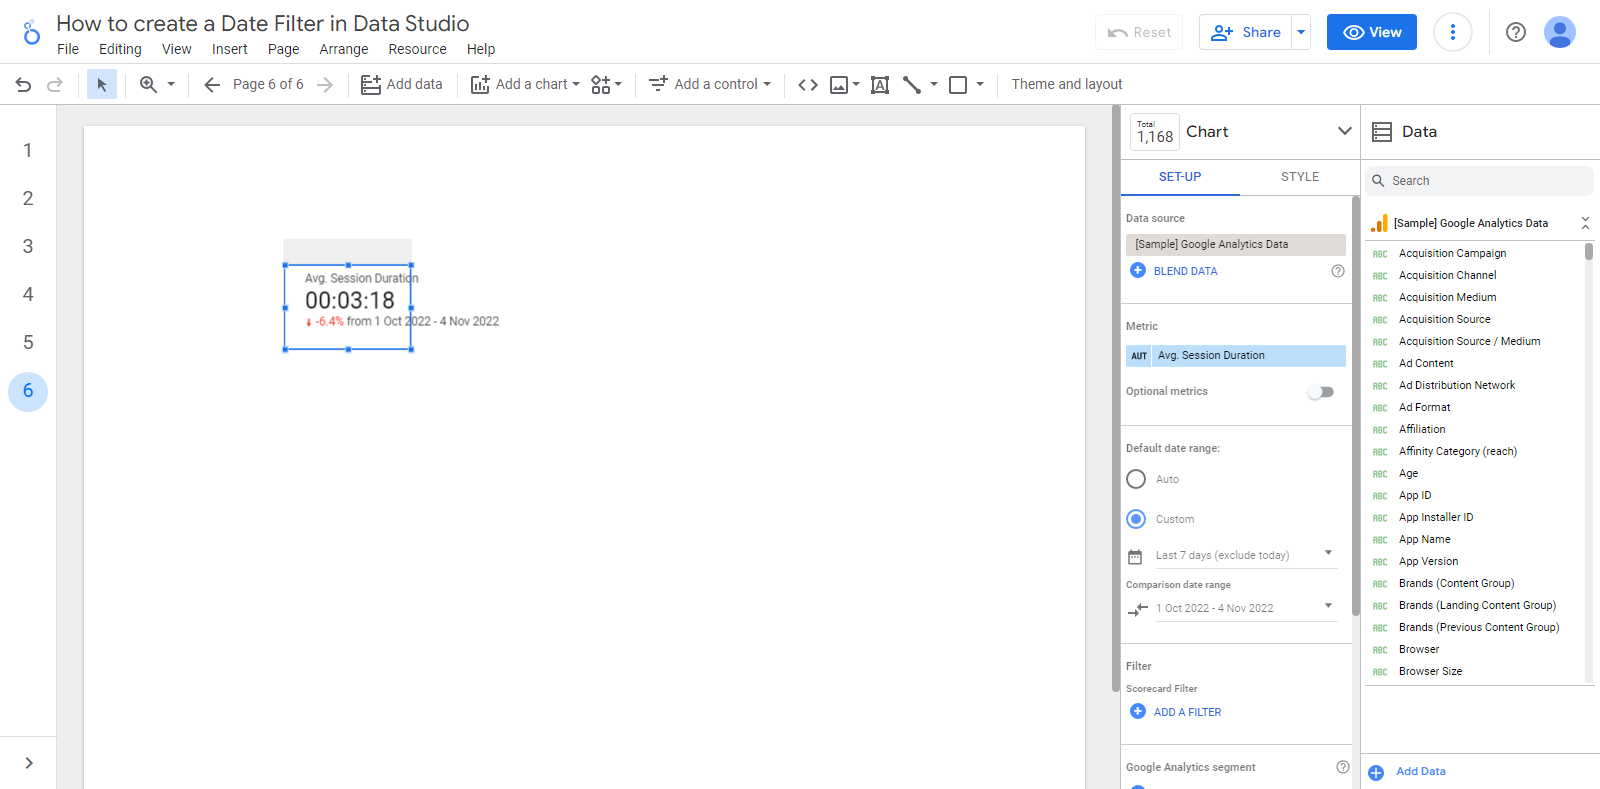
Step 4: Click on the radio button for Custom, then the date range section.
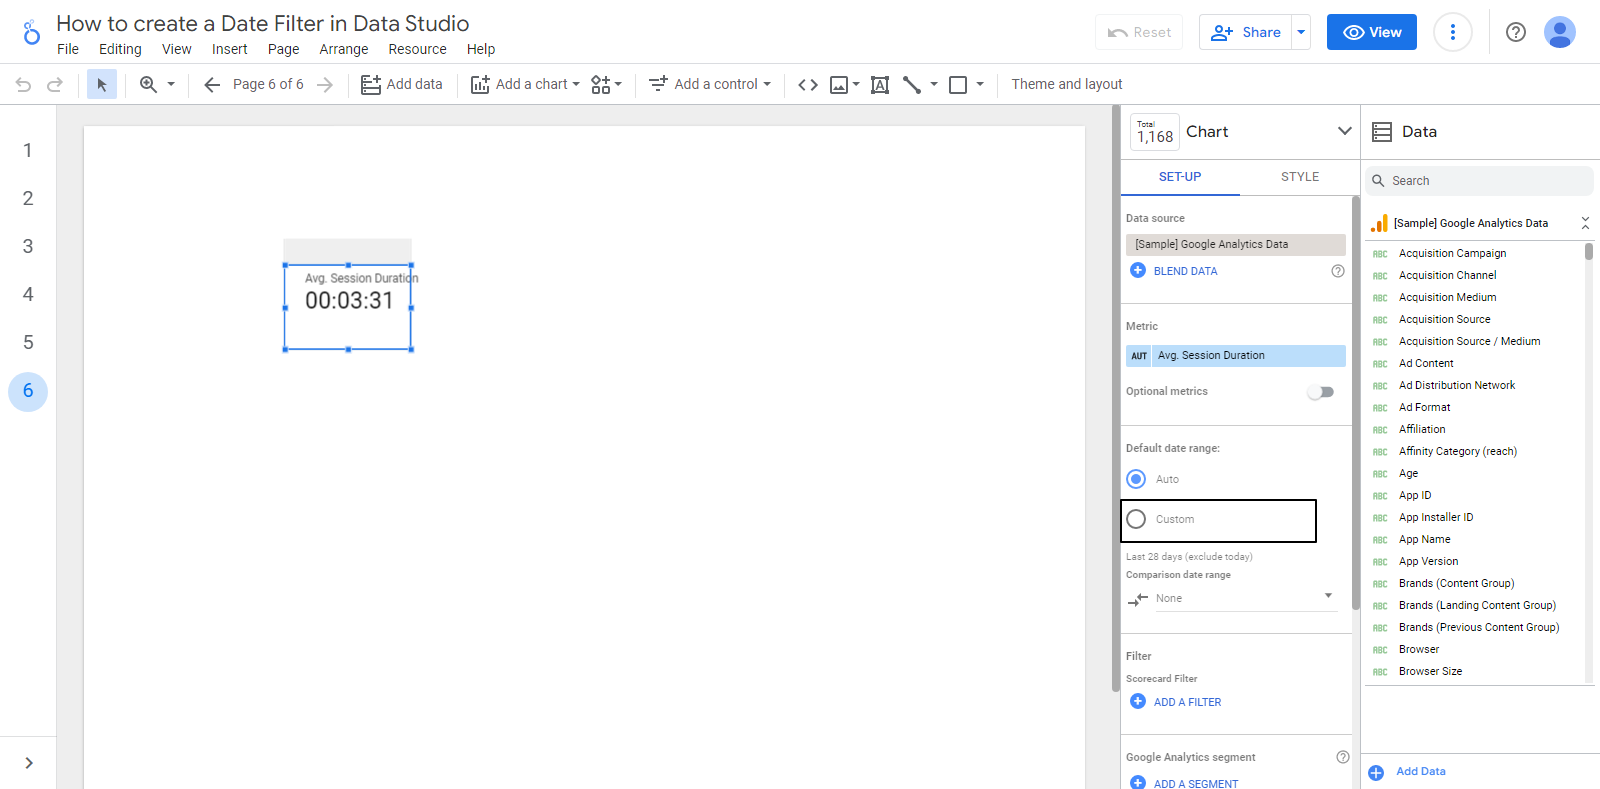
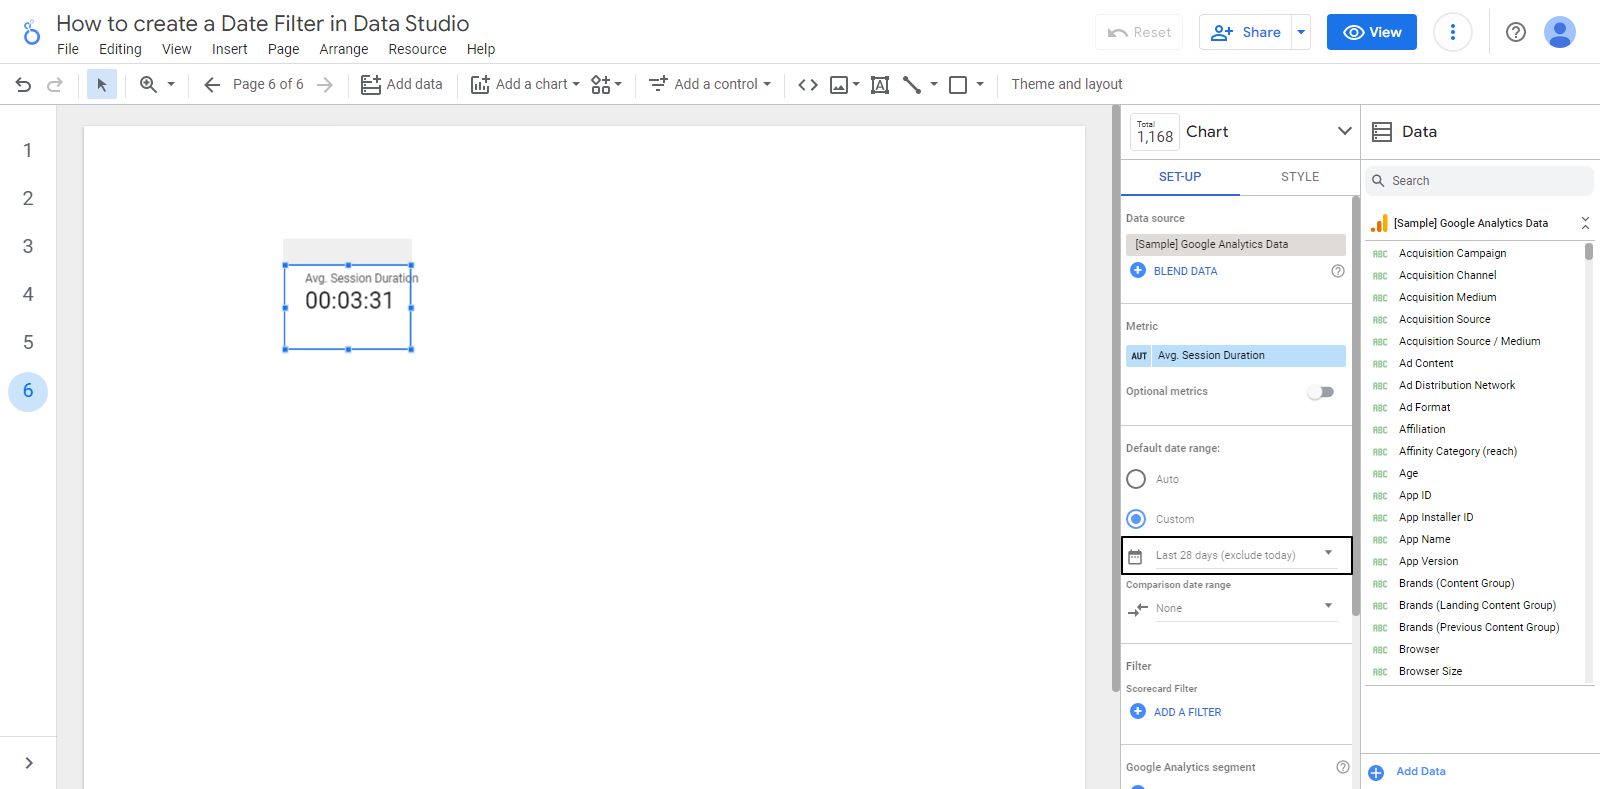
Step 5: Then click on the date range dropdown menu.
Say we want to check the performance of our website in terms of Average Session Duration over the last seven days (last week) compared to the average from the beginning of the quarter to the last seven days.
To implement this, we’ll need to set the custom date range for the value of this scorecard to start from the last seven days (last week) till a day before today.
You need to choose the Last 7 days option on the date range dropdown menu.
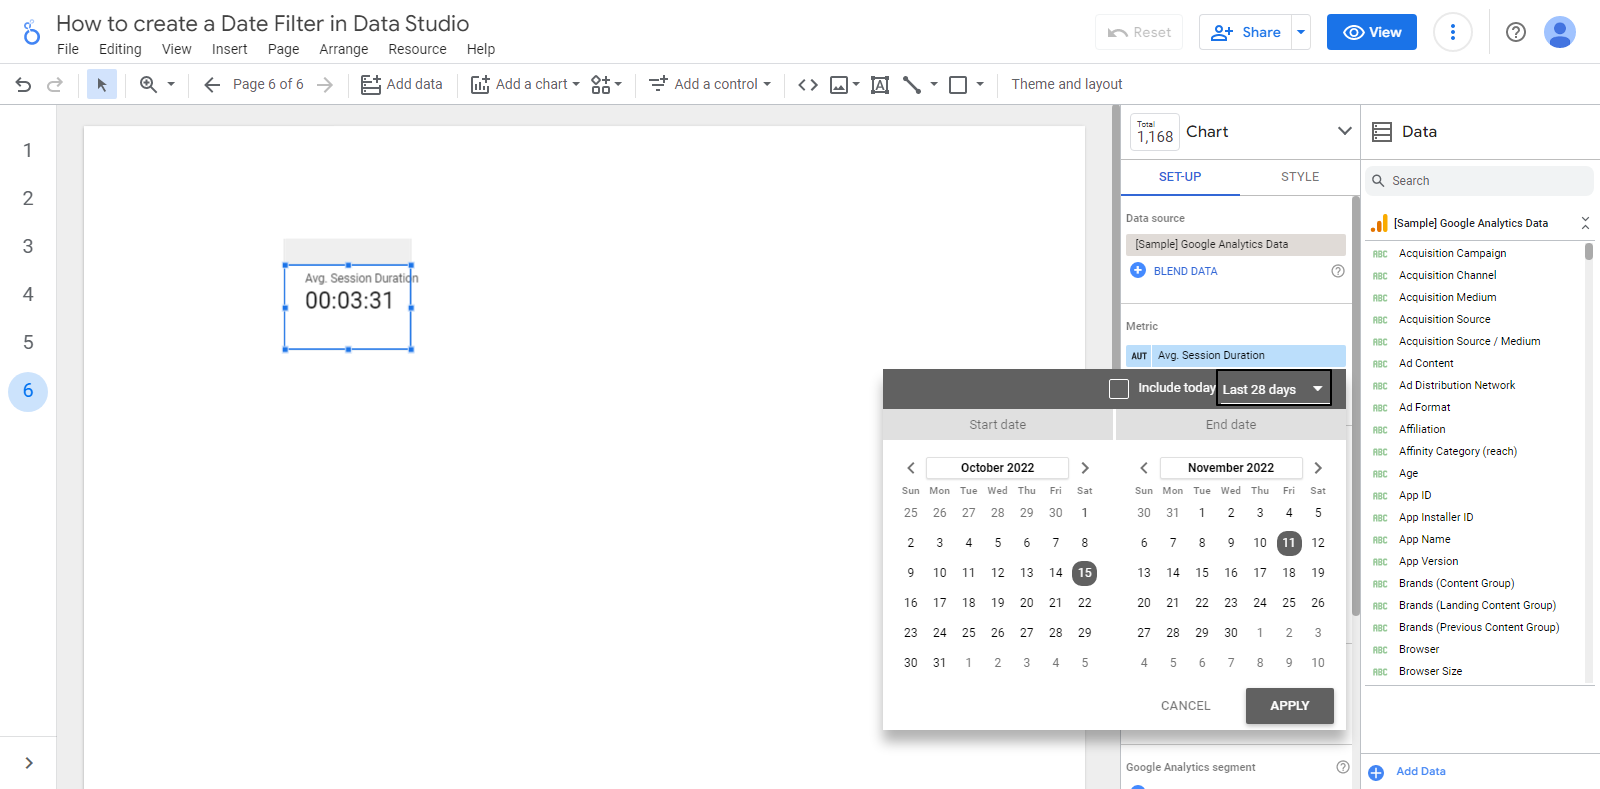
Step 6: Select the date range for the scorecard (in this case, the Last 7 days)

Step 7: Click Apply.

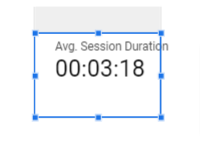
Here’s how the scorecard looks now.
Now, we want to compare it to the Average Session Duration from the beginning of the current quarter (fourth quarter) up to eight days ago.
Step 8: Click on the Comparison date range dropdown.
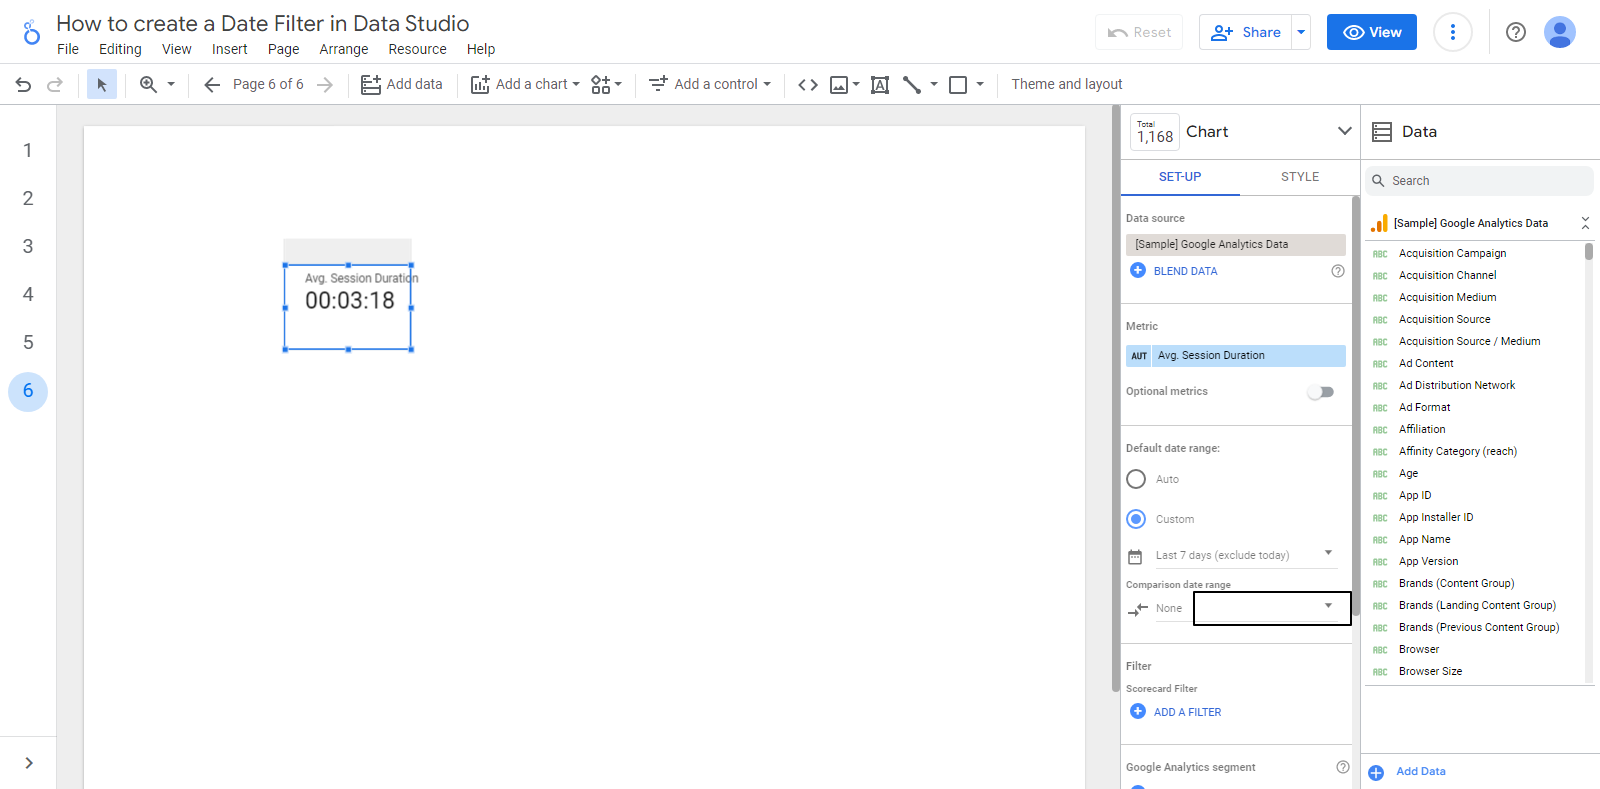
Step 9: Click on the date range dropdown menu to create a custom comparison date range.
Step 10: Then click on Advanced under the start date section.

Step 11: We need to specify the start and end dates. To change the start date to the beginning of the quarter, change the fourth field (default value of Days) to Quarters.
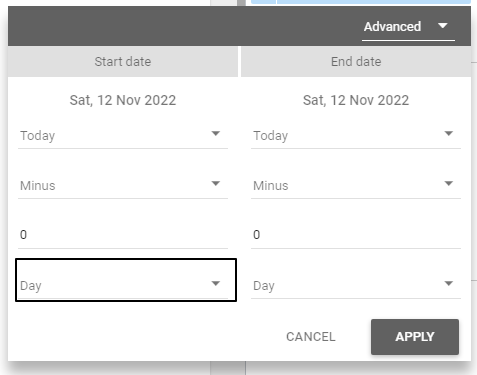
Step 12: Set the third field in the End date column to 8 (since we excluded the current date in the original date range for the scorecard)

Step 13: Click APPLY.

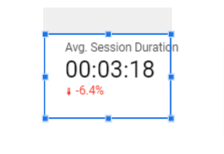
Now, the workspace shows the Average Session Duration for the last seven days and shows that the value is slightly lower than the value from the beginning of the quarter to the last 7 days.
Now, the only issue is that the scorecard doesn’t display the change and the comparison date range. Let’s format the charts so that the information is clear. Here’s how:
Step 1: In the right sidebar, click the Style tab.
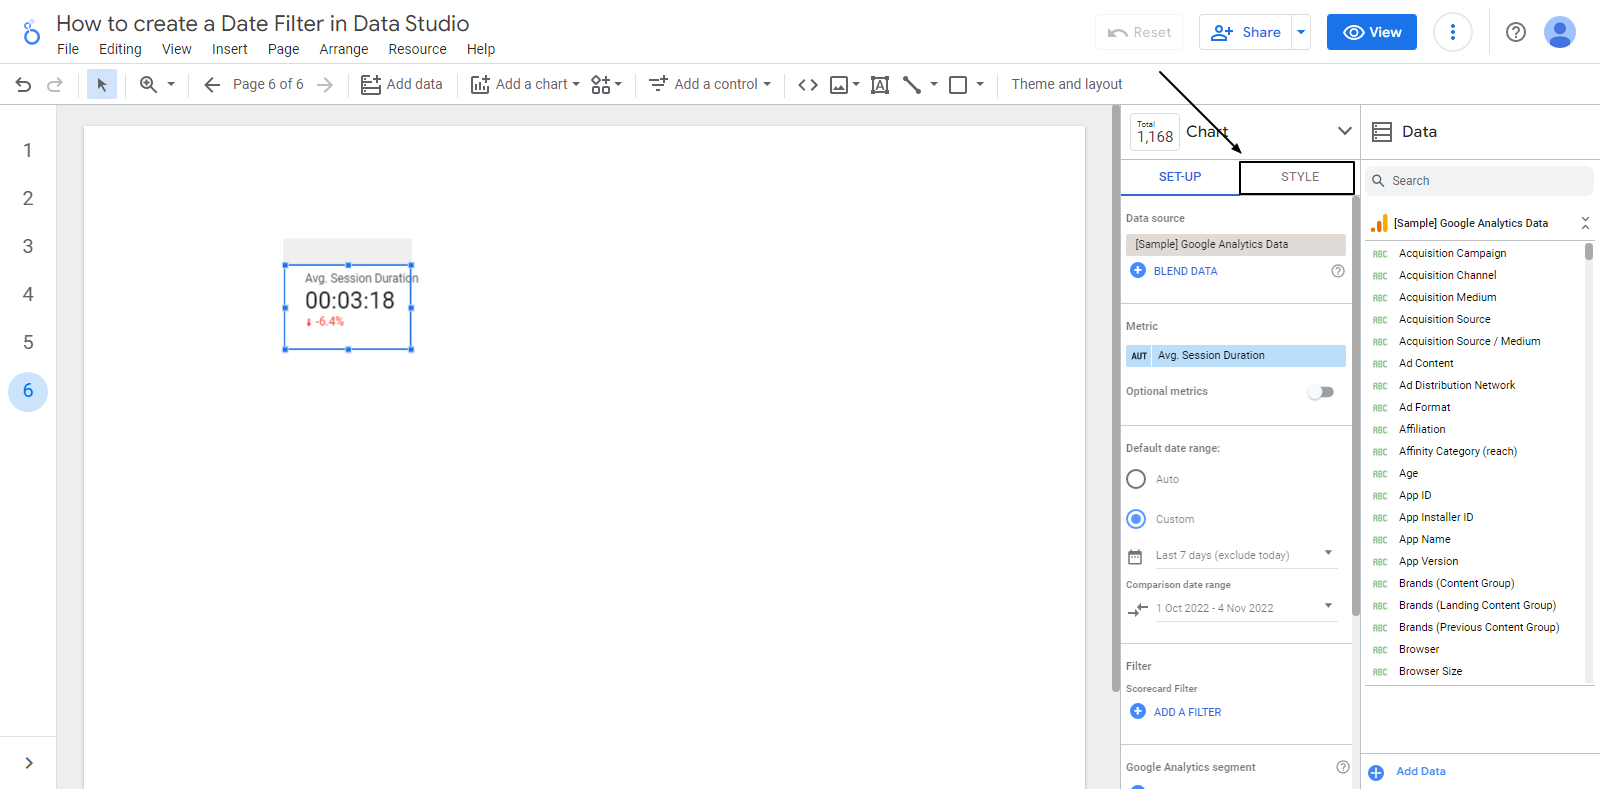
Step 2: Untick the box for Hide Comparison Label so that the scorecard shows us what the primary value is being compared to.
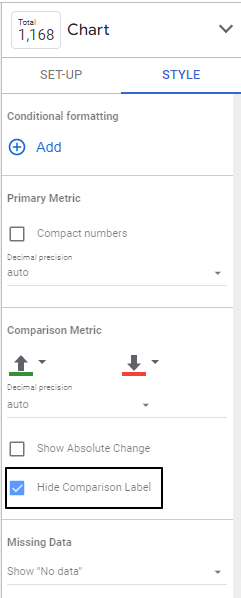
We can see here that the average session duration decreased by 6.4% compared to our custom comparison date range.
Step 3 (Optional): If you’d like, you can also tick the box for Show Absolute Change.
This option will show that the Average Session Duration is about 13 seconds less than it was from the beginning of the quarter (1 October 2022) to the last 7 days (4 November 2022).

So as you can see from this section of the post, we can also use Advanced date ranges for comparison date ranges.
How to Create a Date Filter for a select group of reports within Google Data Studio
In this section of the article, I’ll highlight the steps to create a date filter for a select group of reports within Data Studio.
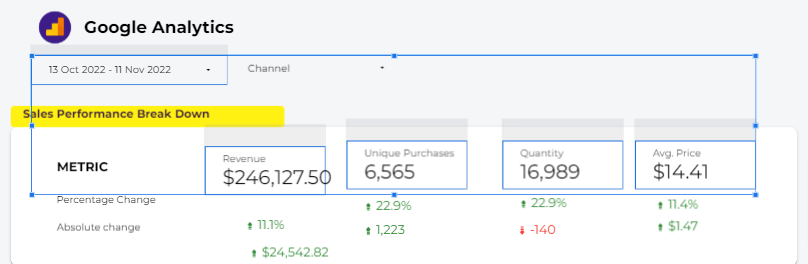
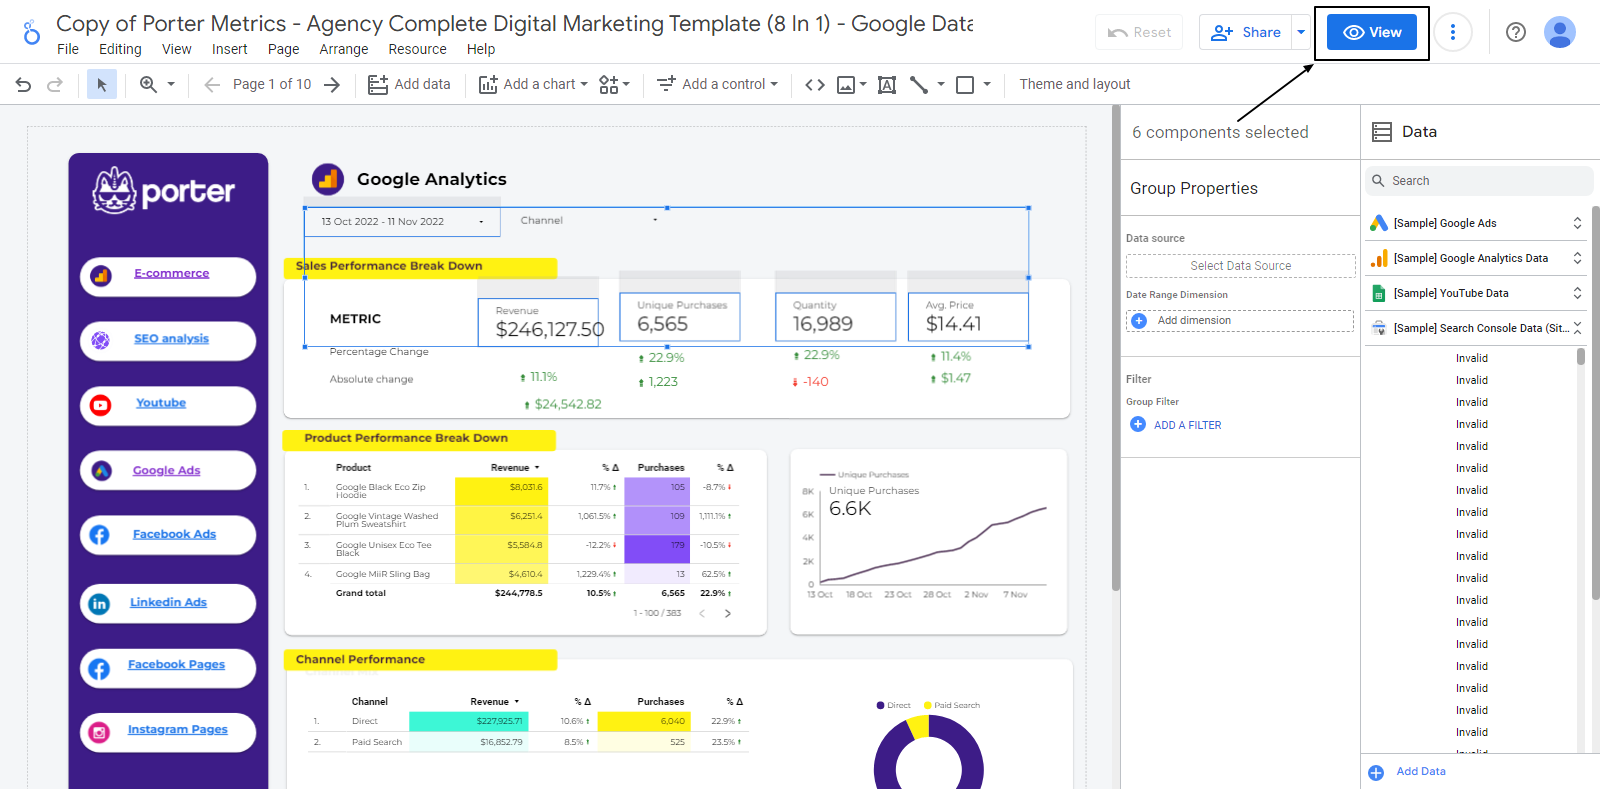
Group desired Reports together
To group the desired report, Ctrl/Command + Click all the report elements you want to group, including the date range.
Then, right-click and select Group.

Set Group Defaults
Now, you need to set group defaults in the Group Properties tab by making sure a data source is selected.
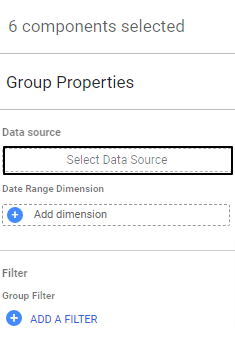
For instance, when I grouped the scorecards, the data source column became blank. All you need to do is select the data source again.


You should also make sure a Default date range is selected.
Change all reports to AUTO date range
Next, click on all the charts and set the default date range to Auto.

Go to View Mode to test out
Once complete, click on View on the upper right-hand side
Click Date Dropdown
Click on the date filter.

Apply Date Range
Next, select from the list of ranges, or use Custom.
Then, click Apply
Now, you can view the data.
Conclusion
With this comprehensive tutorial, you must have become much better at creating date filters in Data Studio. You should take the next steps by experimenting with the new concepts you learned from this article to your marketing data.
Creating reports from scratch requires a lot of work, so we at Porter Metrics created a gallery of free templates – like the template used in this article – to make your reporting tasks easier.
We also offer you Data Studio connectors to help you pull your data from multiple sources like Facebook, Instagram, Shopify, LinkedIn, TikTok, and other popular platforms into one place.
You should start your reporting journey on Data Studio by creating a free report (14-day free trial on all connectors; No credit card required).
You can also schedule a one-on-one call with us if you find it hard to create your first report, and our support team will assist you in the best way possible.
Frequently Asked Questions
How do I add a date filter to Google Data Studio?
Here’s how to add a date filter to Google Data Studio:
- Sign in to Data Studio.
- Open the report to which you want to add a date filter OR Create a new report and add chart(s).
- Click the chart you want to add a filter to.
- Navigate to the Default date range option in the Setup tab.
- Check the Auto radio field if you’re okay with the Auto date range (28 days). If you want to choose a Fixed date range or a dynamic date range (such as Last Month, This Month, Last Quarter, Last 7 days, etc.), check the Custom radio field.
- Select the start date and end date.
- Click APPLY.
How do I filter by month in Data Studio?
To filter by month in Data Studio, follow these steps:
- Follow steps 1 to 4 in the answer above.
- Then, check the Custom radio field.
- Now, you have two options (depending on what you’re trying to implement). You can:
- Choose the dynamic date ranges (such as This month, Last month, and This month to date)
- Choose the Advanced date range, then specify the start date in terms of the month. You can also choose Today as the end date or specify the number of months after the before date as your end date.