


We’ve compiled a list of the 10 best Facebook Insights reporting tools in 2022. These tools can help you make sense of your Facebook data and find actionable insights that will help improve your Facebook marketing strategy.
In this way, you will analyze how your page grows and track critical key metrics to your business. Also, you will use valuable insights to make crucial decisions, for example, work on new content related to your audience or delete content that is not working.
What is “Facebook Insights”?
Facebook Insights is an analytics tool provided by Facebook that can help you track your user behavior and post-performance on your Facebook business page. In other words is the Facebook native analytics tool.
Facebook Insights can provide you with key metrics such as likes, users, growth and demographics, post reach, and data related to how users behave on your page and what kind of content they’re engaging with.
To access Facebook Insights, you will have a business page. If you already have it, you can follow the following steps below:
1. Once into your Facebook account, head to your business page. Then, click on “Insights,” located on the sidebar to the left of the page.
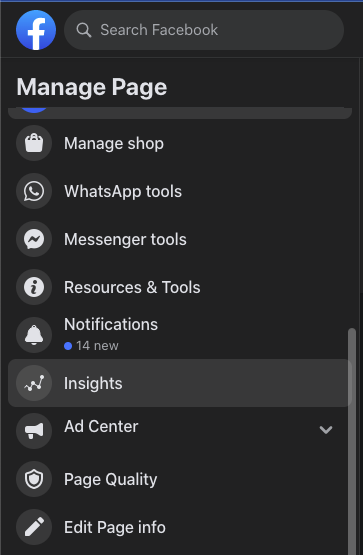
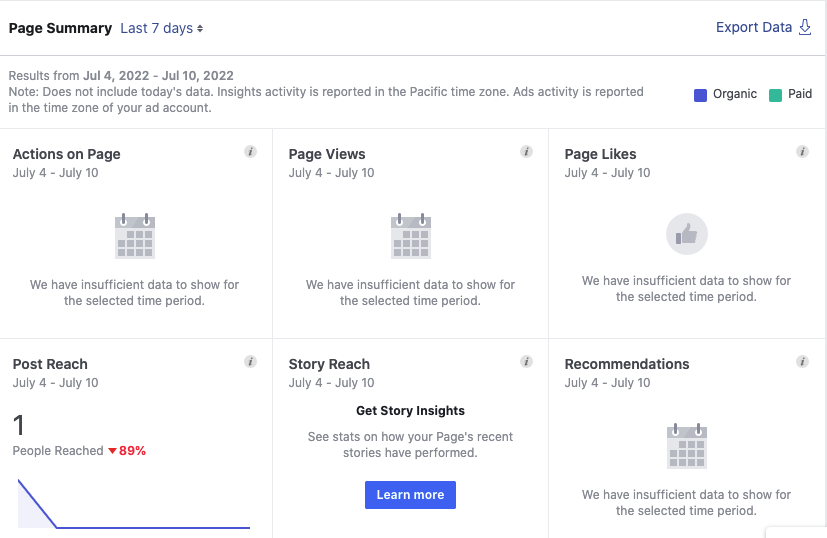
Once you have clicked on “insights,” you will land on the overview page. You will be able to review a page summary on this page, including action on pages, page views, page likes, post reach, story reach, recommendations, post engagement, and more.
Note: you have a limitation; you just can view data from today, yesterday, and the last 28 days. For this reason, we recommend you use a Facebook Insights report tool.
Feel free to explore more options on the sidebar to the left of the page.
Facebook Insights has changed with the platform, bringing more insights and without any doubt is one of the most comprehensive native analytics tools you should master if you work on social media.
What are the benefits of Facebook Insights reporting tools?
As you may have seen, Facebook Insights has a lot of data to review, but the data range is limited, which means you can view just the past 28 days of data. However, a Facebook Insights reporting tool like Porter Metrics can store your data from the past three months.
In addition, you can use a reporting tool to visualize just the KPIs and metrics related to your business. You can create a dashboard report with your video insights, and include metrics such as minutes viewed, 3-Second video views, and top videos.
Simplify your reporting process with a reporting tool and a Facebook Insights connector.
With a reporting tool, you can download your data contained in a CSV, Excel, or spreadsheet, and you don’t need to spend hours in the reporting process.
Reporting tools also let you share your reports easily, so you can copy and paste an URL to share your report with our team or clients. Some analytics platforms like Porter Metrics also offer the option to download reports as PDF files.
How to choose a social media reporting tool?
These are some points you need to take into account to choose the best Facebook insights reporting tool:
- The pricing model: Most Facebook insights reporting tools offer a free trial or a limited number of data points for free. Paid plans typically provide more data points and additional features.
- Ease of use: Is the reporting tool user-friendly? Can you easily create custom reports, or does it require advanced skills?
- Additional features: Do you need access to other social media channels? Does the tool provide data analysis, or are you limited to report creation?
We’ve selected the ten (10) best Facebook insights reporting tools to simplify your reporting process based on these factors.
If you are not sure what is the best tool for you, check this article and discover what is the perfect type of tool according to your marketing needs.
10 Best Facebook Insights reporting tools for marketers and agencies
- Porter Metrics
- Report Garden
- Madgicx
- Swydo
- Whatagraph
- Social bakers
- Dashthis
- Grey Metrics
- Supermetrics
- Databox
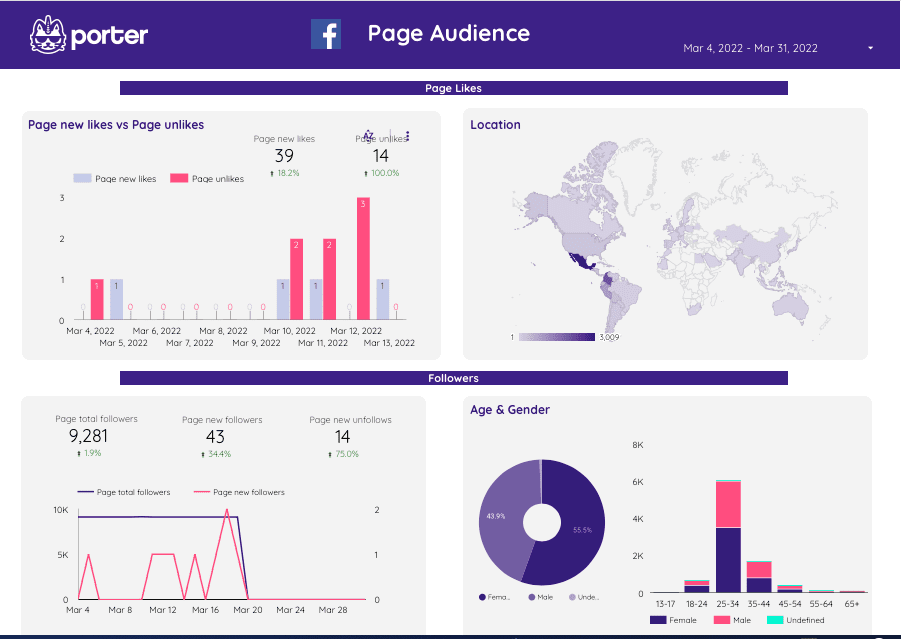
Porter Metrics

Porter Metrics is one of the fastest and no-code way reporting tools that enables you to create your Facebook reports in a nick of time, without experience. You just need to use the Facebook Insights connector and pull your data to one of our free report templates.
With Porter Metrics, you can have the best support, and we can set up your reports for free.
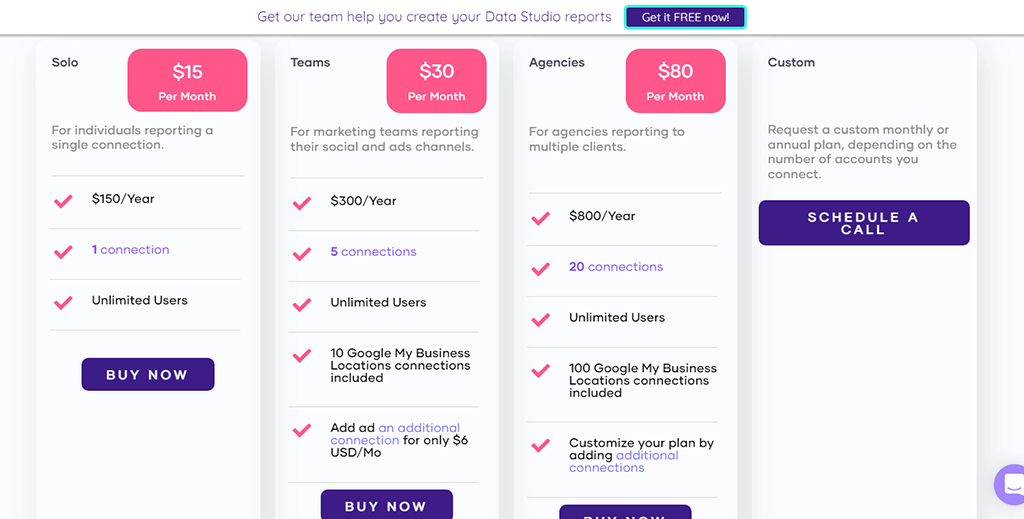
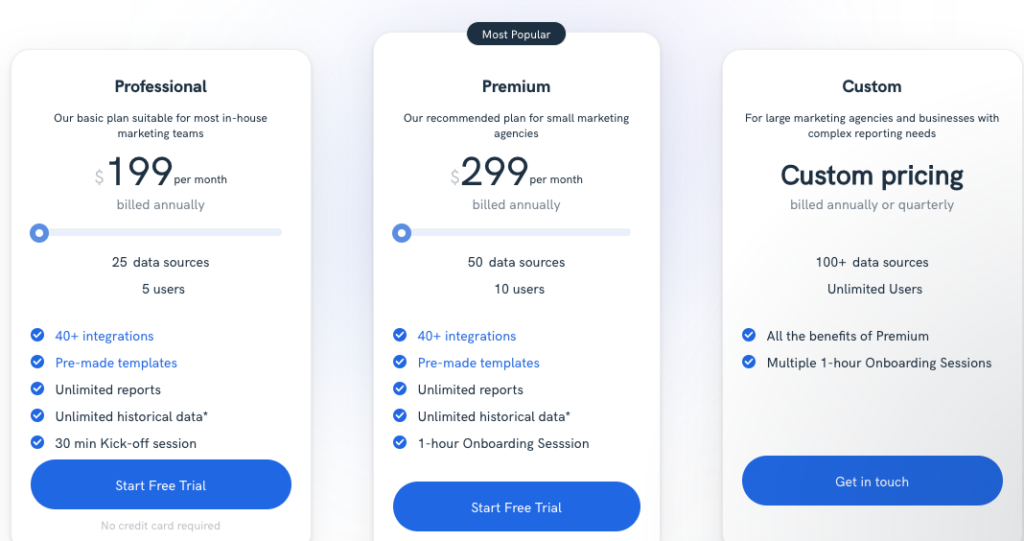
Pricing
You have a 14-day free trial to use Porter Metrics and also different plans that are designed to not only meet but exceed your expectations:
Target Market:
Porter Metrics is perfect for digital marketing agencies, marketers, and small businesses looking for an easy way to build their reports without code or a Google Data Studio specialist.
Pros
- The team at Porter Metrics is always happy to help you set up your reports. The customer support service is definitely a differentiator from other connectors.
- Perfect for users who don’t have experience creating reports
- Works on Google Data Studio
- Leverage the power of Google Data Studio and combine relevant metrics for your business,
- Connectors work perfectly for agencies, consultants, and marketers
- The report templates gallery is the most complete and covers many use cases
Cons
According to users from G2, these are some pros for Porter Metrics.
- Could have more connections available (but our team is working on that, so it should’nt be an issue)
- The current destination is only Google Data Studio.
Porter Metrics, best features:
1. Free report templates
You can use Porter Metrics to access the most comprehensive Facebook Insights report FREE templates gallery, inspired by actual use cases. Whith Porter Metrics you have access to:
- +80 free Data Studio report FREE templates
- 100% customizable reports
- New report templates every week, made by marketers and agencies.
2. White-label templates
Google Data Studio reports (and templates) are 100% customizable, which means you can add your clients or team logo & branding. Possibilities are endless!
3. Data blending
With Porter Metrics, you have the option to create charts using multiple sources (blended data sources) such as Facebook Ads and Google Ads,
4. All your metrics and KPIs in just one place
According to your KPIs, you can add around 120 metrics and dimensions to your report to analyze your Facebook Insights data. You can check the complete Facebook Insights list.
5. Shareable reports
When you create a report with Porter Metrics, you can share it, and these are different ways:
- Choose the Gmail/G Suite users who can access your reports as editors or viewers
- Schedule email deliveries
- Share a link to access the report
- Download a PDF version
- Embedding the dashboard on a website
6. Free tutorials
If you don’t know how to set up your report, you can review Porter’s tutorials.
Join the Facebook SupPorters group.
And subscribe to the YouTube channel to get free and relevant content.
7. Mobile-friendly reports
You can customize your report pages’ height and width to adjust to any device.
8. Unlimited support
Porter Metrics has the best support. You can use our chat for troubleshooting and schedule a call with us to help you to set up your report for free.
Porter Metrics reviews:

Source: G2
Report Garden

Report Garden is a reporting tool that helps teams build customizable reports to measure content success and analyze data related to individual content. By analyzing the posts’ data, teams can see significant trends. You can also use this tool to identify your top-performing so you don’t waste time on underperforming content.
Report Garden pricing
Target market
This Facebook Insights reporting tool is perfect for agencies.
Pros
According to users from TrustRadius, these are some pros for Report Garden:
- Easy-to-use platform layout – everything is clean-cut and simple,
- It is built well for agencies and organizations with multiple users or multiple clients.
- Automated reporting set to schedules with manageable report templates.
Cons
According to users from TrustRadius, these are some cons for Report Garden:
- ReportGarden is sometimes too simplistic and doesn’t allow you to get down into the details as much as you need for more sophisticated clients.
- Sometimes had issues with getting all separate platforms/campaigns to work together in reporting.
- It needs different levels of more sophisticated agencies to buy into higher-level, more detailed reporting tools.
Report Garden’s best features
1. Essential Audience Insights
ReportGarden lets you see which posts customers engage with (or don’t engage with) to make informed decisions about what you post.
2. Facebook Insights Report Templates
Instead of creating custom reports for each of your clients, simply select a template from the wide range of custom-built templates provided by ReportGarden.
3. Posts overview
ReportGarden lets you present Facebook Insights data related to the posts you create, how many people your posts reach and how they respond, knowing what type of posts work on engage the best with your audience.
4. Specific demographic metrics
ReportGarden lets you visualize your fans’ demographic information and the people reached and engaged by your page’s content. This data can help you determine if you are reaching correctly your target audience.
Report Garden reviews

Source: Capterra

Source: Capterra
Madgicx

Madgicx is a Facebook insights tool that lets you examine each of your target audiences separately, according to your key metrics.
Madgicx pricing
Ad-spend based pricing that fits every advertiser:

Target market
This Facebook Insights reporting tool is perfect for agencies.
Pros
According to users from Quicksprout, these are some pros for Madgicx:
- Intuitive mobile app
- Quick time to value
- Many customizable features
Cons
According to users from Quicksprout, these are some cons for Madgicx:
- Difficult to set up
- Steeper learning curve
Madgicx best features
1. Audience Insights:
It will illustrate your audience’s performance in real-time and in each funnel stage, making the information easy to comprehend.
2. Filter results by audience segments:
Obtain actionable insights such as identifying scalable creatives, discovering additional ad formats you can include in your strategy, and tailoring content to audience segments according to funnel stage, demographics, and other categories.
Madgicx reviews

Source: G2

Source: softwareadvice
Swydo

Swydo enables you to make Facebook Insights reports in just a few minutes. You can also use this tool to connect different data sources such as Facebook Ads, Google Ads, and more. You can visit Swydo.com to check all the data sources and integrations available.
According to Swydo, this platform works in just 4 steps:
- Select a template.
- Connect your source.
- Customize the template.
- Share your report.
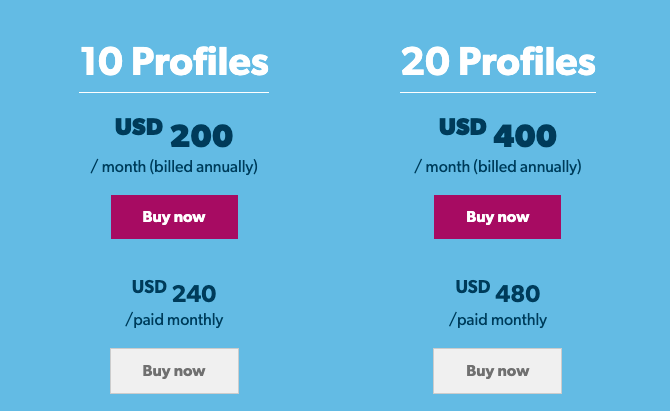
Swydo pricing
The basic plan starts at $39 and includes 10 data sources.

Target market
This Facebook Insights reporting tool is perfect for online marketers.
Pros
According to users from Get App, these are some pros for Swydo:
- Customizable reporting templates
- Provides outstanding customer support
- Swydo is constantly updating its platform and providing new functionality
Cons
According to users from Get App and Trust Radius, these are some cons for Swydo:
- It doesn’t have multi-channel formulas to add into one metric.
- Design options, and visualizations are limited.
- The interface has a bit of a learning curve.
Swydo best features:
1. Pre-built templates:
Swydo’s ready-made templates help speed up the report creation process so you can get to what matters – analyzing the data and providing your clients with the insights they need.
2. KPIs and goals
Reach, actions, shares, conversions – you can set target goals for relevant KPIs with a simple click and monitor the results to make informed decisions and changes in strategy as needed.
3. Branded reports:
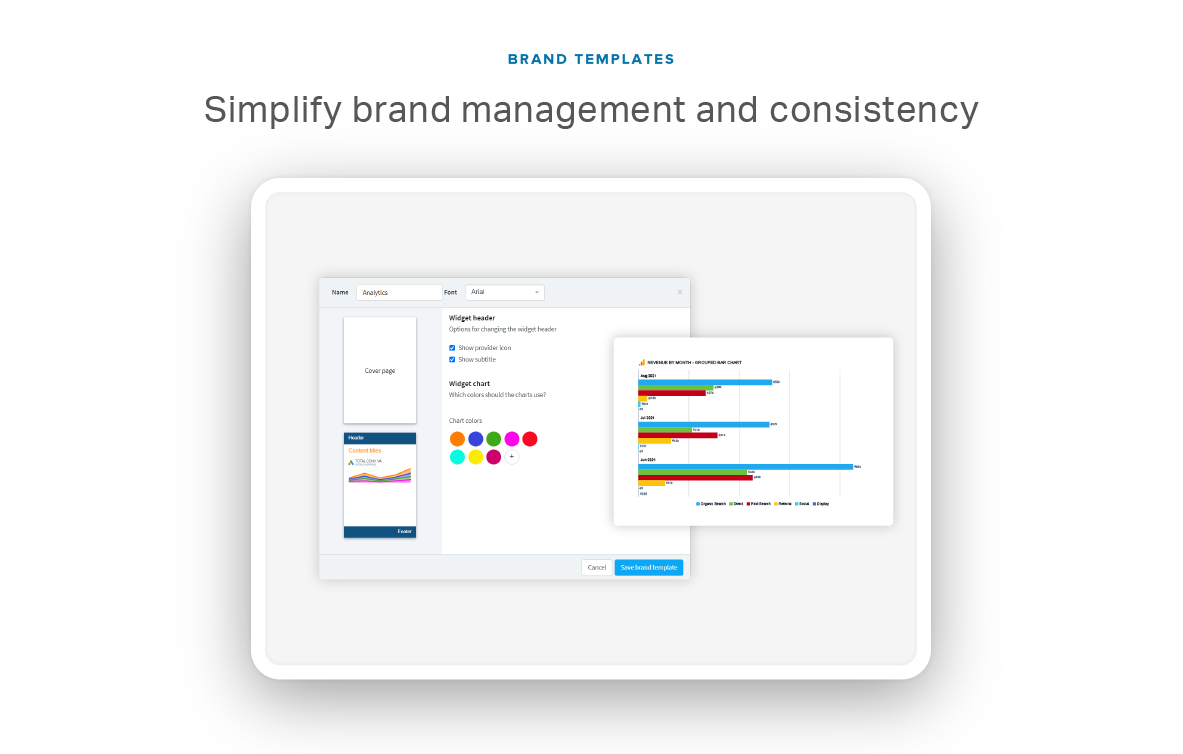
Brand your reports using brand templates that let you upload a cover page, logo, control colors, fonts, and other report elements.

Visit Swydo.com to see all the features in detail.
Swydo reviews:
Source: Get App
Whatagraph
You can use this reporting tool to create great Facebook reports in minutes. This tool enables you to quickly visualize your audience growth, interactions, engagement metrics, and more.
Whatagraph pricing
Target market
Whatagraph will work perfectly for agencies.
Pros
According to users from Capterra and G2, these are some pros for Whatagraph :
- The user interface is easy to navigate
- Creates clean dynamic reports quickly and easily
- Drag and drop model
Cons
According to users from Capterra and G2, these are some cons for Whatagraph :
- Price. Whatagraph will be too expensive.
- There isn’t much customization in the layouts of reports.
- The number of connections is limited.
Whatagraph best features:
1. All key metrics and KPIs on one page:
Connect your account to Whatagraph, and you’ll never have to check your Facebook KPIs separately. Whatagraph automatically pulls up-to-date reach, impressions, cost-per-click, ROI, and other performance metrics.
2. Delivered reports:
Keep clients in the loop with report automation and scheduling.
3. Cross-channel reports:
Compare your Facebook performance with other marketing channels to see the full picture.
Visit Whatagraph.com to check all the features in detail.
Whatagraph reviews:

Source G2.com

Source G2.com
Social Bakers (Now Emplifi)
Social Bakers is a unified social media marketing platform that can help you plan and research, create and analyze your content and track your KPIs and metrics. You can easily use this tool as your social media analytics to track your Facebook Insights.
Socialbakers pricing:
The basic plan starts at $20. However, you can request a personalized demo to find a plan according to your business.
Target market
SocialBakers is perfect for marketers and agencies.
Pros
According to users from TrustRadius, these are some pros for Social Bakers:
- Combining different social pages in one view > no need to switch across pages for performance monitoring
- Socialbakers is generally easy to use, and the export option is truly helpful for users.
Cons
According to users from TrustRadius, these are some cons for Social Bakers:
- They need better customer service.
- Missing the ability to compare performance from a different duration
- Ability to ingest revenue data from social business managers to give a more holistic view
Socialbakers best features
1. You have a Facebook page performance report
This report can help you to analyze and compare Facebook pages for free. You just need to add the URL of your Facebook Page and that of your competitors to see how you performed on Facebook in the last 90 days
2. Research and planning
“Socialbakers” (Emplifi) makes easy to create and execute the perfect social media marketing strategy, from content planning to audience analytics to precision budgeting.
3. Content strategy
Boost content engagement across channels. You can know what content your audiences love and what content works for your competitors.
4. Measurement and reporting
Make it clear and straightforward. See the attribution of all your efforts.
Visit Socialbaker.com to know more details about the platform.
PS. Personally I do love this tool, when you run a ginormous amount of accounts and you need to deliver multiple reports to editorial teams, this tool worth it. Its customer support is great and you hace a dedicated account manager that will provide a great onboarding experience.
If you work for an agency or a large corporation this tool will change the reporting process. But please take into consideration that the budget is a thing you have to consider.
Socialbakers reviews:

Source: G2
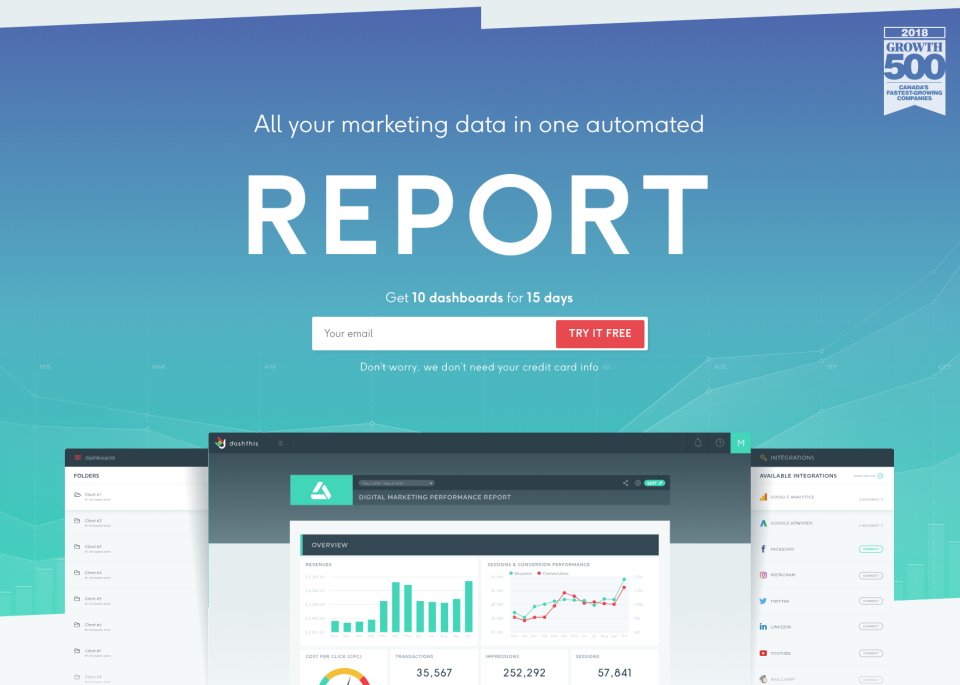
Dashthis

DashThis is a great marketing reporting tool that focuses on custom dashboards in different parts of Digital Marketing. In other words, it is a reporting software for everyone that wants to automate the reporting process.
Instead of creating a new dashboard report from scratch, you may utilize their pre-designed marketing templates. Simply pick your favorite template, choose a time for the report (monthly, quarterly, etc.), connect your data, and start visualizing.
DashThis pricing
DashThis has four pricing plans. You can pay monthly or annually, depending on your preferences.
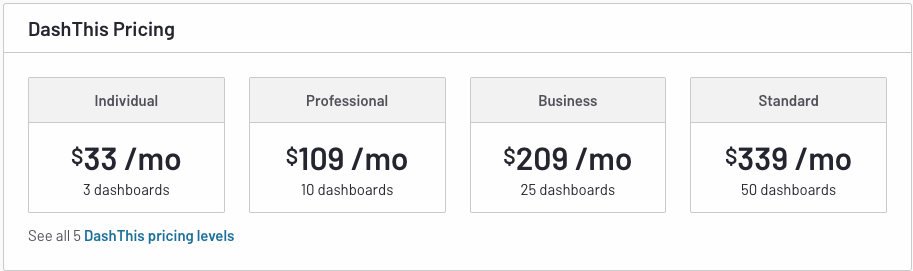
Get to know more about DashThis pricing plans and compare.
Target Market
DashThis is preferred for digital marketing agencies.
Pros
Most of the users emphasize the fact that DashThis is easy to use and integrate your data. Also, it is fast, and the customer support is excellent.
Cons
One of the most significant cons of DashThis is its price and limitations in the pricing plans. Also, sometimes some bugs occur in the interface. Some users also mentioned that the lack of dynamic charts and graphs is another point that should be fixed.
DashThisbest features
1. Custom Reports in DashThis
DashThis, enables you to customize your dashboards and reports and filter out the data you do not want. With a key metric dashboard, you have more freedom and can add your logo and upload your data that does not exist in any of your channels.
2. Drag-and-drop model:
You can drag and drop your widgets onto your dashboard to create a clean report layout that includes all the information you need.
3. Widgets and common KPIs:
You can use DashThis to include widgets with the most common KPIs such as fans count, page impressions, top posts, engagement rate.
Learn how to create a Facebook Insights dashboard with DashThis.
Reviews
These are some reviews from Capterra and G2 about DashThis
Source: Capterra

Source: G2
GreyMetrics
GreyMetrics is a great reporting tool to create reports and customize them. According to G2.com, Grey Metrics integrates with over 20 platforms and has dozens of built-in templates, so your reports look great from day one and are fully white-labeled to share with clients and stakeholders.
GreyMetrics Pricing
Target market
GreyMetrics will be perfect for digital marketing agencies.
Pros
- It has a good selection of templates.
- Automated scheduling of report submission.
- Team members and client portal.
- The tool was designed and built for agencies.
Cons
- Missing some key indicators for reports
- Limited number of accounts
GreyMetrics best features
1. Multi-Client dashboards
You can create a dashboard connecting different data sources from other clients.

2. Report templates gallery
GreyMetrics also have predefined report templates which you can use to save time.

3. Scheduled reports
You can automate the reporting process by scheduling reports to run itself daily, weekly, or monthly and automatically email the report to the clients.

4. Clients portal
You can add all your clients in the clients portal, which is helpful for agencies. You can use this portal to view multiple clients and connect their sources.

GreyMetrics reviews:

In conclusion, GreyMetrics will help you run agency reporting and look for an analytics tool to manage your data integration effectively. This tool will help your agency create dashboards and reports to share with clients.
Supermetrics

Supermetrics is a popular reporting tool that can help you to move Facebook Insights data to any destination, such as Google Data Studio. Supermetrics also offers more than 70 data sources for Google Data Studio that can be set up in a few clicks, including e-commerce, social media, SEO, advertising, web, product, and mobile analytics.
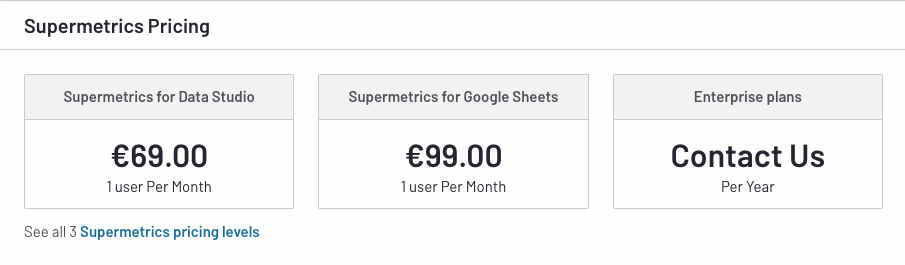
Supermetrics pricing
According to their pricing page, Supermetrics for Google Data Studio prices starts at $69/mo if paid annually.
Target market
Supermetrics will be perfect for marketers, data analysts, and data engineers.
Pros
- Easy to integrate with Google Data Studio.
- A huge set of integration partners.
- Supermetrics is great at integrating with Excel or Google Sheets to adapt the reports to your needs
Cons
- Supermetrics is fairly more expensive than other tools.
- Supermetrics is sometimes a bit too complicated to figure out, and requires time to learn
Supermetrics best features
1. Multi-page reporting
You can combine data from multiple pages in the same report and use filters, segments, sorting, and date ranges.
2. Access all your Facebook Insights data
Get access to all the Facebook Insights metrics and dimensions you need, including post, video, engagement statistics, etc.
3. Aggregate data from multiple sources
Combine data from all your advertising and marketing platforms to create cross-channel reports.
PS. We personally like what Supermetrics has built. In a sort of way, they are super! Superteam, super powerful, super big. They are pioneers and you will find lots of recommendations around this product. We also have an unbiased review of this product.
Databox

Databox is an online popular marketing reporting tool that enables you to collect all your data in one place and deliver significant KPIs in your business. Databox is a business analytics KPI tool. You can also use this tool to create a Facebook Pages Insights report by using a databox template.
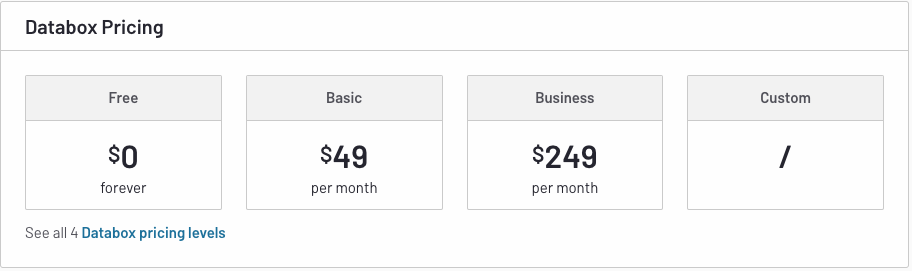
Databox pricing
Target market
Databox will be perfect for marketers and agencies. .
Pros
When you look at different reviews, you can see that people mention all kinds of pros in their opinions. Customizable controls, great and easy-to-use mobile app, flexible data management, fantastic user interface, and various data visualization options.
Cons
Suppose you take a look at the cons. In that case, you see that people mention the time to set up the tool, lacking customizable dates, limitations for historical data for different channels, and having inaccurate or not up-to-date data from time to time.
Databox best features
1. Stream Dashboards on Your Smart TV:
You can visit tv.databox.com to receive a short 4-digit code and connect your dashboards to your TV. In this way, you can make performance more accessible to your team by making it more visible.
2. Pre-built templates:
Databox has different customizable templates to visualize your performance in minutes. You can find marketing, sales, financial templates, and more.
3. Report Sharing with Databox:
You can easily use Databox to create a shareable link and send them over to the people you want.
You can visit Databox to explore the top 10 Databox features.
Databox reviews:

Source: G2

Source: Capterra

