


Chiefmartech says there are over 200 marketing analytics solutions, and most also offer marketing reporting automation and data management features, so finding actual the best marketing reporting tool is tough.
I’ll share my perspective as a marketing analytics tech founder. I dive deep into all reporting tools, considering their features and limitations, which only become clear after you use them.
I created a framework to help you evaluate and choose a Supermetrics alternative.
With it, we evaluate:
Features – understand integrations, storage, transformation.
Solutions – understand how different software categories solve reporting automation.
Business – asses your business size or type.
Pricing – asses the reporting tool’s pricing, considering level of service, documentation, compliance, reputation..
Features
A marketing data pipeline is the process of data extraction, data aggregation, data normalization, transformation, and visualization to let digital marketers and data analysts create custom marketing dashboards to enable data-driven decisions and optimize online marketing campaigns and the overall marketing strategy.
When choosing a marketing reporting automation tool, we’ll compare integrations, data transformation, and data visualization features to find differentiated benefits or downsides.
Integrations
Here’s the catch: I wouldn’t necessarily stress that a higher number of data sources and destinations automatically offer more value to customers. While having more data sources can automate more reports, many data sources might be a “vanity metric” if the quality of those integrations is overlooked. When assessing the quality of data integrations, consider these criteria:
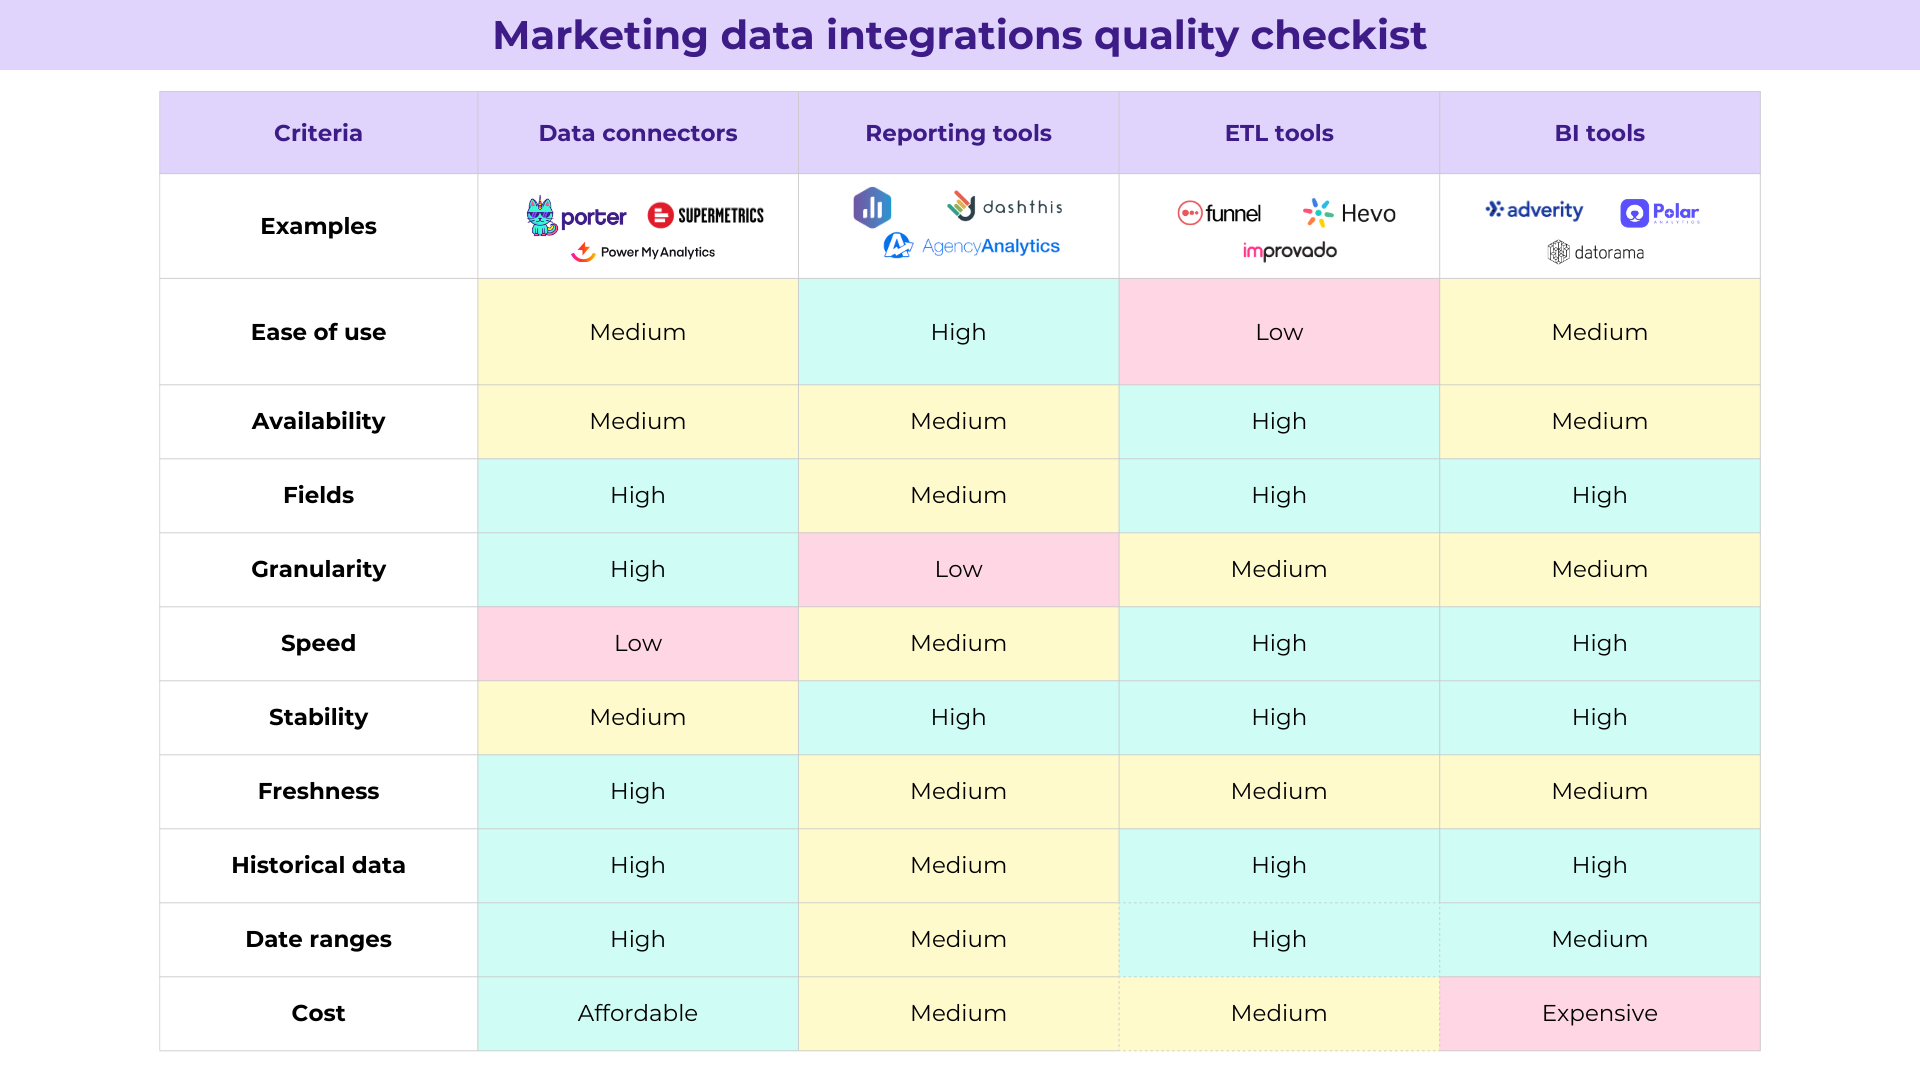
Marketing data integrations quality checklist
Ease of use: determined by how fast and technical it is to connect data and set up dashboards.
Availability: verify you can collect data from multiple data sources.
Speed: all marketing reporting automation tools may face slow reporting as speed is dependent of multiple variables, many of which are not dependent on the provider such as API availability, destination, cloud processing, browser, and internet speed. However, some providers may offer better contingencies such as data storage, backfills, cache, and “real-time” access to API data.
Fields: all metrics and dimensions from the tools API are available in the integrations.
Granularity: refers to the ability to freely combine multiple metrics and dimensions in a single query.
Stability: Occasionally, APIs and visualisations might present downtimes due to permissions desauthorization, API availability, and infrastructure. Contingencies include disconnection alerts and storage.
Accuracy: double-check that your report’s data matches the source. While APIs might present import data differently, it is more common for the provider to present issues with non-tested queries and storage.
Freshness: refers to access to the latest data. Some tools may backfill data every few hours, 12 hours, daily, or weekly. However, such freshness is also dependent on APIs. Some providers claim to refresh every 15 minutes or hourly, when most APIs may update every few minutes or hours, making such refreshes irrelevant.
Historical data: Most APIs grant access to all the historical data with a few exceptions like Social Media. Verify your provider can request months or years of historical data.
Date ranges: check if you can pull data from any dynamic or fixed date range (e.g. last 7 days, 8 October 2024, respectively).
Data transformation
Data transformation refers to the features to clean and edit the data to solve more complex use cases such as cross-channel marketing reporting at client, brand, or UTM level, goal tracking, agency markup and commission calculation, and marketing bottom-line analysis.
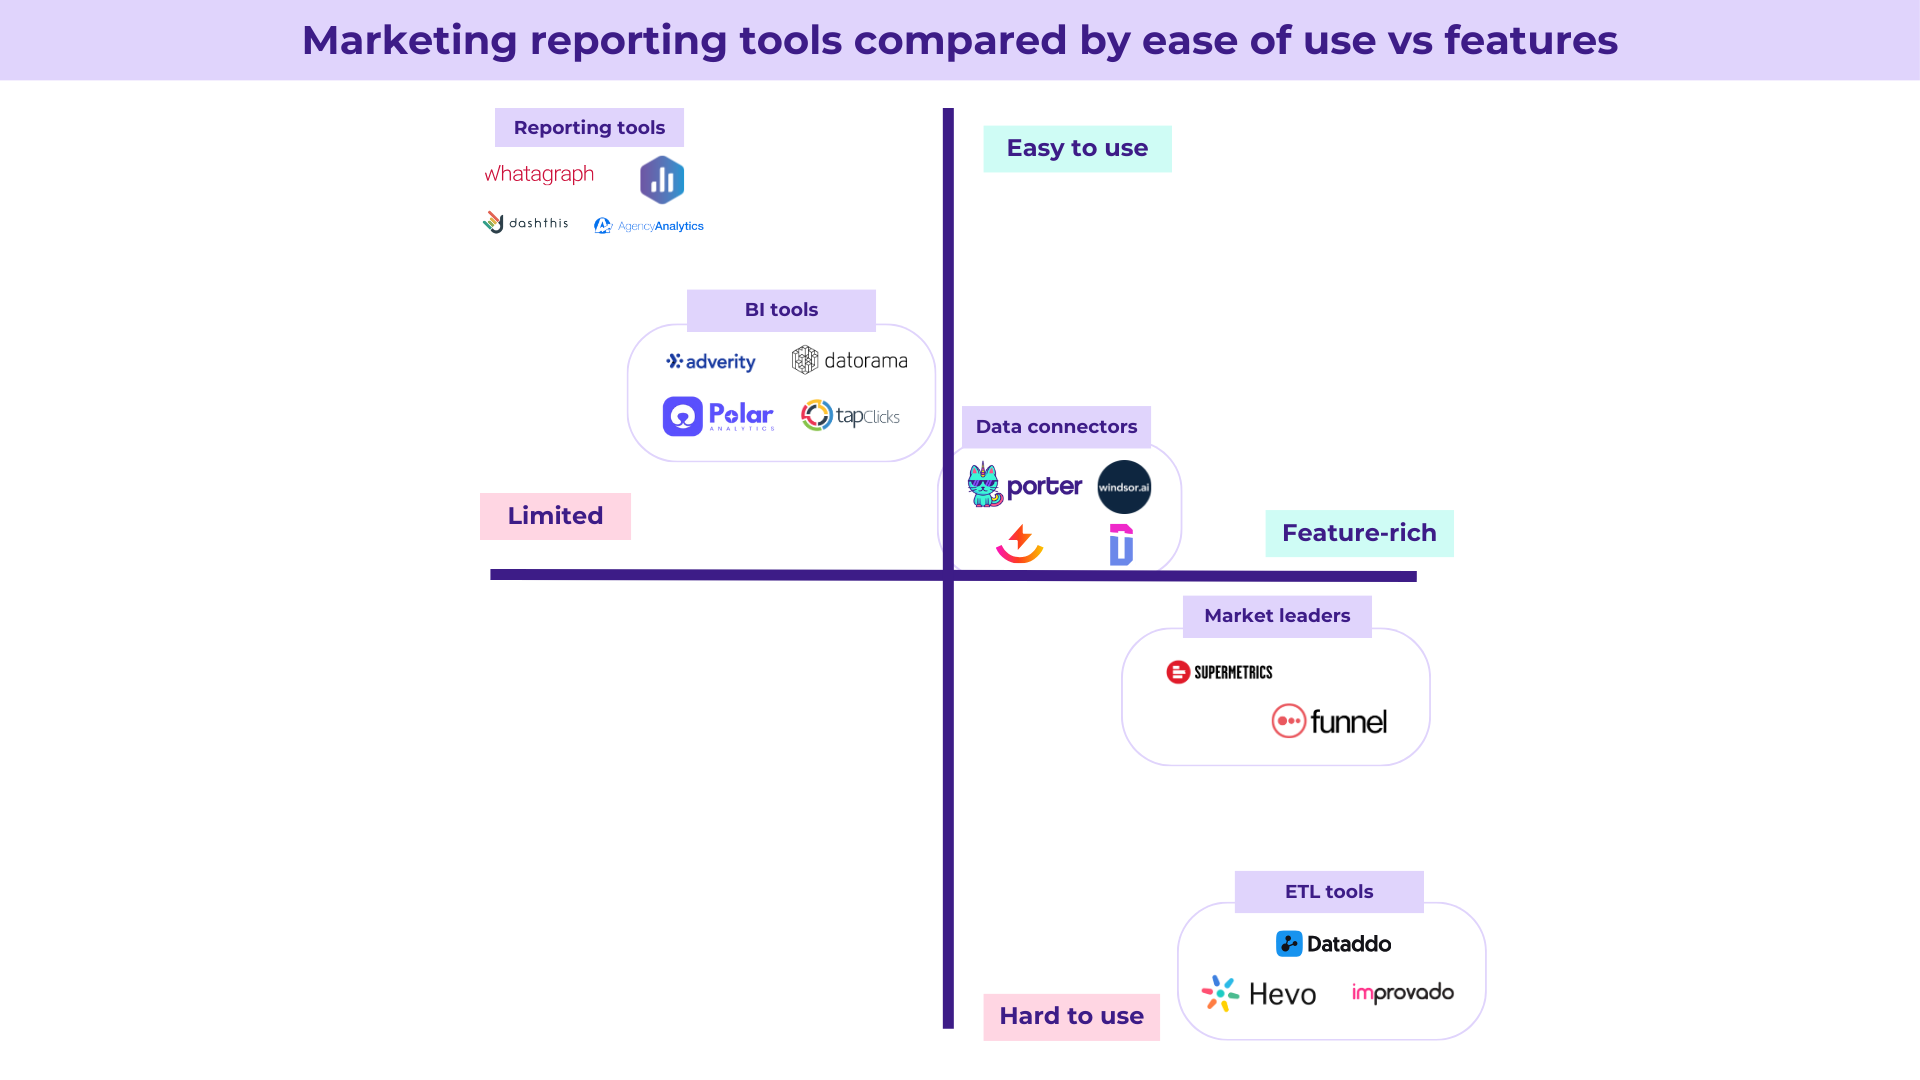
Marketing reporting tools compared by ease of use and features
Data normalization: refers to standardizing equivalent fields across various marketing channels (aka data mapping) even though the raw data has different formats or values, such as dates, country, city, demographics, and UTM parameters, allowing tailored cross channel reports without losing granularity.
Data blending: refers to combining multiple data sources in a single table by matching normalized data.
Filters: using conditionals to include or exclude data. While generally available in most data visualization platforms, certain providers offer built-in filtering for more complex data rules.
Custom metrics: math formulas to calculate CPAs, CPC, CPL, and other custom marketing metrics.
Custom dimensions: building custom segments based on rules applied to text data such as extracting the brand name from a campaign name to create a custom dimension called “Brand”, previously unavailable by the raw data.
Rule-based custom values: allowing to modification of the values of data based on certain rules, enabling currency conversions, and agency markup calculation.
Destinations
When it comes to reporting and visualization (and automation) marketing teams have 4 options:
Vertical reporting tools: to create custom dashboards for specific use cases (e.g. client reporting); easier to use but limited as options are narrowed.
Spreadsheets: importing the marketing data to Sheets (via Google Appscript) to let digital marketers or data analysts freely edit and combine with other data, or even connect with other services like ChatGPT, Zapier, Slides, or Canva.
Data visualization platforms: better for visual, interactive dashboards, Google Looker Studio is the preferred option for marketing teams in SMBs, agencies or startups, while Business Intelligence tools like Power BI and Tableau are for mid-market, enterprise, and established companies.
Data warehouses: used by data teams to integrate all business data sources in a single place.
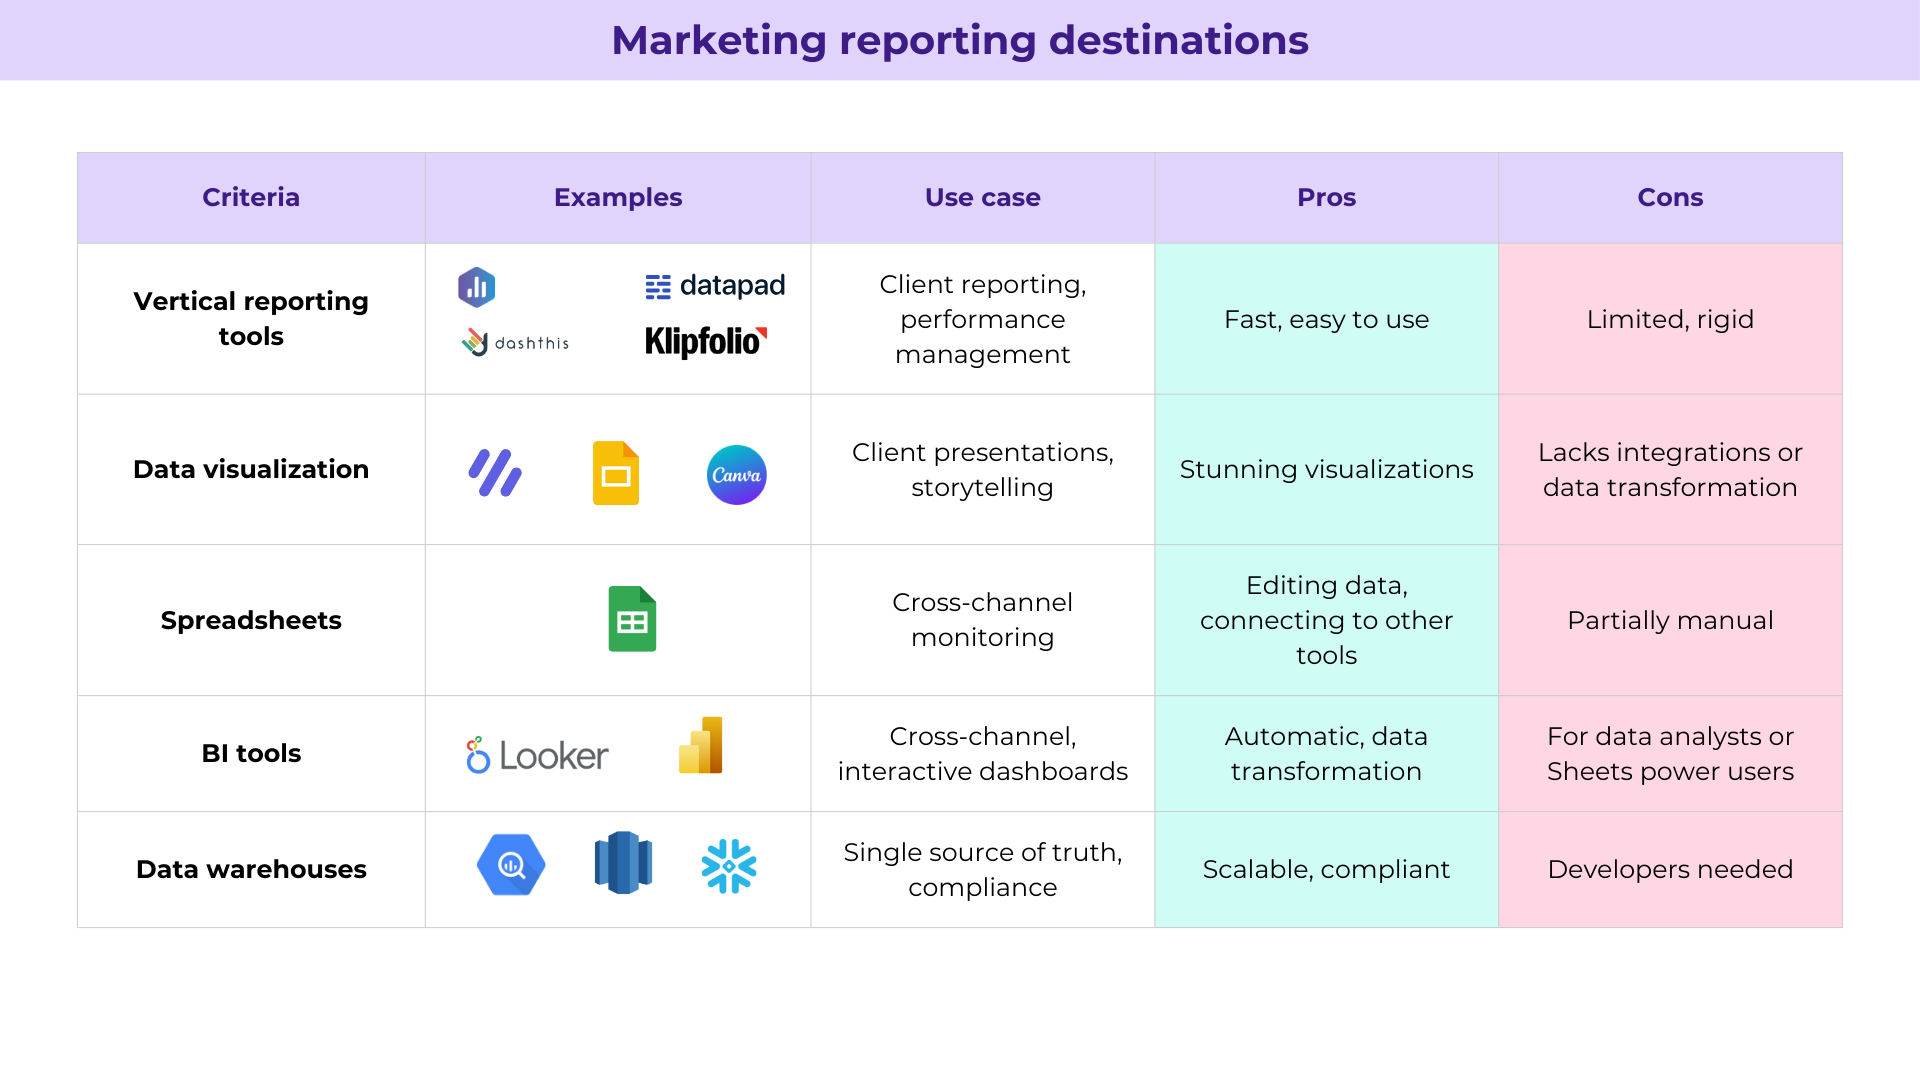
Marketing reporting destinations comparison table
Solution types
Different categories of Marketing analytics software solutions address Marketing reporting needs, varying in features, pricing, users, complexity, and use cases:
Built-in analytics: Default, native dashboards and reports provided by your sales, marketing, and automation tools.
Data connectors: Tools that import marketing data into spreadsheets or reporting tools like Google Looker Studio.
Data visualization tools: Solutions focused on creating visual, easy-to-build dashboards but lack integrations and data transformation.
Vertical reporting tools: Simple integrations and reporting specific use cases, such as client reporting, but may lack data transformation and flexibility.
Tracking solutions: Tools that use JavaScript to track website, app, or product events, providing clean user-level conversion, attribution, or UTM acquisition and behavior data.
Business intelligence platforms: All-in-one solutions that manage the entire data process, from integrations and storage to transformation and visualization.
ETL solutions: Tools that allow data analysts and engineers to pull data from integrations and endpoints into data warehouses or spreadsheets for further analysis.
Attribution software: Platforms that use scripts, user-level tracking, multi-touch attribution, or machine learning to perform lift analysis and marketing mix modelling.
Marketing analytics software categories comparison
Pricing
We’ve compiled their listed monthly plans, but remember, pricing models differ. For example, Porter Metrics bills per connected account, while others bill per data source or client. Most offer trials and some have freemium plans.
| Provider | Starting Price | Mid Plan | Highest Price | Average Price | Pricing Unit | Service Type | Free Plans |
|---|---|---|---|---|---|---|---|
| Porter Metrics | $15 | $40 | $180 | $78 | Accounts | Self-Service | 14-day free trial |
| Supermetrics | $37 | $299 | $724 | $370 | Data Sources | Self-Service | 14-day free trial |
| Funnel | $120 | $1,100 | $2,500 | $1,240 | Flexpoints | Self-Service | Freemium |
| Windsor AI | $23 | $118 | $598 | $246 | Data Sources | Self-Service | Freemium |
| Power My Analytics | $15 | $40 | $295 | $117 | Data Sources | Self-Service | 14-day free trial |
| Dataslayer | $35 | $76 | $383 | $165 | API Calls | Self-Service | Freemium |
| AgencyAnalytics | $60 | $180 | $900 | $380 | Client Campaigns | Self-Service | 14-day free trial |
| Polar Analytics | $300 | $450 | $450 | $400 | Orders | Sales Call | No |
| Databox | $47 | $135 | $799 | $327 | Data Source Connections | Self-Service | Freemium |
| Whatagraph | $219 | $499 | $899 | $539 | Source Credits | Sales Call | 7-day free trial |
Generally, the cost of marketing data connectors falls between $15/mo and $200/mo, whereas reporting or ETL tools are priced from $300/mo to $2,000/mo.
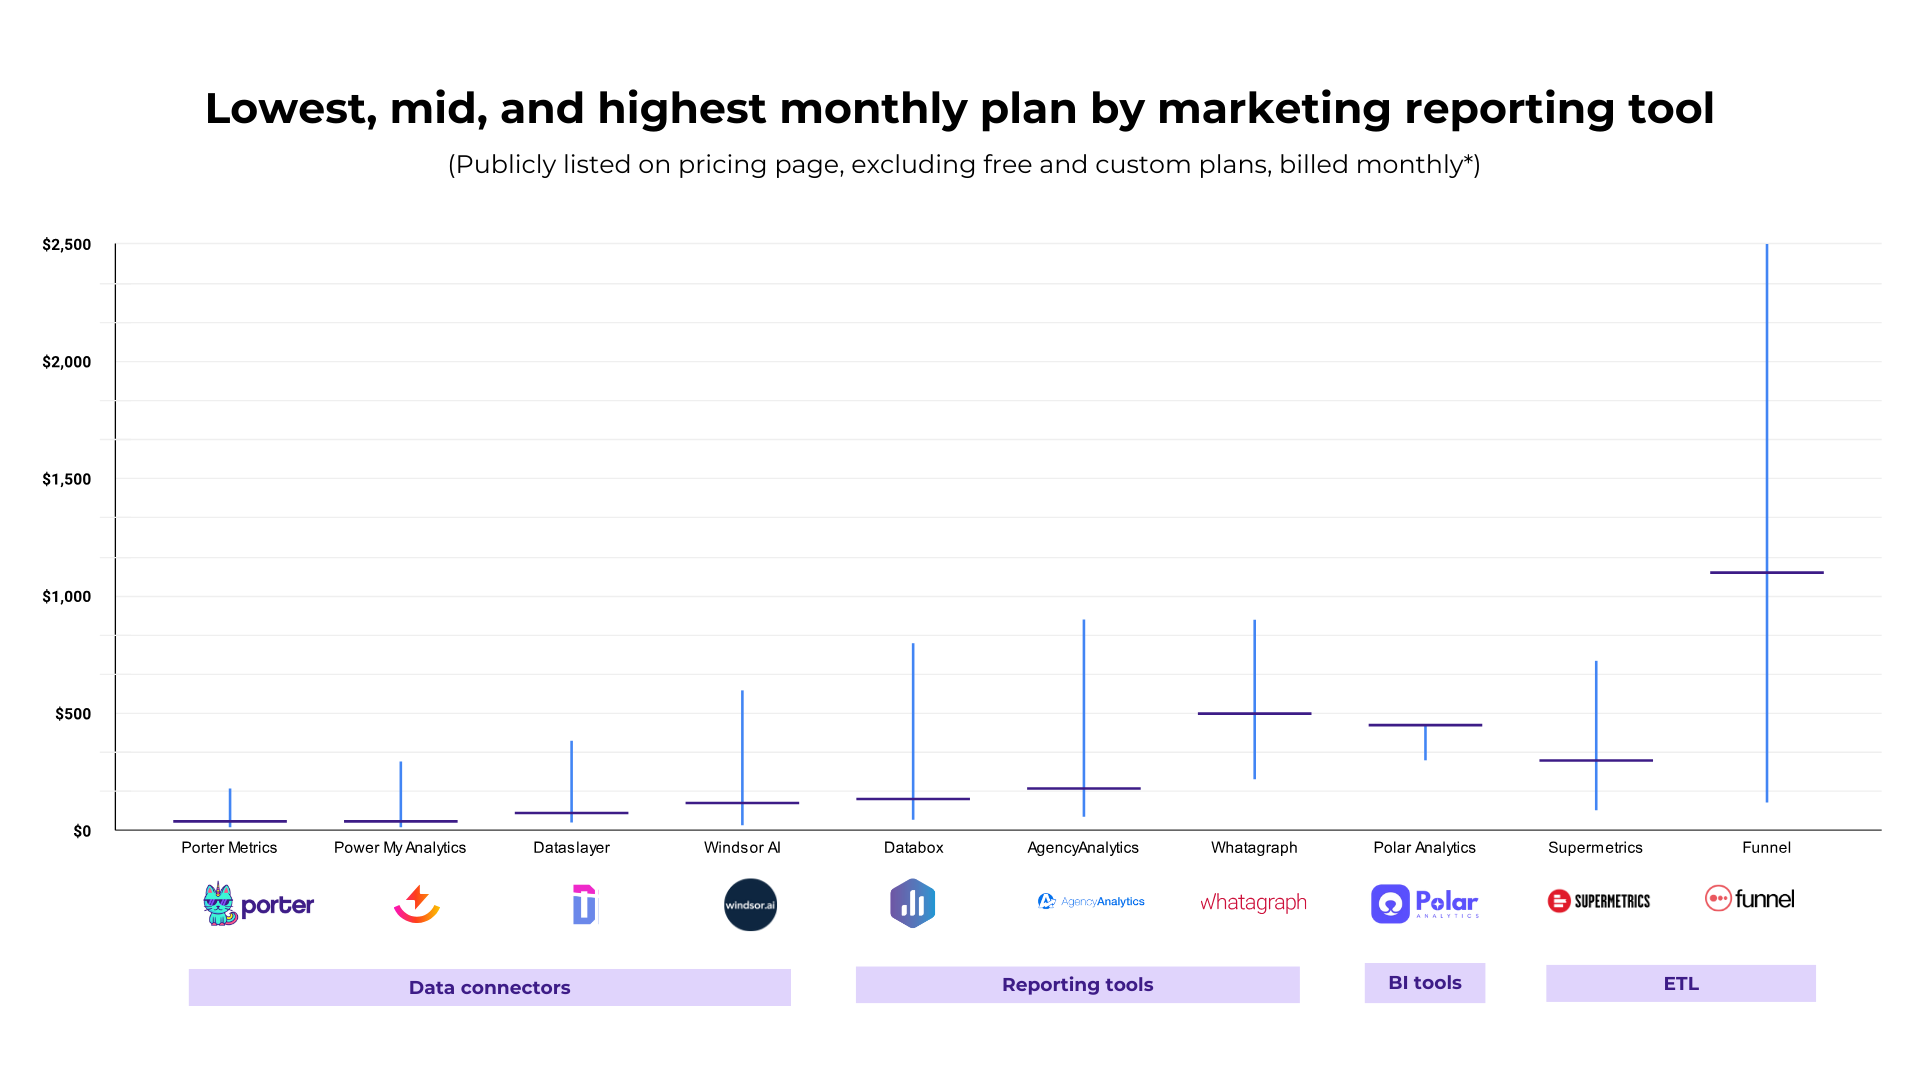
Marketing reporting software pricing comparison by lowest, mid, and highest paid monthly plans
Consider these aspects to compare pricing:
Compliance and Security: Pay attention to crucial certifications like SOC 2 Type 2 and features like SSO sign-in.
Service Type: Tools that involve sales or onboarding calls tend to be costlier (about $300/mo), while self-service tools are usually more affordable.
Documentation and Resources: Having access to tutorials, templates, and comprehensive documentation can optimize your workflow.
Support and Training: Assess the availability of support, communication channels (chat, email, phone), and the provision of custom training and reporting services.
Segment: SMBs often prioritize quick setup, ease of use, and flexible, affordable pricing, while enterprises value compliance and security features.
Comparison of marketing reporting tools alternatives
In a nutshell, here are the top marketing reporting tools alternatives compared by features, pricing, billing, reviews, pros, and cons.
Porter Metrics | Supermetrics | Funnel | Windsor AI | Power My Analytics | Dataslayer | AgencyAnalytics | Polar Analytics | |
|---|---|---|---|---|---|---|---|---|
| Highlight | No-code, simplicity, templates & tutorials | Market leader, extensive integrations | Data transformation & warehousing | Automatic data unification, responsive support | Ease of use, granularity, support | Integrations, live chat support | Purpose-built for agencies | All-in-one solution, customer support |
| Top features | Direct integration with Looker Studio & Google Sheets, BigQuery storage, 100+ templates & tutorials | 200+ marketing/sales integrations | 500+ integrations, powerful data transformation, built-in data warehouse | 300+ integrations, no-code options, automatic metric unification & blending | Granular data, cloud storage for reliability | Programmatic ad platforms, databases, exceptional support | SEO monitoring, client communication tools | No-code, AI insights |
| Industries | E-commerce, B2B | E-commerce, B2B, Media, data teams | Data teams | Marketers, developers | PPC & e-commerce marketers | Agencies, developers | Marketing agencies | DTC e-commerce |
| Business size | SMBs | SMBs, mid-market, enterprise | Mid-market, enterprise | SMBs, mid-market | ||||
| Destinations | 2 | 16 | 20+ | 13 | 8 | 4 | 2 | |
| Data storage | Yes | Add-on | Yes | Yes | Yes | Yes | Yes | Yes |
| G2 score | 4,5 | 4.5 | 4,5 | 4,8 | 4,4 | 4,8 | 4,7 | 5 |
| Reviews (April 2024) | 50 | 725 | 137 | 48 | 74 | 184 | 289 | 5 |
| Ease of setup (G2) | 8.2 | 8.7 | 8,9 | 9 | 9.3 | |||
| Ease of use (G2) | 8.2 | 8.5 | 8,4 | 9,1 | 9.4 | |||
| Quality of support (G2) | 7.8 | 9.2 | 9,9 | 9,4 | 9.6 | |||
| Starting price | 14,99/mo | 37/mo | 1100/mo | 23/mo | 14,9/mo | 35/mo | 60/mo | 300/mo |
| Pricing model | Based on # of accounts connected | Based on data sources, user seats, destinations | Usage-based “”Flexpoints””” | Based on usage | Based on usage | Usage-based | Per-client campaign pricing | Based on order volume |
| Free plan type | 14-day free trial | 14-day free trial | Unlimited free plan of 350 flexpoints that let users connect around 2-3 integrations to about 1-2 destinations like Google Looker Studio or Sheets. This might vary for the integrations type, and the free plan limits can be surpassed quickly. | Free plan that includes 1 data source, 1 destination such as visualization tools or spreadsheets. | 14-day free trial | 14-day free trial | 14-day free trial | Sales call needed |
| Billing | Monthly and annual (2 months off) | Monthly, quarterly (10% off), annual (20% off) | montlhly plans but all of them are listed with annual billing | Monthly Annual (2 months off) | Monthly and annual (17% off) | Monthly and annual (17% off) | Monthly | Monthly and annual |
| Pricing policies | Refunds within 14 days after purchase | “””Reserve the right”” to increase their fees 8% annually, and don’t address refunds. | All plans include a 30-day free trial with no credit card needed. They also offer visualization integrations with various platforms like Looker Studio, Microsoft PowerBI, Tableau, Google Sheets, Excel, BigQuery, Snowflake, AWS S3, and others. | Refunds are available after 14 days of purchasing a monthly plan and 30 days of annual plans | ||||
| User management | Unlimited users | Additional user price is equivalent to the license plan. If you’re buying an Essential plan for $87/mo, for two users you’d be paying $174/mo | Starter plan lets you add 5 users (from 1000/mo, billed annually). All additional plans come with unlimited users. | All paid plans include unlimited users | Single and Business plans include 1 and 2 users, respectively. Additional users are $5/mo. Further plans offer unlimited users. | According to the plans, agencies can add staff members and clients as users. AgencyAnalytics is the only reporting tool in our review with messaging and task management features. | ||
| Drawbacks | Limited integrations compared to competitors | Complex pricing, slow/unstable data without paid storage | High learning curve, expensive pricing | Some technical skills required | Limited transformation options | Unpredictable pricing for high volumes | Limited data flexibility vs. ETL tools | Less flexible than modular tools |
| Integrations | ||||||||
| Number of integrations | 18 | 200+ | 500 | 200+ | 42 | 45+ | 80 | 45 |
| Ease of use | Medium | Medium | Hard | Medium | Medium | Medium | Easy | Easy |
| Solution type | Data connector | Data connector, ETL | ETL | Data connector, ETL | Data connector | Data connector | Reporting tool | Business Ingelligence tool |
The fastest way of testing a marketing reporting tool: templates
Most out-of-the-box marketing reporting tools allow you to test them before buying them; the fastest way is using their marketing templates.
Porter Metrics marketing templates
At Porter Metrics we have one of the biggest marketing templates gallery, you can copy them for free and test our connectors:
- Marketing templates
- Paid Media (PPC) templates
- Social Media templates
- Ecommerce templates
- B2B and lead generation templates
- SEO templates
Other marketing template galleries:
Overview of popular marketing reporting tools and software to consider
Portermetrics for medium-sized marketing teams and agencies.
Funnel.io for teams that need ETL and data transformation capabilities.
Windsor AI if you are looking for a marketing attribution solution.
Power My Analytics data warehouse and data connectors.
DataSlayer for affordable and lower usage reporting due to API limits
Agency Analytics for marketing agencies needing robust client management.
Polar Analytics for ecommerce teams that want a specialized solution.
Conclusion
In a nutshell, finding the requires taking a close look at the features, solutions, what your biz needs, and the price tag. Keep an eye on the quality of data integration, transformation options, and destinations for visualization and automation. Each type of marketing analytics tool has its own pros and cons.
When it comes to pricing, don’t just focus on the numbers. Consider compliance, security, service type, documentation, and support, too. It depends on whether you’re an SMB or a big enterprise.