


When working on a campaign, you need to have a marketing report. You need to know how the marketing campaign performs and what benefits it brings to your business.
You shouldn’t waste valuable time and resources writing content, developing a social media strategy, and redesigning your website if you do not see results.
Luckily, dozens of programs let you gather various types of data and keep track of how your ads are doing. This provides you with information about how your company is doing and shines a light on any potential area ripe for improvement.
The information from your report will drive your decisions so that all marketing efforts are strategic and focused.
This blog post will discuss a marketing report, why it’s crucial, and—most importantly—what to include in a marketing report. And to end all on a high note, you will be given access to over 80+ templates.

What is a marketing report?
A marketing report is essentially a summary of updated data relevant to digital marketing strategies.
A marketing report gathers and analyses marketing metrics to inform future marketing decisions, strategies, and performance.
Marketing reports help to reveal meaningful, insightful data that help you make essential decisions and accomplish objectives.
Marketing reports differ as it depends on the data you are looking at and the goal of each report.
The report can analyse the sources of your traffic and leads, the content users mainly engaged with, whether they converted, when they converted, and the length of time it took to make a purchase.
In summary, marketing reporting can be a precious tool if done rightly.
Types of marketing reports?
One advantage of marketing reports is everything can be measured. Unfortunately, that is also a disadvantage because you will be paralysed with so many options that you could make a mistake.
Luckily, this section will show you the types of marketing reports and how they should be used daily, weekly, monthly, quarterly, and annually to get the best results.
Daily marketing reports
They equip you with the tools to make quicker, more productive decisions.
A daily report helps you make an action plan each morning based on what you accomplished the day before and what you can do to improve it. These are some of the metrics to consider in a daily report.
● Average Session Duration Report
Average session duration measures the average length of sessions on a website. Once a user lands on a website, Google Analytics starts tracking their session.
This Marketing Campaign Tracking lasts until the user leaves the website or is inactive for a set period.
This report lets you know which web page is performing well and which web page isn’t. It’s valuable for demonstrating engagement and the value of your website’s content at the site level.
● SEO Overview Report
An SEO report summarises SEO metrics that show a website’s performance. Reports typically cover organic traffic, conversions, backlinks, and technical website health.
However, you can customise the report for your goals.
You could decide to check how many impressions, clicks, and CTR you get in a day to see if your SEO efforts are working or need to be optimised to meet the required target.
These are templates you can use to make creating an SEO report easier for you.
● Keyword Rankings Report
In SEO, “keyword rankings” relate to the precise position of your page in the search results pages for a given search query.
Whichever position your website appears in when users type search terms related to your page is your keyword ranking.
Higher keyword ranks mean being closer to the top of the page (toward place #1), while lower keyword rankings mean closer to the bottom (toward spot #10).
Search engines typically display roughly ten results per page. So, it’s common sense that you would want to strive to be on the first page and at least in the top 5.
Strive to check your keyword rankings every day so that you not only get to the top on the search page but stay there, and you can quickly achieve that with this template.

This is a template you can use to rank your keywords.
Weekly marketing reports
The weekly data gathering could be highly beneficial to the overall marketing plan.
Monitoring your weekly traffic can help you avoid a performance drop or, worse, a breakdown that might hinder the success of the entire month. These are some of the metrics to consider.
● Website/Blog Traffic Report
This report shows the total number of visitors that landed on your website, along with information on how they got there (organic, paid, social media) and where they are from (demographics).

Website traffic is essential for many reasons. Your website will have more prospective clients as more people see it and visit it.
The number of visitors to your website impacts your business’s opportunities to create a positive impression, acquire quality leads, share your brand, and develop relationships that ultimately help grow your business.
● Social Media Report
Social media reporting is a carefully selected set of data and stats tailored to your business’s social marketing campaigns and goals.
The report ideally has data from multiple social networks (Facebook, TikTok, Twitter, LinkedIn, YouTube, etc.) and metrics (follows, likes, reach, growth, awareness, views, interactions, etc.) over time.

With our templates, you can make more thoughtful, quicker, and more informed decisions while optimising your return on investment with each action or interaction you take to track, measure, and improve your socially driven efforts.
● Online Advertising Performance
Online marketing, sometimes referred to as Internet marketing, digital marketing, or web marketing, is a type of marketing and advertising that uses the Internet for advertising goods and services to target markets and platform users.

You can see how well your ads are performing with this report. How many impressions did you get for this week? How many click-through rates occurred?
How many users landed on your landing page this week from the ad? Questions and templates will help you ensure your ad performs as well as it should.
Monthly marketing reports
A monthly report can offer more detailed and comprehensive insights compared to previous reports, though it’s still essential to consider them all.
The weekly reports can be used to inform your monthly choices. These are some of the metrics to consider.
● Web Analytics Report
A web analytics report is a method for assessing the overall performance of a website.
This is accomplished by monitoring particular metrics or KPIs, such as online conversions, bounce rates, page views, session duration, referral traffic to your landing pages, and so on.
It typically contains and collects historical and unprocessed data and then presents it in an easy-to-read format.
At the end of the month, you should have enough data and information to let you know how effective your SEO efforts were.
● Digital Marketing Performance Report
This report includes insights based on the performance across all the online marketing platforms involved in your digital marketing strategy.
A detailed yet summarised overview of every metric, KPI, strategy, and more.

You can prepare a digital marketing performance report daily, weekly, monthly, or annual. We will create a report in less than 10 minutes if you contact us. No jokes.
Annual marketing reports
This report shows how well your marketing strategy performed in a year. This report provides a more comprehensive perspective of your campaigns’ long-term performance. These are some of the metrics to consider.
● Marketing CMO Report
As a marketing executive, a CMO report lets you see the big picture of how your marketing investments are performing over time (typically a year).
You can mix data from several data sources and present the KPIs that your marketing team is interested in.
● Marketing KPI Report
A marketing KPI (key performance indicator) is a measurable value used to measure the impacts of marketing activities across various marketing channels to create efficient budget spending strategies.
Why do you need a marketing campaign report?
● Track progress towards marketing goals
Do you know how successful your marketing is, or is it just guesswork? Can you list the channels with the highest ROI? Are you aware of the campaigns that are generating traffic and converting?
Tracking your marketing is essential for you to distribute your budget in a way that supports achieving your business goals.
You must ensure that all your efforts are directed toward achieving goals and not wasting time. And marketing reports make it possible for you to know whether you are on track.
● Have a clear view of all the outputs and outcomes
The outcomes are what the business requires or wants to accomplish. The acts or things that help achieve an outcome are known as the outputs.
This can be easily understood by considering outcomes as the results and outputs as the activities supporting the desired outcomes.
Marketing reports help you clearly see your goals/outcomes and what you need to do to achieve them.
● Identify emerging trends and be able to react to them quickly
For example, you notice from your social media report that you get more engagement on TikTok than you do on Instagram. This tells you that there is a trend and shift about to occur.
More people are on TikTok, especially when you dive deeper into your insights and find out that most people are unique users/visitors.
Next, you strategise on using TikTok more than other platforms and turn those potential users into paying customers.
● Identify the best-performing content (and vice versa)
With metrics like traffic, Average session, click, bounce rate, and so on in your marketing report, you can quickly identify which content is performing well and optimize it to perform even much better and gain new traction.
Vice versa, you can also find out which content isn’t doing well and work on improving it. The bounce rate and the average session should help you identify content that is not doing well.
● Better marketing forecasting
You can gather information and generate predictions about future traffic levels with SEO and marketing forecasts. They can also assist you in estimating the potential worth of that traffic.
Before making any marketing decisions, forecasts use historical patterns as a guide to help you allocate resources, prioritise SEO efforts, and make adjustments that will benefit your business.
● Consolidate valid marketing data
Large amounts of raw data are consolidated into smaller, more relevant bits of information. This is also known as Data consolidation.
When data is consolidated into easy-to-understand reports, it can offer more precise insights into the success of your marketing efforts and the general operation of your business.
● Understand customer behaviour
Studying and understanding customer behaviour allows you to present your products more effectively to have an impact that resonates with the customer.
That way, customers will be more eager to interact with your business.
● Monitor campaign performance
A marketing report makes it possible to monitor your campaign performance. It gives a thorough breakdown of all your campaign advertising efforts.
You will know how much you spent during the campaign, the strategies adopted, KPIs and metrics used, and whether you were successful in sticking to your budget while still achieving your campaign goals.
● Support business decision making
Nobody has all the answers, but you can find most of them in a detailed marketing report.
With the data gathered and presented in the report, you can get information to address any challenges and make an accurate, appropriate, timely, and better decision that positively impacts your business.
● Help teams achieve goals
Every business has a goal, an objective, and a reason for being and staying in business. A marketing report helps not just you but everyone involved to meet and achieve those goals.
A marketing report will show you detailed steps to achieve those goals, be it an increase in revenue, profits, brand awareness, or the goal.
What KPIs and Metrics should be in your marketing report?
● Client-Specific Data
Using client-specific data, you can learn a lot about the demographics that interact with your brand.
Businesses can use this information to inform future business choices, including adjustments to marketing strategies that benefit both customers and your business. Some of the metrics to look at are:
- Country
- Device
- Subscription details
- Average order value
- Previous purchases
- Feature usage and duration
● Website Data
The world is connected more than you can imagine. Data is necessary for you to understand the current consumer journey.
From where your customers are coming from, what is generating leads, what information is interesting to them, and what a typical buying cycle looks like for your business. Some metrics to look at are:
- Sources
- Bounce rate
- Conversion rate
- Pageview
- Pages Per Session
- Landing page
- Cost
- Web traffic
● SEO data
We already know how vital SEO data is; without SEO, there is no way your website will rank on google. Your business’s SEO data can provide you with a wealth of insights and accurate data.
These data help you learn more about your audience, their interest, engagement levels, and how to strengthen your marketing and SEO efforts.
So, to optimize your SEO, look out for these metrics and ensure they are producing the correct numbers in accordance with your goals. Organic Traffic
- Organic Impressions
- Keyword monthly search volume
- Backlinks
- Page Speed
● Digital Advertising Campaigns’ Data
A digital advertising campaign is a business’s online marketing attempt to drive engagement, conversions, traffic, or revenue.
The campaign utilises one or more digital media and is consistent with the business’s goal. Metrics to track are:
- Website Traffic
- Click-through rate
- Conversion
- Purchase
- ROI
- Bounce rate
- Cost per acquisition
● Web Analytics Metrics
Web analytics shows the information gathered from tracking the performance of your website.
Web analytics can also be used to analyse website traffic and conduct market and commercial research to evaluate and enhance the performance of websites.
The following KPIs and metrics are typically included in it:
- Page Views
- Referral Traffic
- Bounce Rates
- Online Conversions.
● Marketing performance metrics
Marketing performance metrics or Key performance indicators (KPIs) serve as a source of valuable information that is used to understand how marketing activities and expenses affect the business.
These are some of the metrics involved:
- Cost per action
- Cost per click
- Acquisition
- Clicks
- Impressions.
● Website traffic data
Website traffic is the total number of visitors your site receives over a specific time. Website traffic could also be an accurate assessment of your website’s popularity.
There are many different website traffic metrics you could be monitoring because they each address different aspects of your website. Some of them are:
- Users
- Pages Per Session
- Percentage of New Sessions
- Sessions by Source
- Top Organic Keywords
- Demographics
- Traffic by Channel
● Blog traffic metrics
You will need specific data to know the amount of traffic your blog receives. This is where monitoring blog traffic metrics comes into play.
As stated earlier, with metrics like Average sessions, sign-ups, and clicks, you can adequately measure the quality of traffic that comes to your blog.
● Social Media Metrics
There is no denying that social media metrics are much more critical than ever. Thankfully, our social media dashboard templates make it simple to manage this information daily, weekly, or monthly.
However, it’s crucial to understand which ones you should watch.
- Likes
- Followers
- Comments
- Reach
- Page views
- And Sessions from Social media
● Content Quality Control Metrics
Content Quality control metrics help you monitor how well your content is performing and how it affects metrics like conversions, opportunities, and sales.
Not only will this help improve your content, but it will also help improve your position on Google search pages.
The following are a few content metrics you should consider monitoring to optimise your content:
- Google Keyword Ranking
- Visibility
- Domain Authority
How to stand out with your marketing report
Your marketing report must be appealing to read, simple to grasp, and visually appealing. We’d even go so far as to say that your marketing report must reflect your brand well.
Packaging is essential in marketing. These are some helpful tips to make your report stand out.
● Add section headers
Headers make anything easier to read. Just like how you are reading this blog post and understanding where each section goes and is all about, should your marketing report and section headers help achieve that?
● Include comments and notes to add your insights
Comments take it a step further when providing a deeper understanding of any written report. It makes any marketing report easier to understand for anyone going through it.
So, include comments and share what you think about and why specific metrics were involved in the report so that everyone going through it can understand it.
● Incorporate images
A picture speaks louder than words. Images make your data easy to comprehend. Instead of just having figures all over the place, turn them into infographics or look for images that also express your goal.
● Section your marketing report according to your metrics
Instead of putting all your data in the same report (and there’s nothing wrong with that) to create a comprehensive digital marketing report with all the necessary information, you could instead section a report for each type of data or metric.
For example, you could have a social media report could be section according to its source (Instagram, TikTok, YouTube).
● Customize with your design
To make your report something hard to forget, you can customize your report with WhiteLabel options like the ones we have.
Marketing report templates & Dashboards you can use
1. General marketing report template
A marketing agency can sometimes be a pretty complex mechanism whose parts function independently.
The mechanisms therein could be solely focused on Facebook ads, Instagram ads, LinkedIn ads or Google ads and there could be a few in there who are specialists in SEO and the likes.
When all is said and done, something needs to bring all units together to help the leaders make sense of the firm’s progress and that’s where the General marketing report shines.
A template such as this tracks key metrics from all angles of your firm and allows you to keep tabs on your ad spend, revenue, and growth metrics.
Let’s explore a sample template below together, shall we? Check out our report template for all your marketing campaigns.
2. SEO & SEM marketing report template
Recall when I talked about the SEO guy a couple of seconds ago? Yeah… now we are in his department and we’d like to help him take stock of the important metrics he needs to show progress and growth.
Here’s an SEO templates bank we’d like to give him for free so he can track for all your SEO & SEM efforts. Below is a sample template you’ll see when you visit our SEO templates bank.
Check out our report Templates for all your SEO & SEM efforts.
3. PPC marketing report template
Porter metric parades an array of beautiful templates you can use to track your PPC marketing report.
Some templates can track your PPC campaigns across social media platforms such as Facebook Ads, TikTok for Business and Google Ads.
The one below, for instance, has an overview page and goes into detail on the pages following the overview page.

Interestingly, this is just one of the many templates we have for you on our PPC template gallery. Below is another favorite that some clients can’t get enough of.
If you want more insights on your Facebook advertisements, you should try this one below. It’s another in-demand PPC dashboard that you should try.

Check our customized report Templates for all your PPC campaigns.
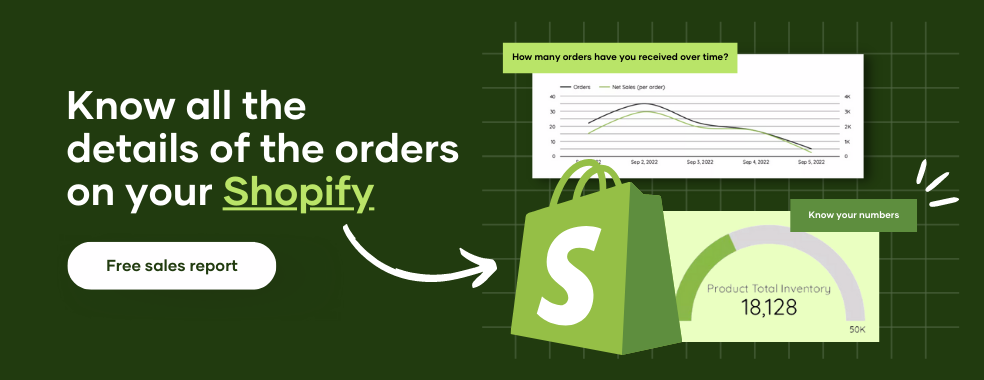
4. eCommerce marketing report template
Also, we have a pretty compact template for you if you are running an eCommerce brand or a marketing agency managing a few eCommerce platforms for your clients.
If you have not explored ours, we implore you to try this free Shopify dashboard and see how deeply insightful it is in terms of the metrics and key performance metrics it helps you track.
You can click on the image below to get started using the template or click the link here if you’d instead access this beautiful Shopify template via an in-text link.
Alternatively, you can schedule a brief call session with our support staff here so they can help you get set up correctly.

5. Email marketing report template
And for your email marketing campaign needs, we prepared something beautiful to help you report your Mailchimp campaigns whenever you want to visualise your data correctly.

If you’d like to get started using the template above, please click the link below to access this beautiful template via an in-text link.
Alternatively, you can schedule a brief call session with our support staff here so they can help you get set up correctly.

6. Web analytics report template
If you are more of an organic guy or agency looking to track your analytics and web funnels, then we also have something for you. Below is one of our best sellers that you should try for free.
It’s a free template if you’ll stick with Google-related connectors such as Google Ads, Google Analytics, Search Console and the like.
If you decide to test our connectors at some point, you’ll have that for free for the first 14 days, which is enough to help you decide on onboarding with us.
Whatever the case is, we’d like to assure you that we have a bulk of templates available to help you access and make sense of your marketing campaign.
So you can visualize the metrics important to your business and scale on your business with the information you gathered from our conversion-focused dashboard.

What not to put into a marketing report
● Irrelevant metrics
Too much information can cause more harm than good. Only use metrics that are needed in the report. You don’t want to add metrics that will only raise questions and be confusing and difficult to read.
● Technical jargon
Always keep it simple (KISS). The whole idea of a marketing report is to present data in a way that is easy to understand. That means no technical jargon at all in the report.
● Unnecessary visuals
Images are great but keep them valuable and straight to the point.
Marketing Campaign Reporting Tools You Can Try
● Porter Metrics

One of the best marketing reporting tools you will ever use is Porter Metrics. Its initial price of $15 makes it more affordable than the other tools on this list.
With only a few mouse clicks, you can automate your reporting thanks to Porter Metrics’ integration of your daily social media and marketing data into Google Data Studio.
Additionally, we offer templates so you can organise and visualise your high-volume marketing data without starting from scratch.
Alternatively, you can use one of the 80+ report templates provided by Porter Metrics to build your marketing reports.
Porter metrics is an essential tool for businesses wishing to monitor their most significant KPIs, enabling you to link your crucial company data with other programs.
It enables you to link your marketing data and vital company data with other programs you already use, including Hubspot, Mailchimp, Shopify, Instagram, TikTok, and other social networking sites.
Porter can also help you determine your entire advertising costs and return on investment across various ad channels, such as those offered by Google, Facebook, Instagram, LinkedIn, and TikTok.
You can do all these and more without needing to learn how to code; very easy to use.
● DashThis

DashThis is a user-friendly marketing report tool that offers White Label reporting on data obtained from multiple marketing channels.
It serves all clients from smaller firms, marketing teams, and freelancers through automated reporting of vital information.
● Supermetrics

Supermetrics simplifies the transfer of data from more than 80 sales and marketing platforms into analytics and reporting solutions that helps marketers make better decisions.
Businesses can use Supermetrics to consolidate data from multiple marketing and sales platforms like Facebook Ads, Google Analytics, and Instagram into their preferred reporting, analytics, and storage platform, be it a business intelligence tool, a spreadsheet, a data visualisation tool, a data lake, or a data warehouse.
The result is increased marketing performance based on data-supported decisions, more insights into your marketing data, and substantial time and cost savings by doing away with manual copying and pasting.
● Power My Analytics

Power My Analytics is another marketing reporting tool for reporting automation that collects data from advertising, email marketing, shopping, social media, payment, CRM, and other marketing-related platforms, then integrates the data with the best data visualization, web analytics, and warehousing tools for digital marketers
● Cyfe

Cyfe is a business dashboard software that helps users consolidate their data, visualize the trends, and create a single reporting solution.
In other words, it is a marketing analytics tool specialising in automated data extraction. Cyfe is available to assist you in gathering this information from various platforms, channels, and campaigns.
● Geckoboard

Geckoboard is designed to help team leads display live data for their team and the organisation.
Geckoboard integrates directly with over 80 different platforms and services to get your data into a professional-looking dashboard and in front of others in a matter of minutes.
With a simple drag-and-drop interface, you can create dashboards in your browser and extract valuable data, analytics, and KPIs from lifeless reports and spreadsheets.
With visuals that everyone can comprehend at a glance and that refresh automatically to always be up to date, Geckoboard makes your marketing report more attractive.
Creating a Marketing Campaign Report with Porter Metrics Template
Creating a marketing report with the Porter Metrics template is easy. Just follow these steps.
1. Visit Portermetrics.com.
2. Click on “resources” then “templates.”

3. Select any template that you like.

4. Download the template and then make a copy of it.

5. Add your data source(s)

6. The template will open up with your data.

7. Start editing with your preferred visualisations.

It’s that simple and easy. It’s so simple that if you contact us right now, we can create a marketing campaign report for your business or company in less than 30 minutes. Yes, 30 minutes. If you doubt it’s possible, try us now.
Conclusion
You must understand your goals and your audience’s requirements before you start writing your marketing report.
Remember always to keep your message clear, concise, and pertinent. If you’re looking for a simple and efficient way to automate your marketing reporting, try Porter.
We offer a 14-days free trial — no credit card needed. You can use a marketing report template to ensure you have covered everything.
Do you need more assistance with your marketing efforts? Or do you want to know how Porter Metrics can help your project? Contact one of the team members, and let’s discuss how we can collaborate.
Frequently Asked Questions
● How do you write a marketing report?
You can create a repeatable process for writing a marketing report if you follow these steps:
- Establish the aim of the report.
- What do you want to learn from it?
- Establish your marketing goals.
- Choose the data that will provide you with the answers you want.
- Put the marketing data together in a way that tells a story.
- Repeat
- Modify the marketing report template as necessary.
● What should a quarterly marketing report include?
A quarterly report contains an executive summary, goals and objectives, highlights, and new and ongoing challenges. The quarterly report can also discuss any difficulties and plans or solutions to address them.
● How do you present marketing results?
- Concentrate on marketing results rather than activities
- Show how your goals are connected.
- Use business language to communicate value instead of marketing jargon.
- Context is important because your audience won’t understand what successful marketing looks like without it.
- Keep your reporting style and material constant.
- Tell the entire truth (both good and bad)
● What are the top 3 marketing report templates for agencies
1. General marketing report template
2. SEO & SEM marketing report template
3. Social media marketing report template
● Need more help with getting started?
Get in touch with us now with any problem you might have regarding your marketing report, and we will solve it for you before you know it. Our support team is always available 24/7 for you to contact anytime, any day. And you can even get a free report right now if you contact us.