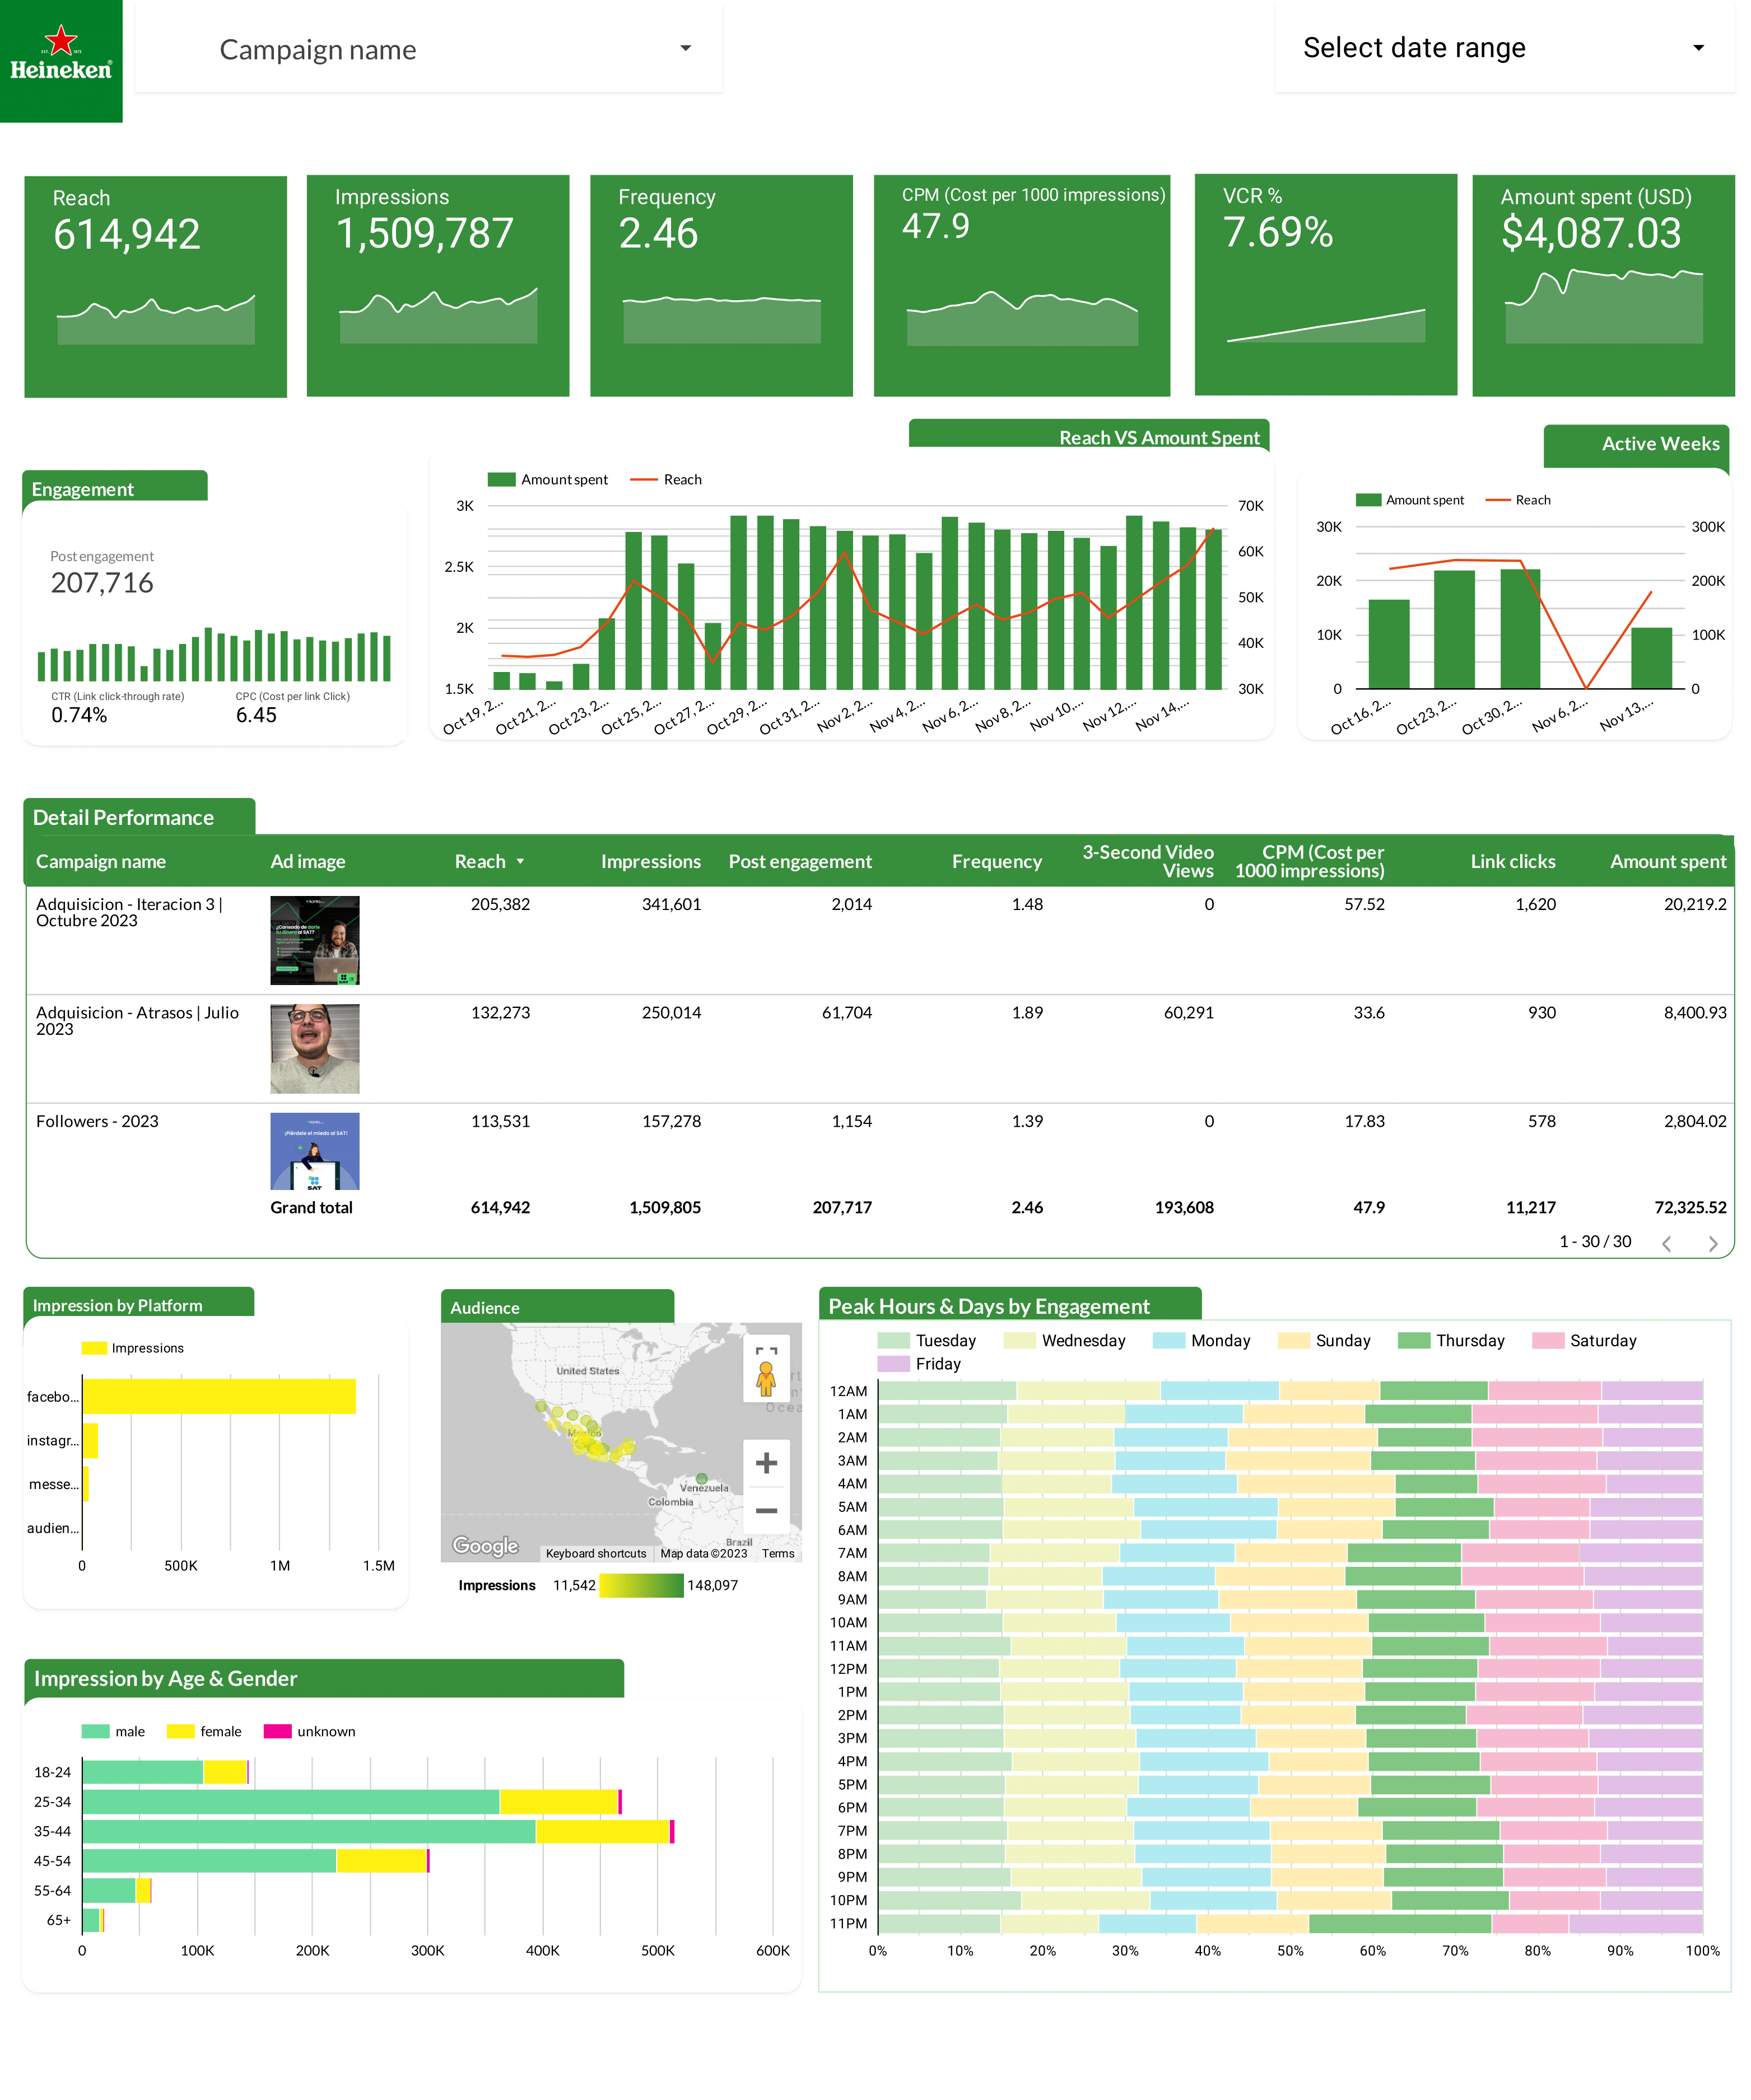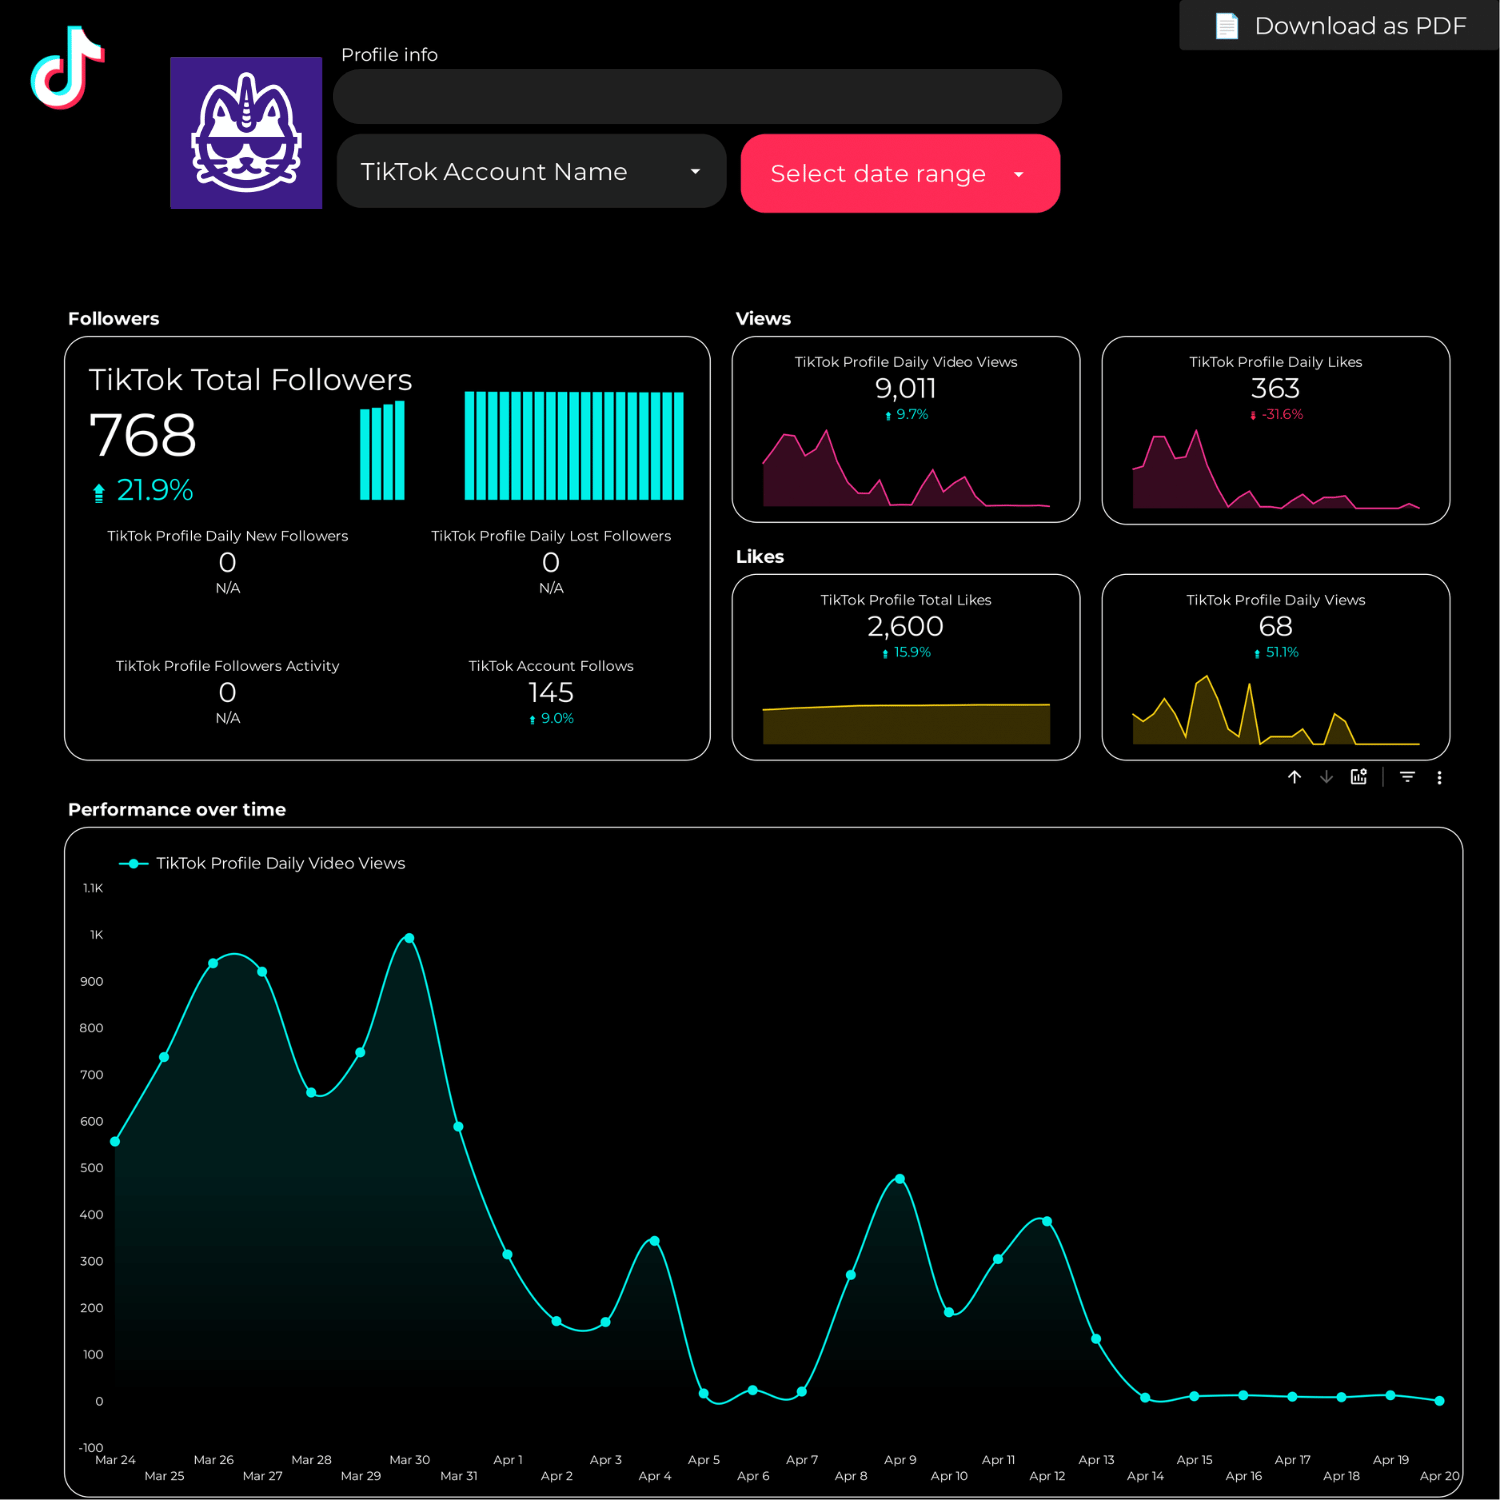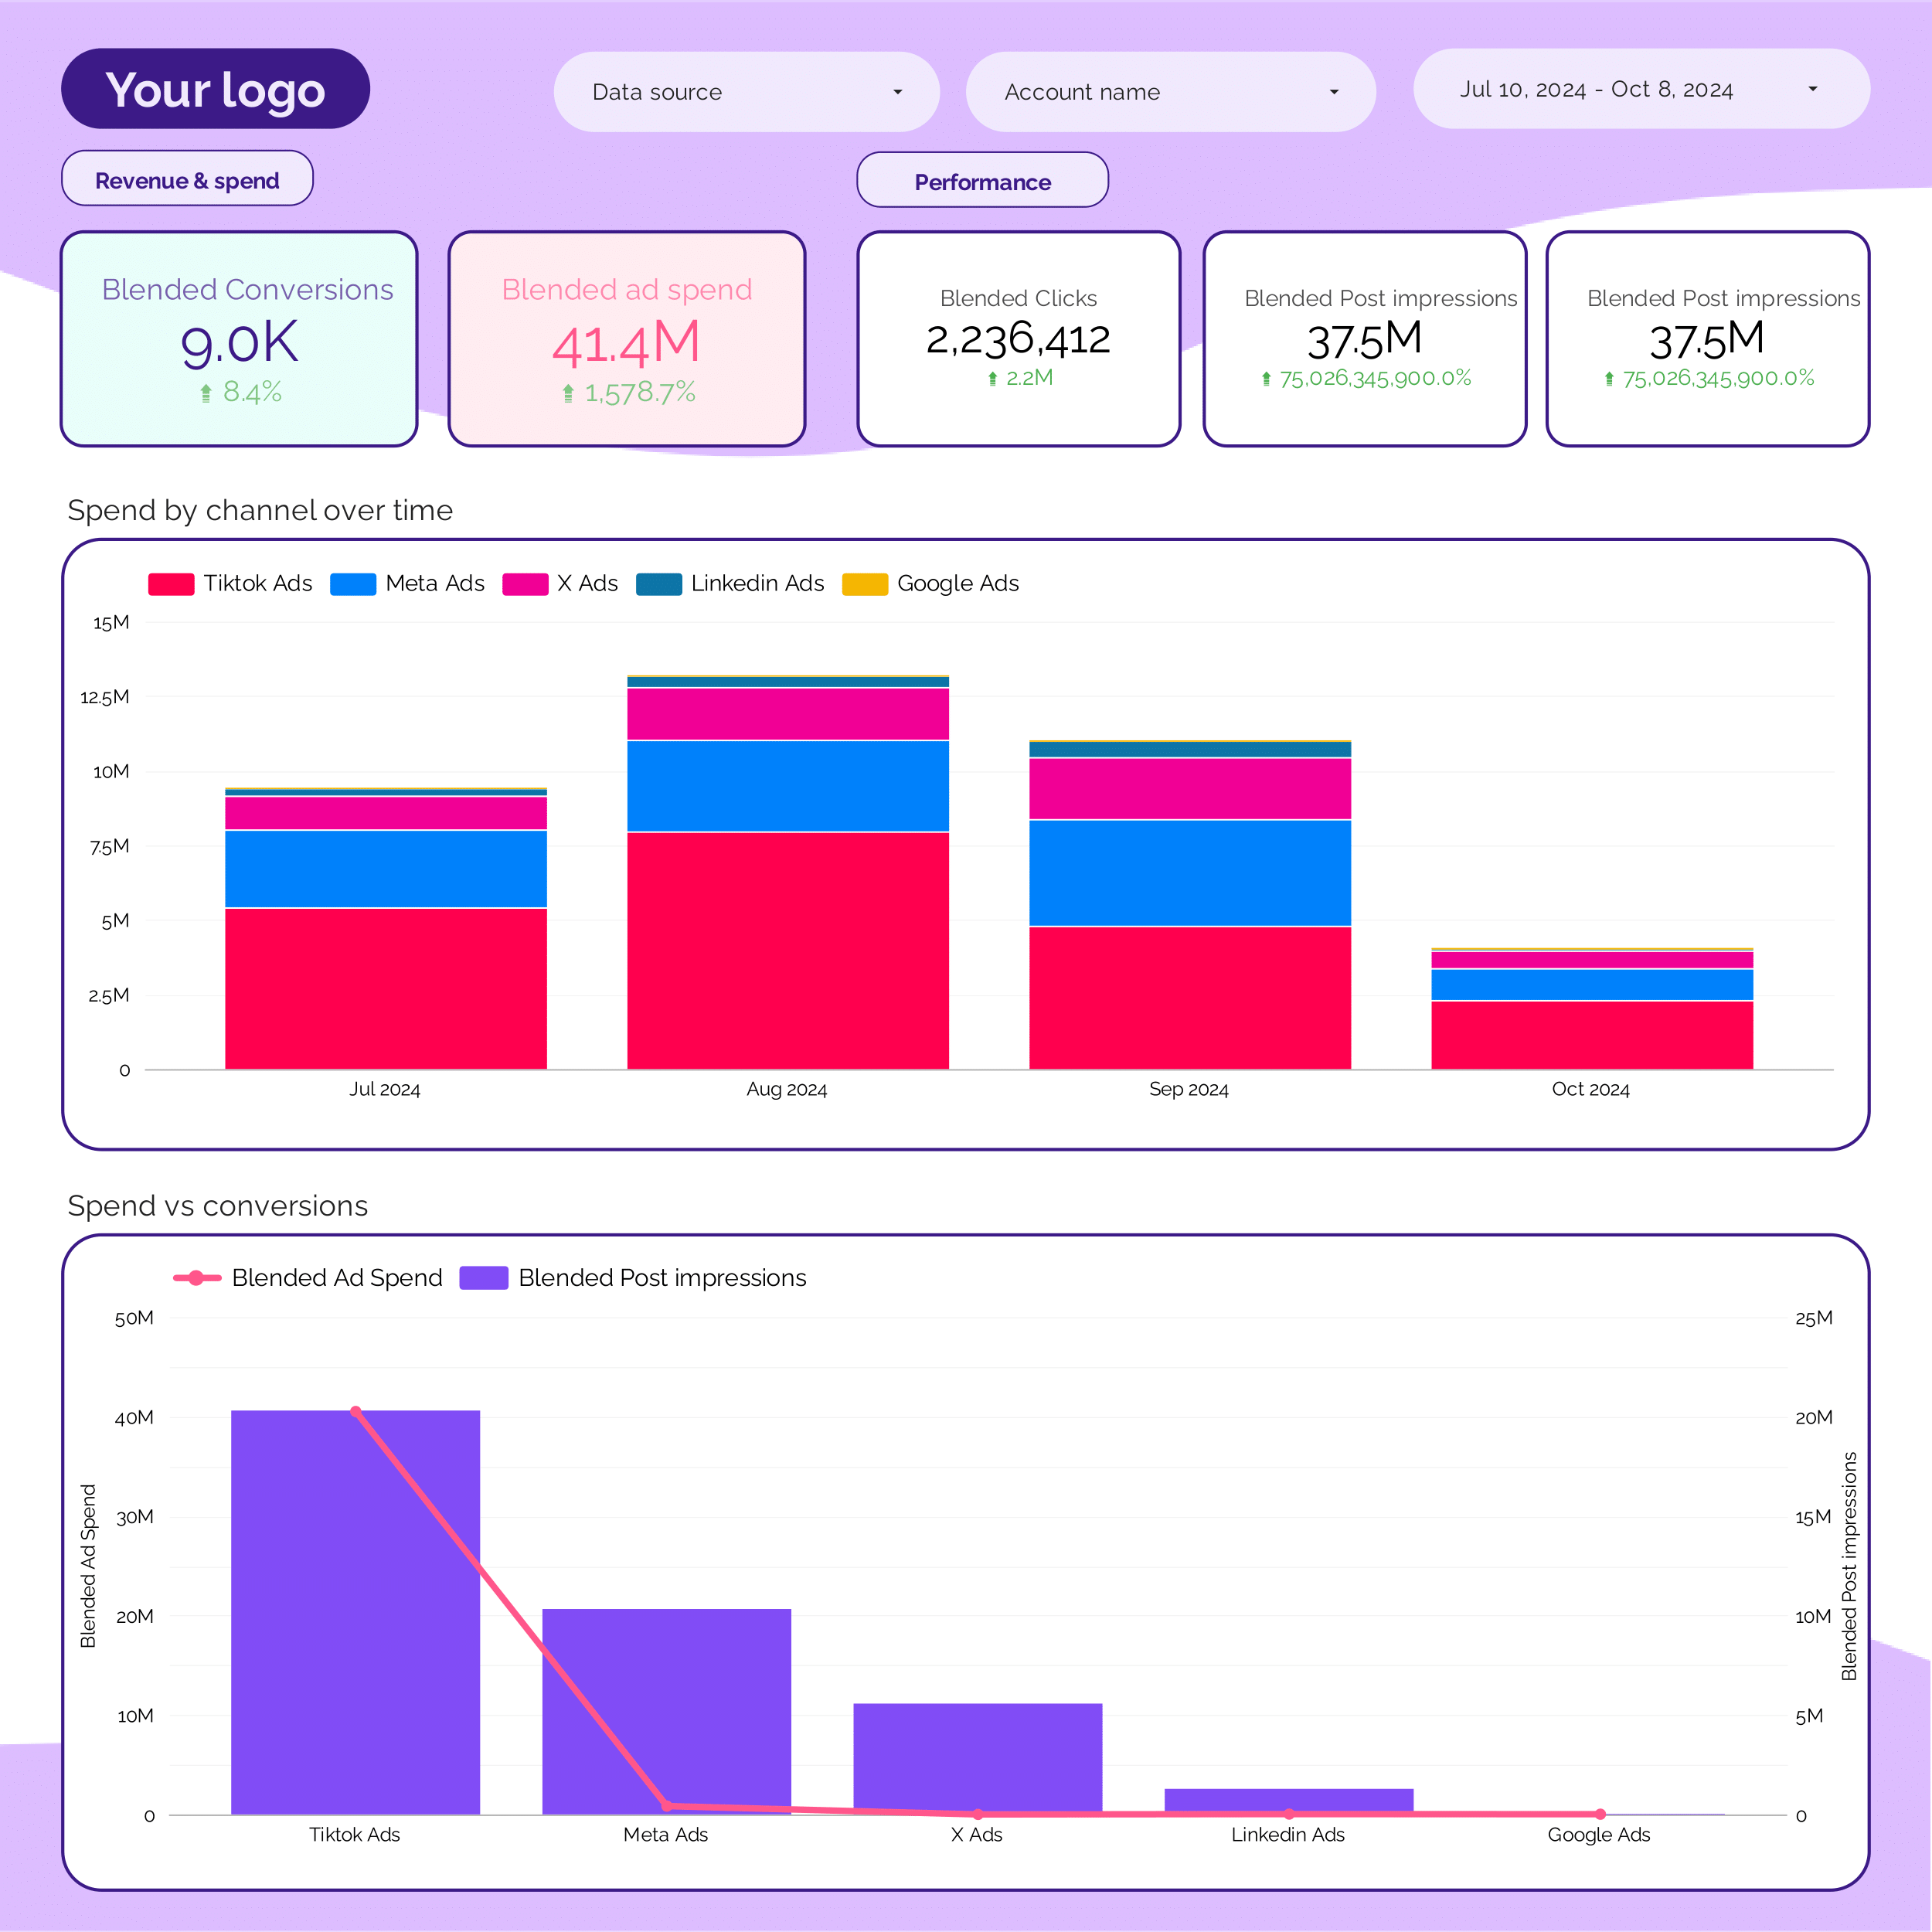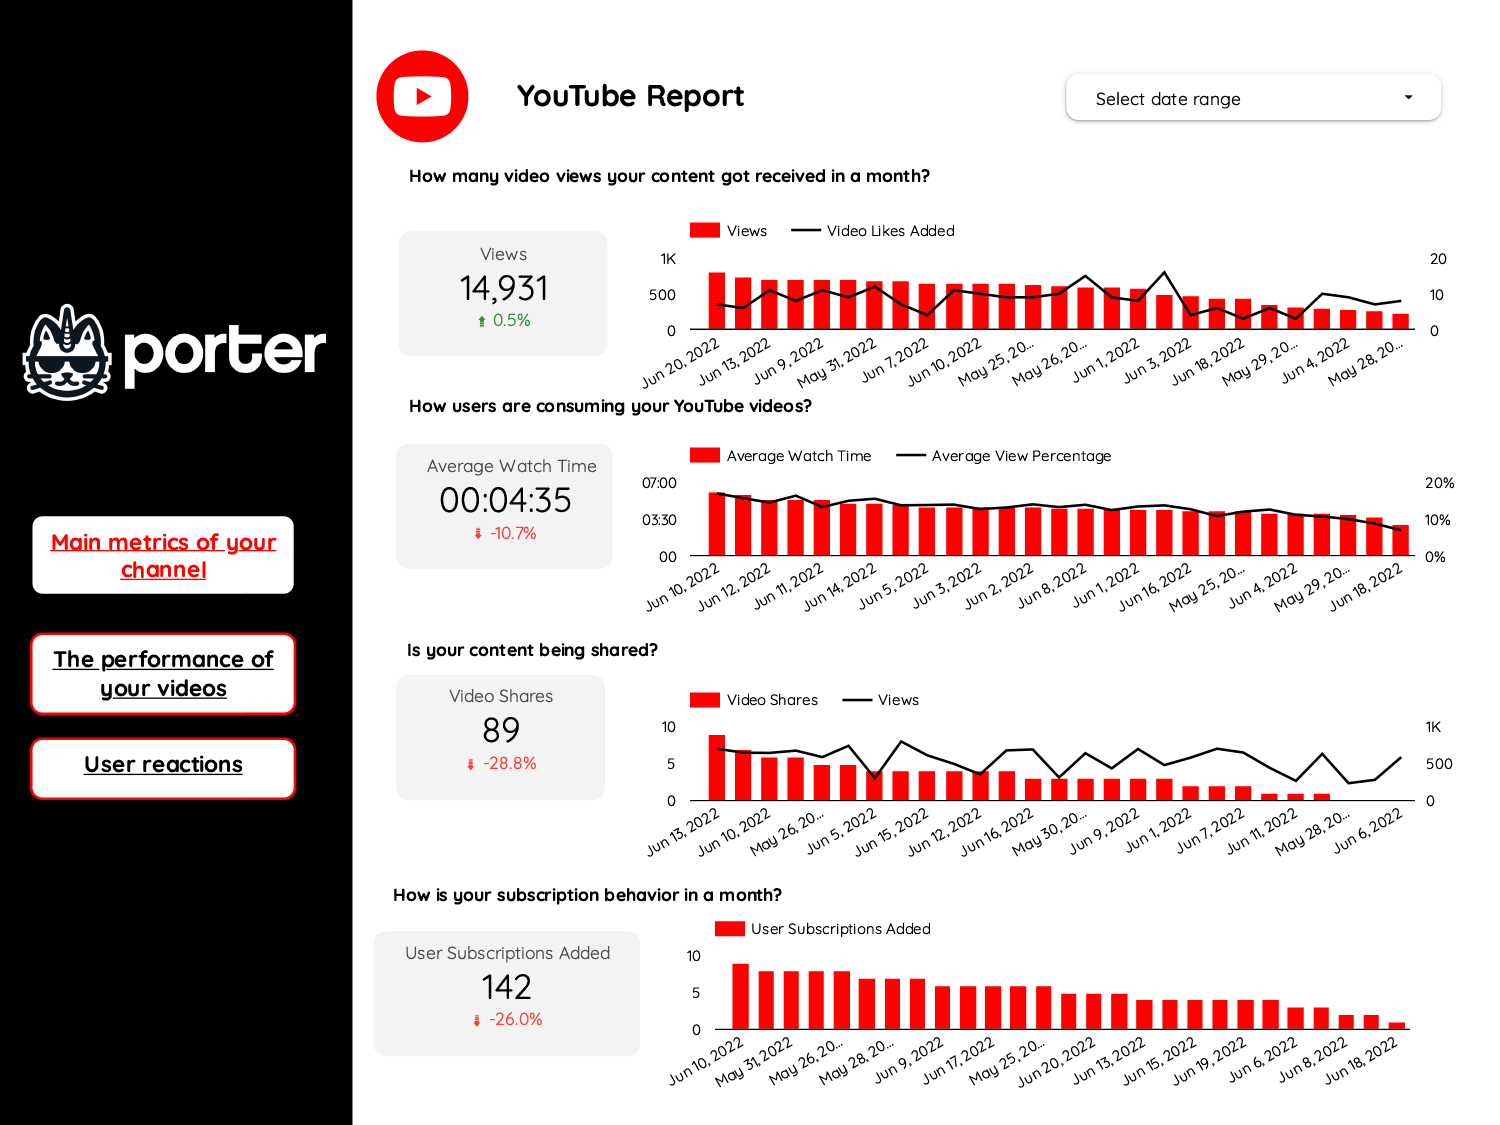
Video marketing dashboard example
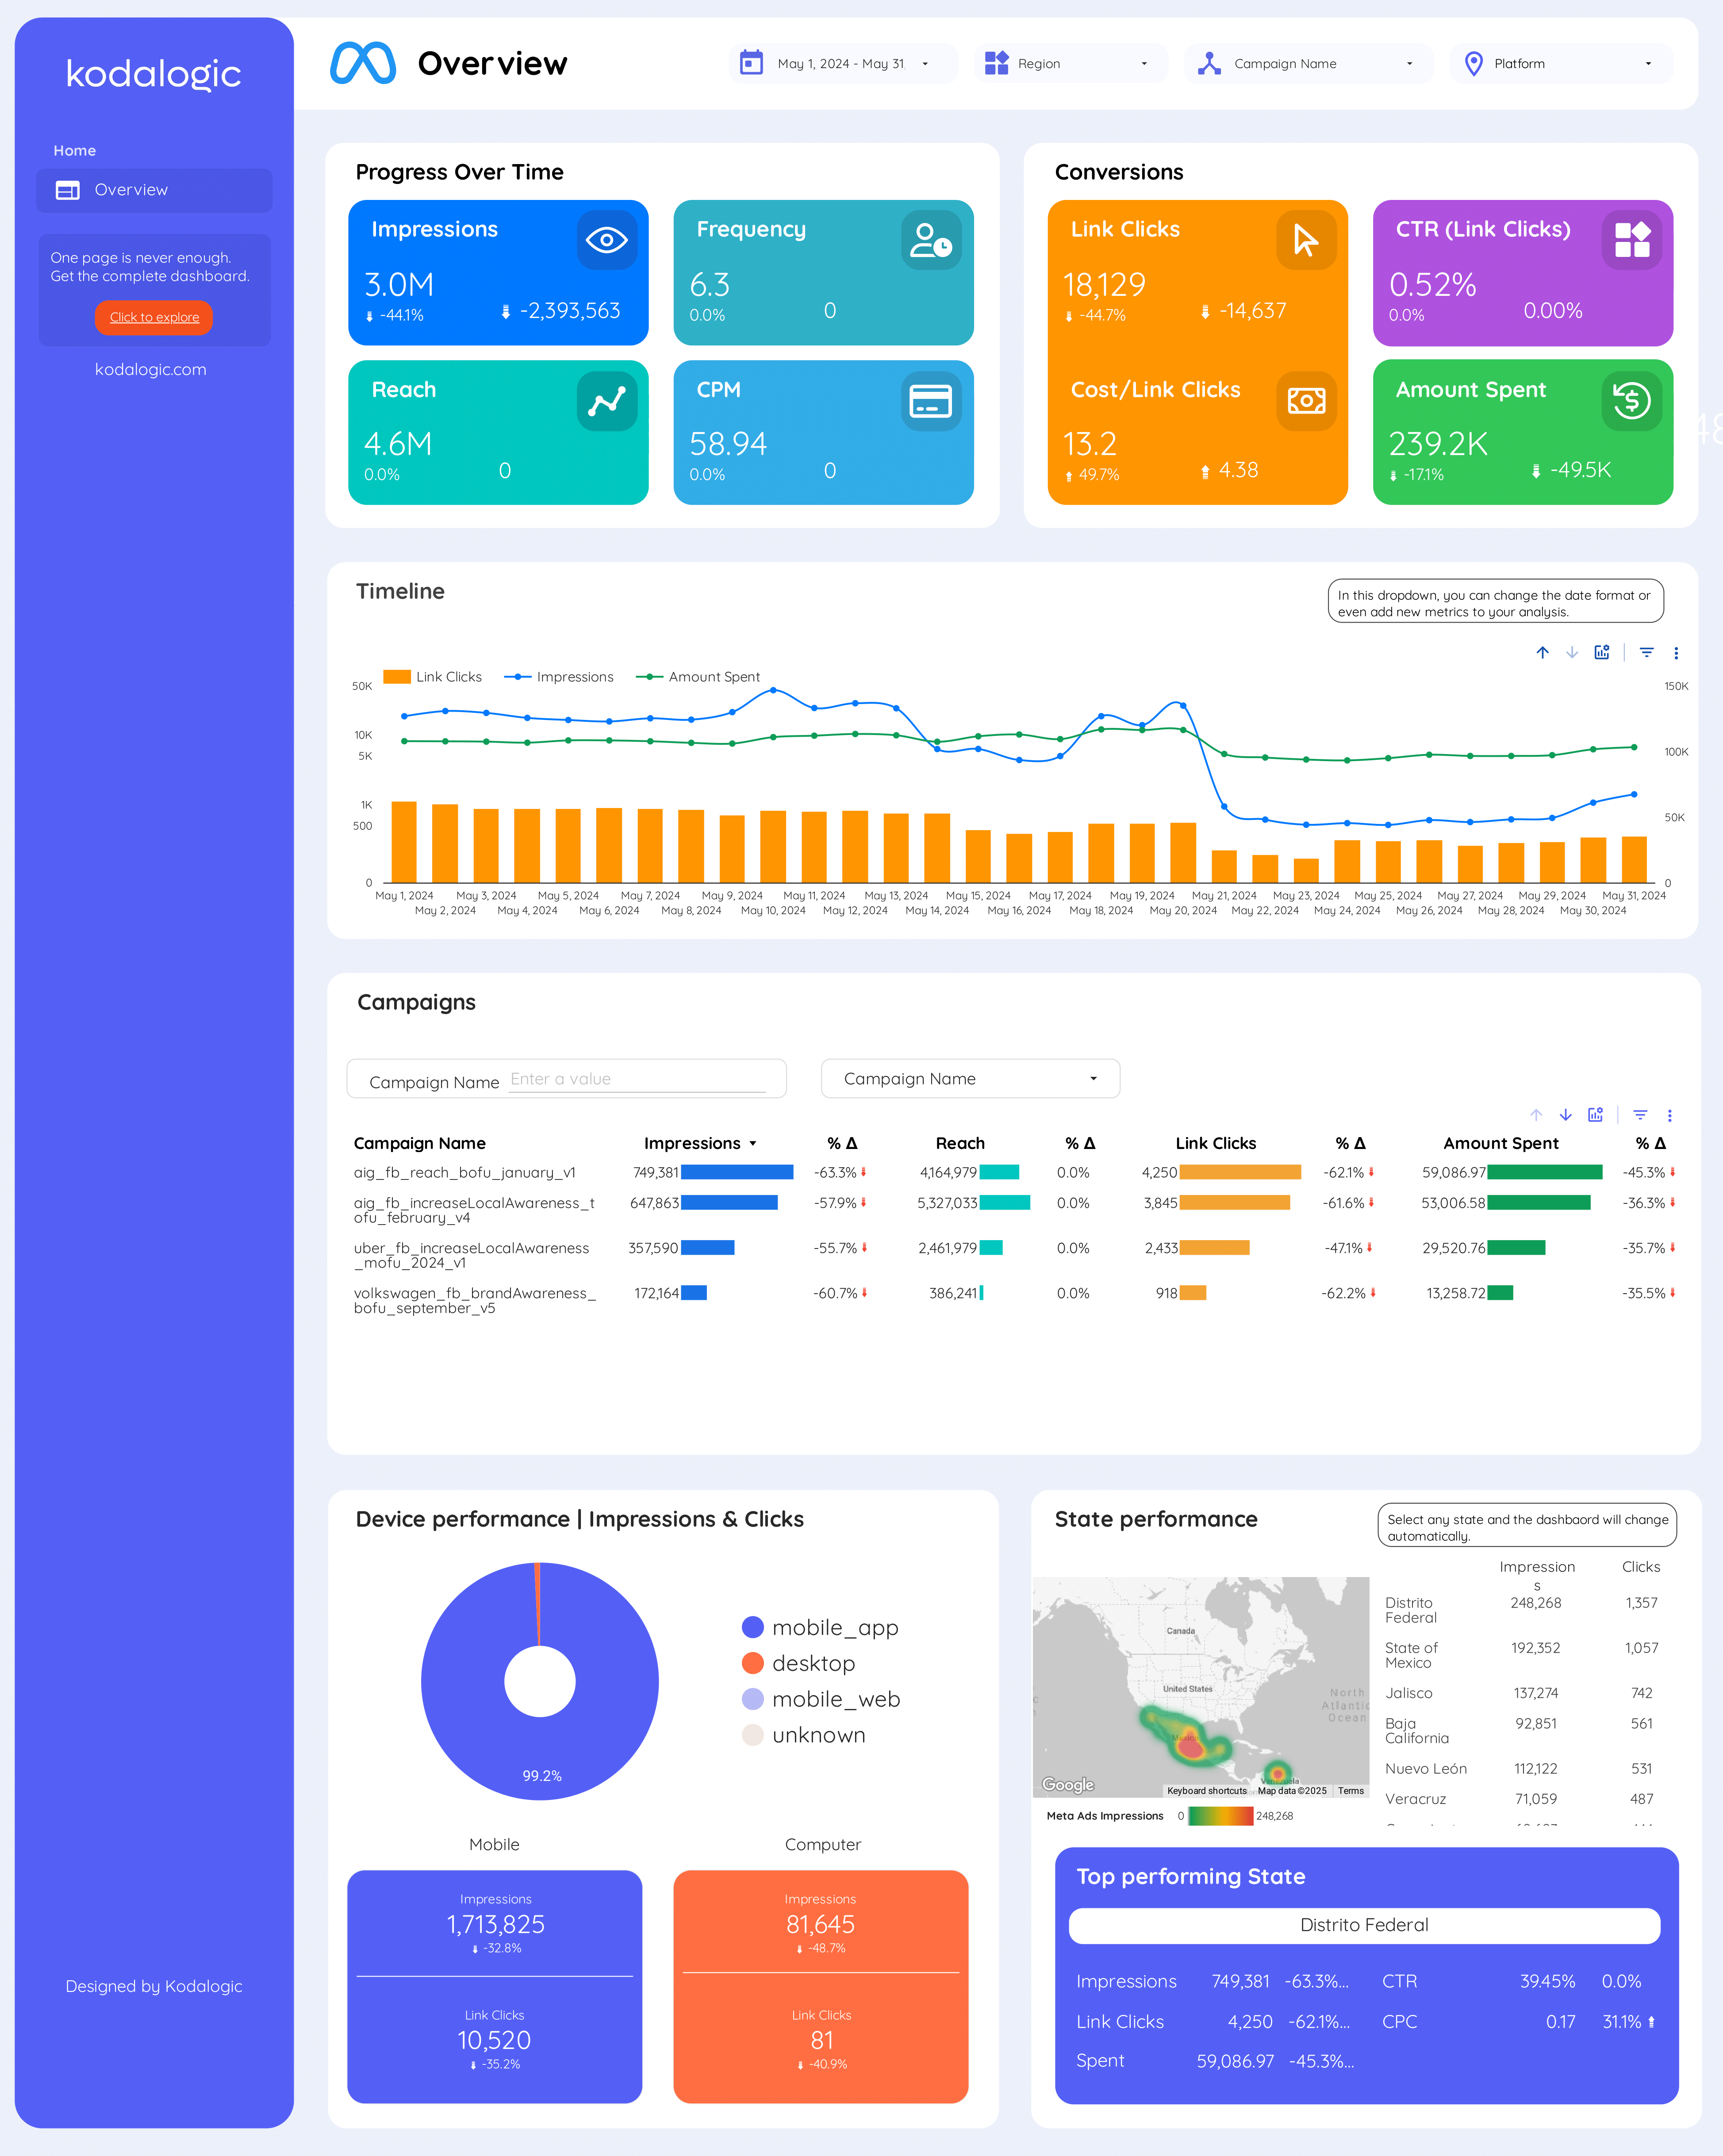
This Video marketing dashboard example tracks CTR, conversion rate, ROI, likes, shares, and views. Analyze by demographics, psychographics, and geography. Perfect for social media and YouTube strategies, it offers actionable insights for marketing teams to optimize performance and meet goals.