A PPC monthly report should include the following elements:
1. Campaign Name
2. Date
3. Impressions
4. Clicks
5. Ad Spend
6. Click-Through Rate (CTR)
7. Cost Per Click (CPC)
8. Conversions
9. Conversion Rate
10. Facebook Page Likes
11. Google Quality Score
12. LinkedIn Engagement Rate
13. TikTok Video Views
14. Twitter Retweets
These metrics provide a comprehensive overview of the performance across different platforms such as Facebook Ads, Google Ads, LinkedIn Ads, TikTok Ads, and Twitter Ads.
To analyze PPC monthly data, follow these steps:
1. **Collect Data**: Gather data from all platforms (Facebook Ads, Google Ads, LinkedIn Ads, TikTok Ads, Twitter Ads) for the month.
2. **Key Metrics**: Focus on key metrics such as Impressions, Clicks, Ad Spend, CTR (Click-Through Rate), CPC (Cost Per Click), Conversions, Conversion Rate, and platform-specific metrics like Facebook Page Likes, Google Quality Score, LinkedIn Engagement Rate, TikTok Video Views, and Twitter Retweets.
3. **Compare Performance**: Compare the performance of each platform by analyzing the metrics. Look for trends, spikes, or drops in performance.
4. **Calculate ROI**: Determine the return on investment by comparing the cost (Ad Spend) against the revenue generated from conversions.
5. **Identify Top Campaigns**: Identify which campaigns performed best by looking at metrics like CTR, Conversion Rate, and overall conversions.
6. **Optimize**: Use insights to optimize future campaigns, focusing on high-performing platforms and strategies.
7. **Report**: Create a report summarizing the findings, highlighting key insights and recommendations for future campaigns.
To build a PPC monthly dashboard, follow these steps:
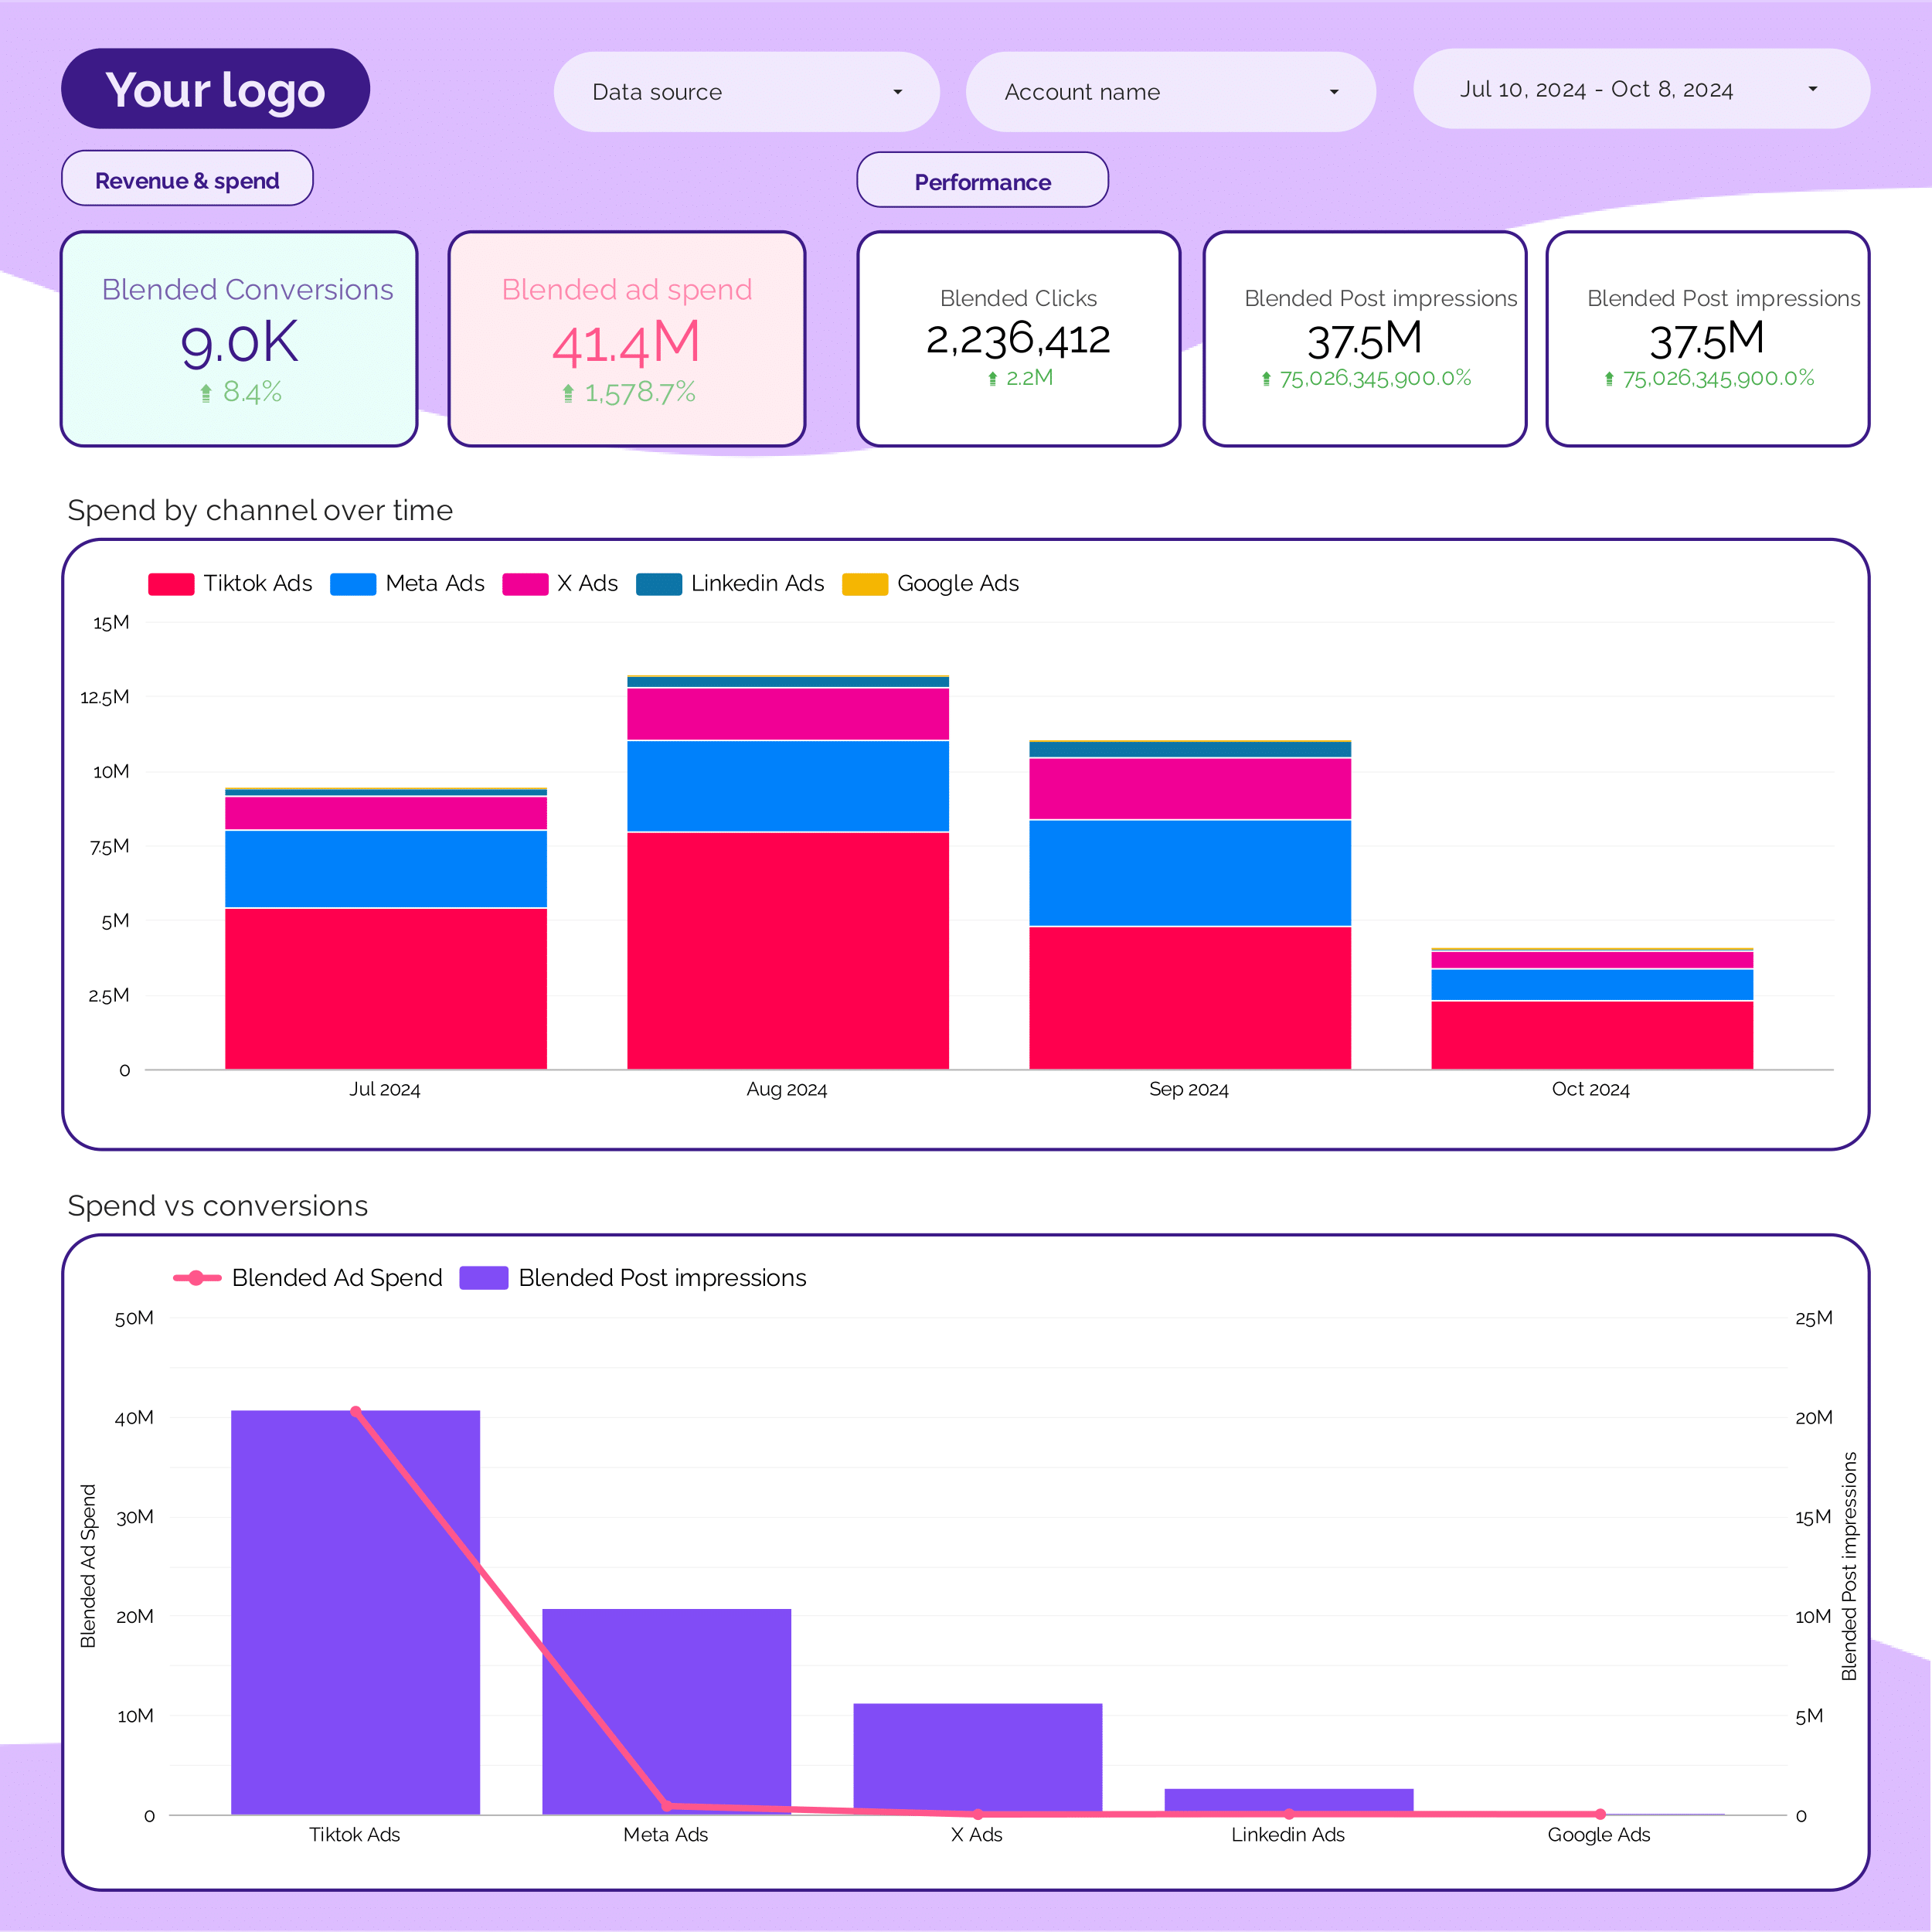
1. **Data Collection**: Gather data from all relevant platforms such as Facebook Ads, Google Ads, LinkedIn Ads, TikTok Ads, and Twitter Ads. Ensure you have metrics like impressions, clicks, ad spend, CTR, CPC, conversions, conversion rate, and platform-specific metrics like Facebook page likes, Google quality score, LinkedIn engagement rate, TikTok video views, and Twitter retweets.
2. **Data Organization**: Use a spreadsheet or a data visualization tool to organize the data. Create columns for each metric and platform, including campaign name and date for tracking purposes.
3. **Visualization**: Use charts and graphs to visualize key metrics. For example, use line charts for trends over time, bar charts for comparing performance across platforms, and pie charts for budget allocation.
4. **Analysis**: Highlight key insights such as top-performing campaigns, areas for improvement, and ROI. Use this analysis to make data-driven decisions for future campaigns.
5. **Reporting**: Compile the visualizations and insights into a comprehensive report. Ensure it is easy to understand and actionable for stakeholders.
6. **Automation**: If possible, automate data collection and reporting using tools like Google Data Studio or Tableau to save time and ensure accuracy.
A PPC monthly dashboard is a tool used to track and analyze the performance of pay-per-click advertising campaigns across various platforms such as Google Ads, Facebook Ads, LinkedIn Ads, TikTok Ads, and Twitter Ads. It typically includes metrics like impressions, clicks, ad spend, CTR (click-through rate), CPC (cost per click), conversions, conversion rate, and platform-specific metrics like Facebook page likes, Google quality score, LinkedIn engagement rate, TikTok video views, and Twitter retweets. This dashboard helps marketers assess the effectiveness of their campaigns and make data-driven decisions.


 Facebook Ads
 Google Ads
 LinkedIn Ads
 Tiktok Ads
 Twitter Ads
 Impressions
 Video Views