







Claude dashboard examples
34 free templates for marketing overviews, SEO, PPC, social and web analytics. Each preview runs on Porter demo data; open one for its prompt and the Claude Dashboards setup.
34 templates
 Claude


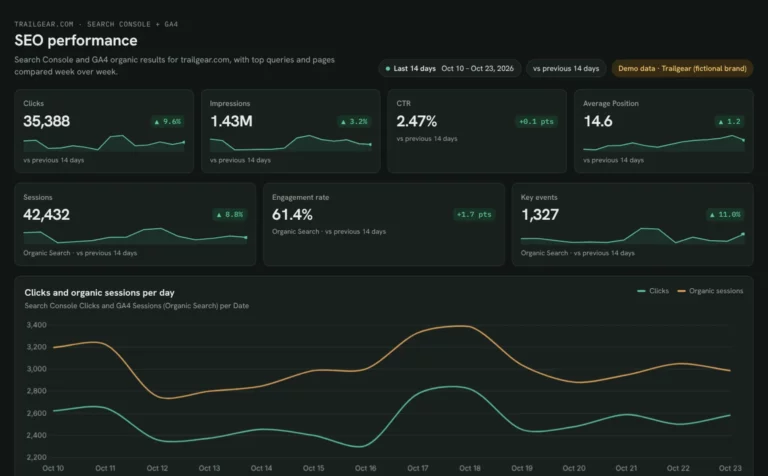
SEO dashboard template
See which Search Console clicks turn into GA4 sessions and key events.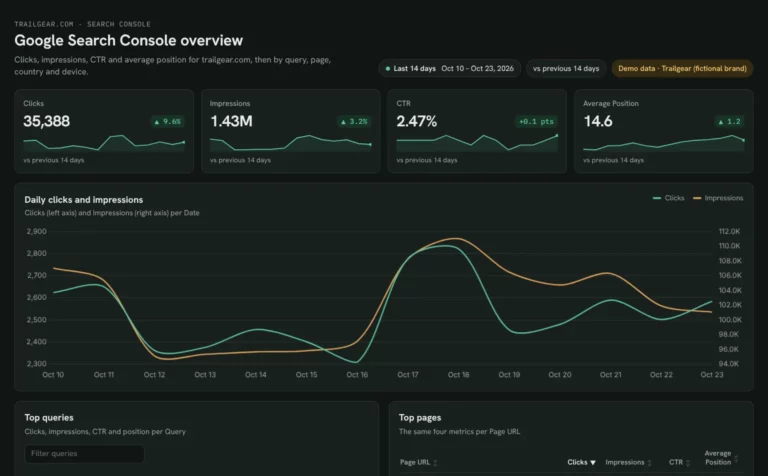 Claude
Google Search Console dashboard template
Find queries close to page one and fix low CTR by page and device.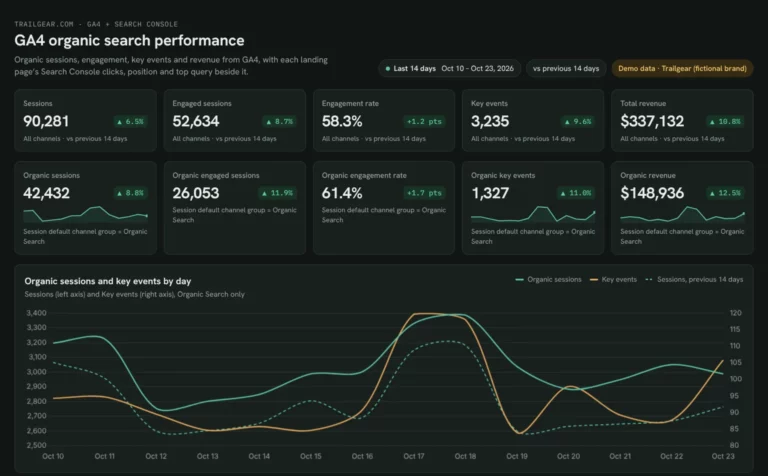 Claude
GA4 SEO dashboard template
See which landing pages bring organic sessions and key events.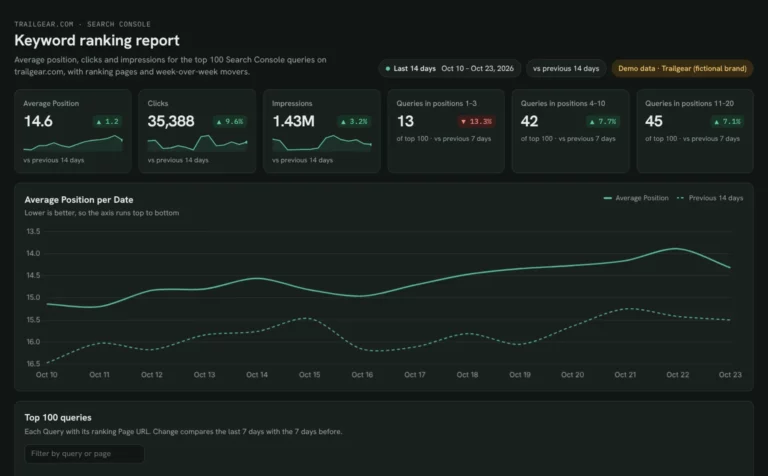 Claude
Keyword ranking dashboard template
Track which keywords reach page one and what moved this week.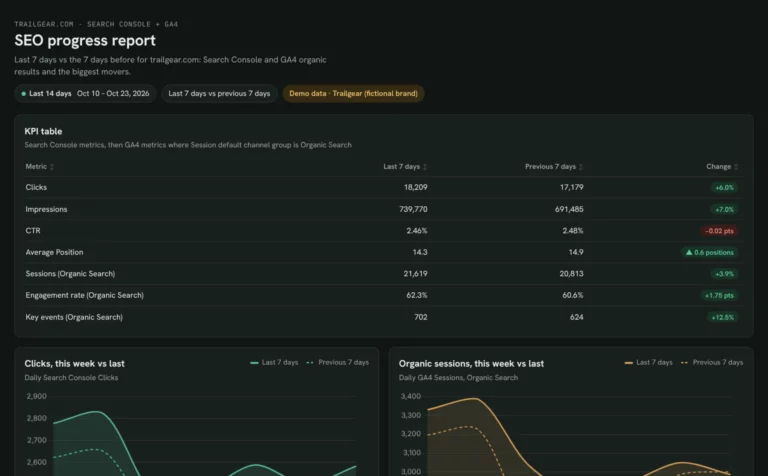 Claude
Monthly SEO dashboard template
Show month-on-month SEO results and the pages that moved them.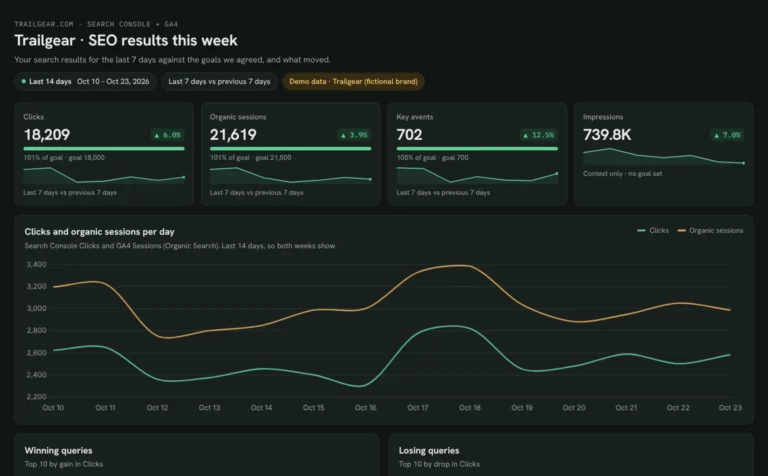 Claude
Client SEO dashboard template
Report clicks, sessions and key events against each client’s goals.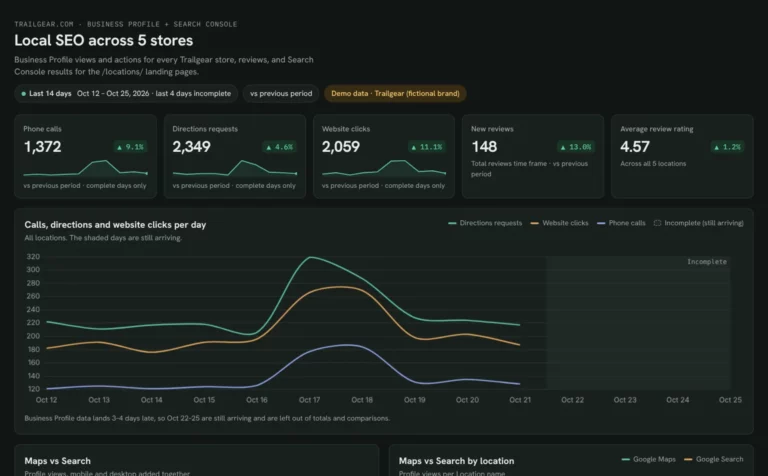 Claude

Local SEO dashboard template
Compare calls, directions and website clicks for every location.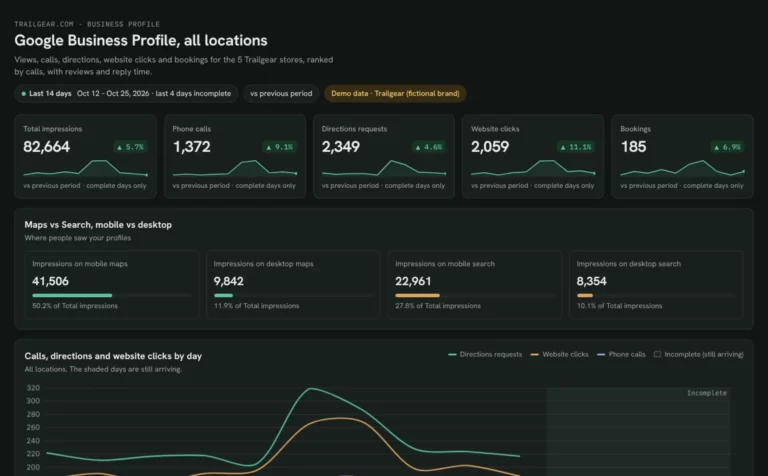 Claude
Google Business Profile dashboard template
See Maps and Search views, calls and reviews for each location.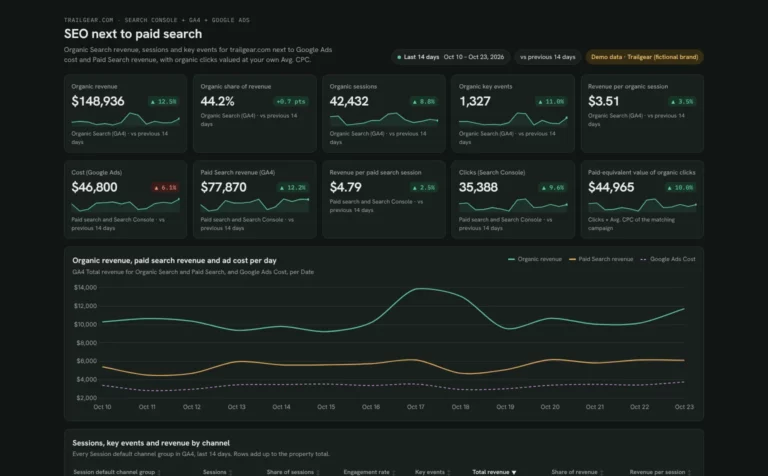 Claude

SEO marketing dashboard template
See what SEO earns next to paid search, from revenue share to the value of organic clicks.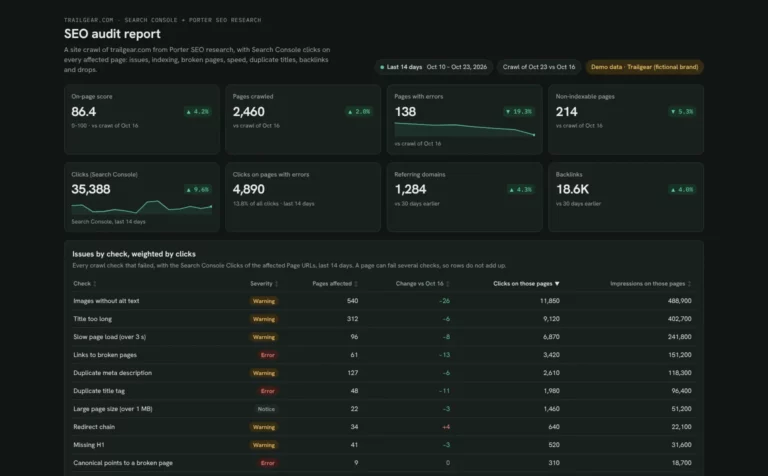 Claude

SEO audit report template
Fix the site issues that cost the most clicks, from broken pages to slow top pages.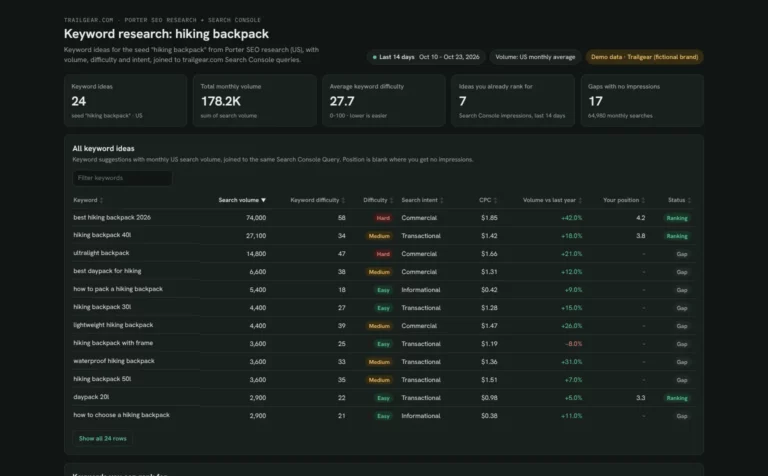 Claude
Keyword research report template
Find keywords you can win, see where you already rank and spot gaps with no page.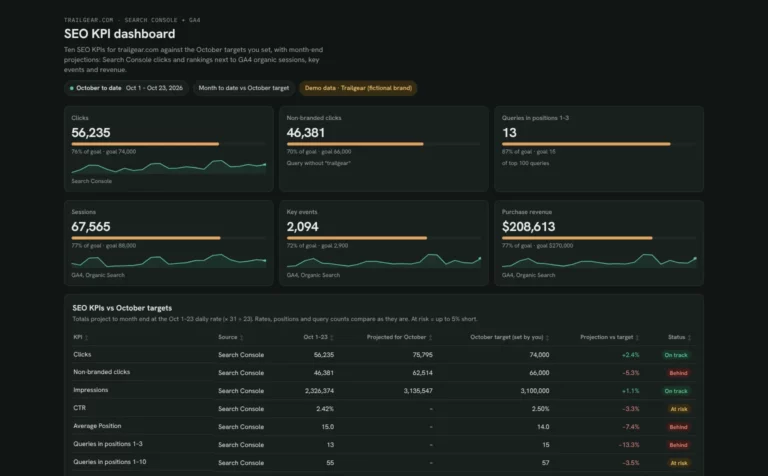 Claude
SEO KPI dashboard template
Track 10 SEO KPIs against your monthly targets and see which ones will miss before month end.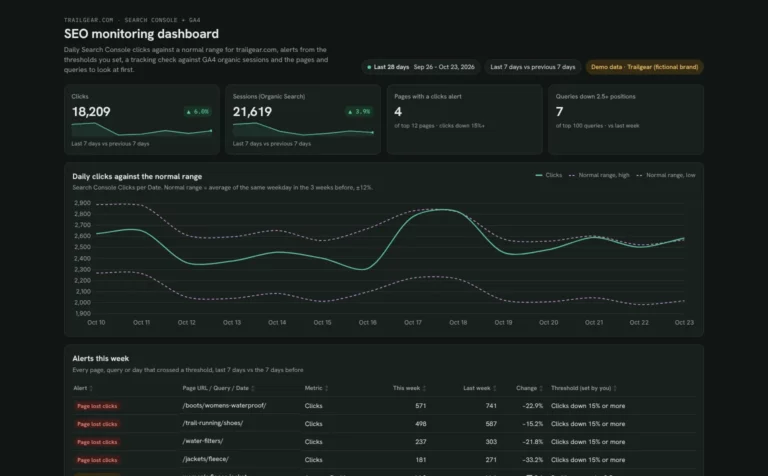 Claude
SEO monitoring dashboard template
Catch SEO drops early with alerts from your own thresholds and a daily check against GA4.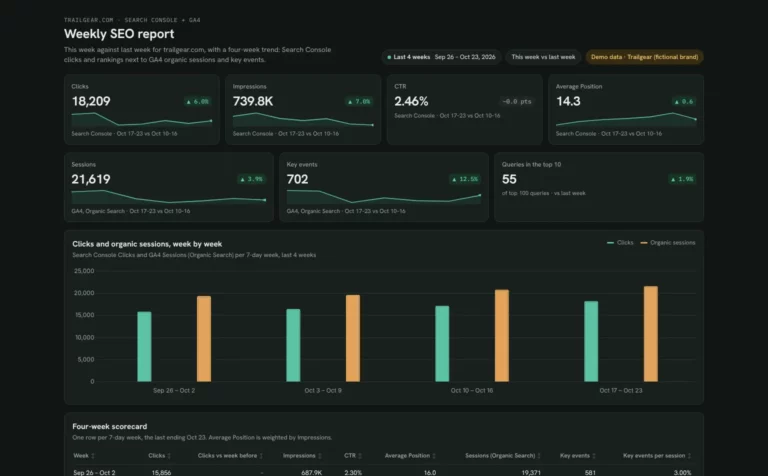 Claude
Weekly SEO report template
Run your Monday SEO check: this week vs last and the queries and pages that moved.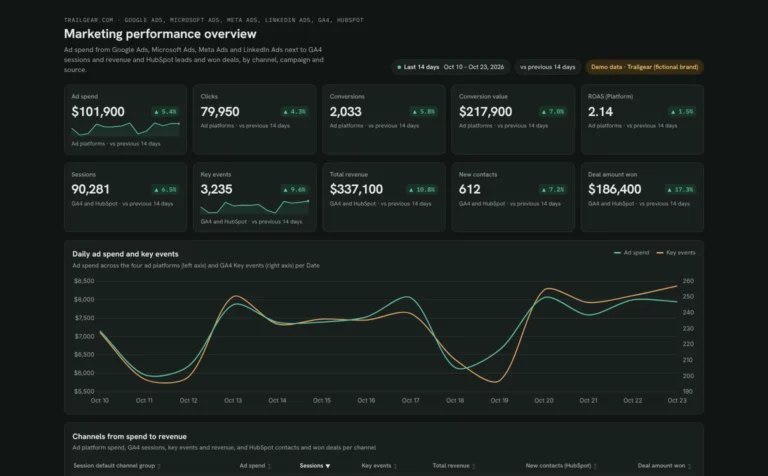 Claude


Marketing dashboard template
See which channels turn ad spend into leads, won deals and revenue.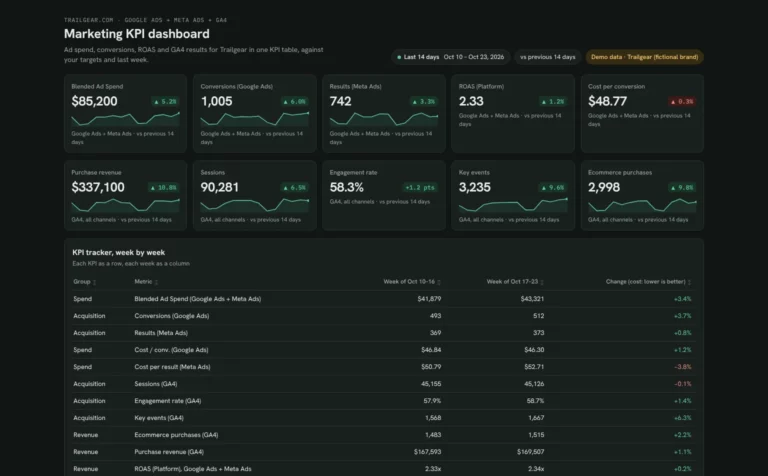 Claude
Marketing KPI dashboard template
Track ad spend, conversions and revenue week by week against your targets.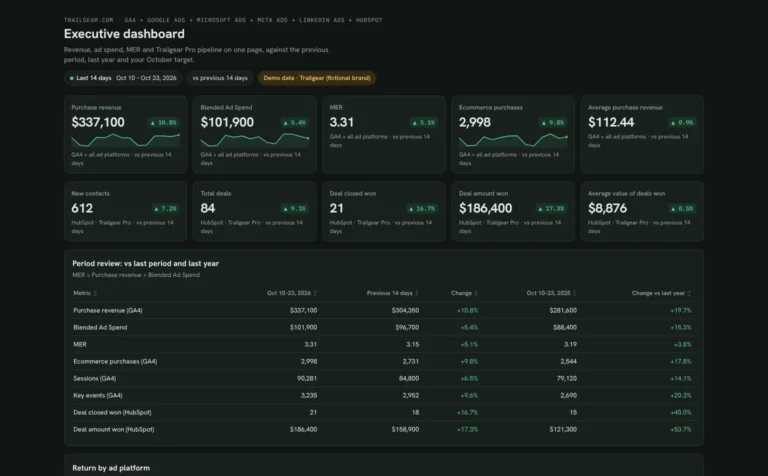 Claude
Executive dashboard template
Show leadership revenue, ad spend, MER and pipeline on one page.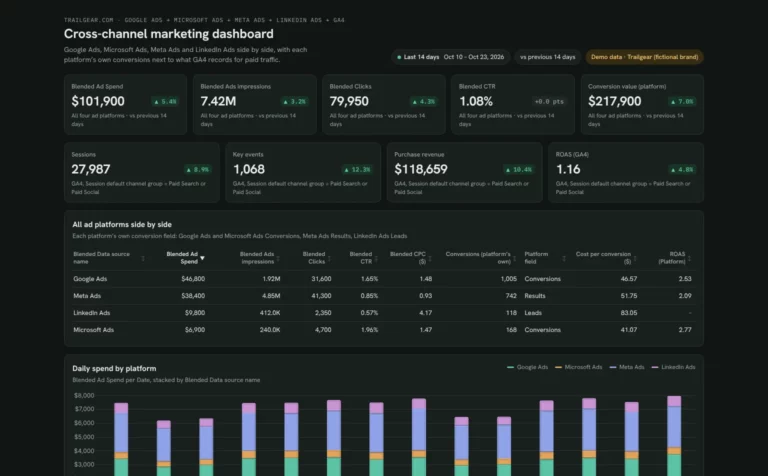 Claude


Cross-channel marketing dashboard template
Compare spend, CPA and ROAS across your ad platforms next to GA4.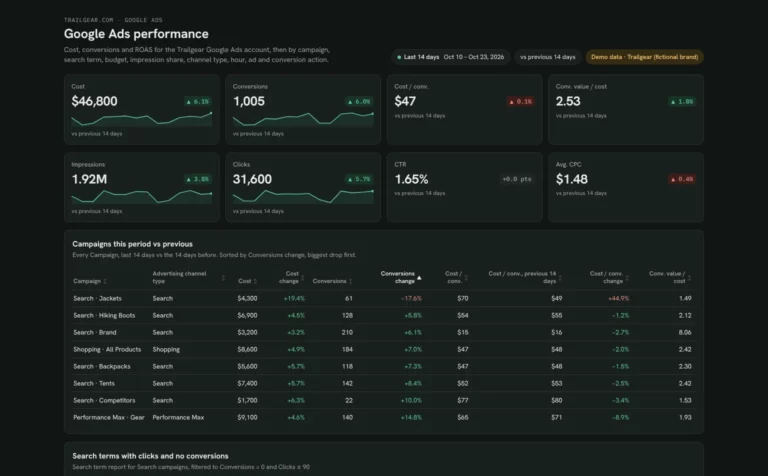 Claude
Google Ads dashboard template
Find search terms that waste spend and see which campaigns are limited by budget.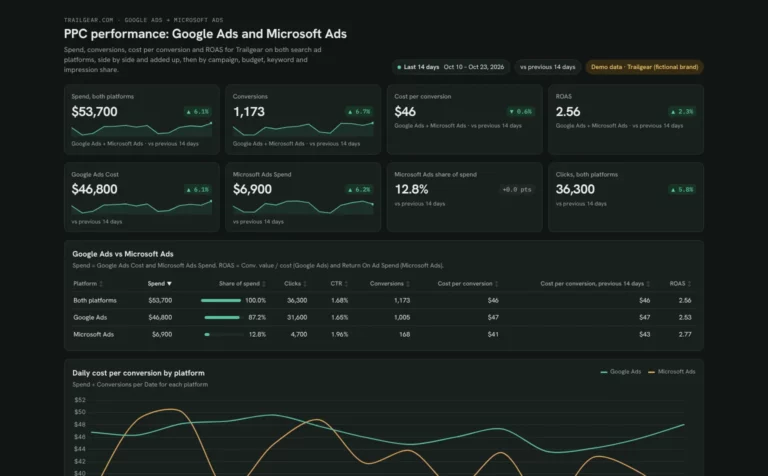 Claude
PPC dashboard template
Compare Google Ads and Microsoft Ads spend and cost per conversion side by side.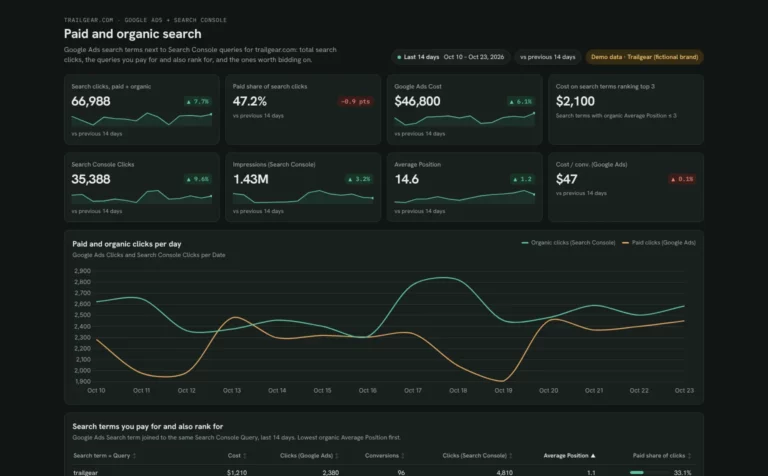 Claude
SEM dashboard template
Find search terms you pay for but already rank for, and queries worth bidding on.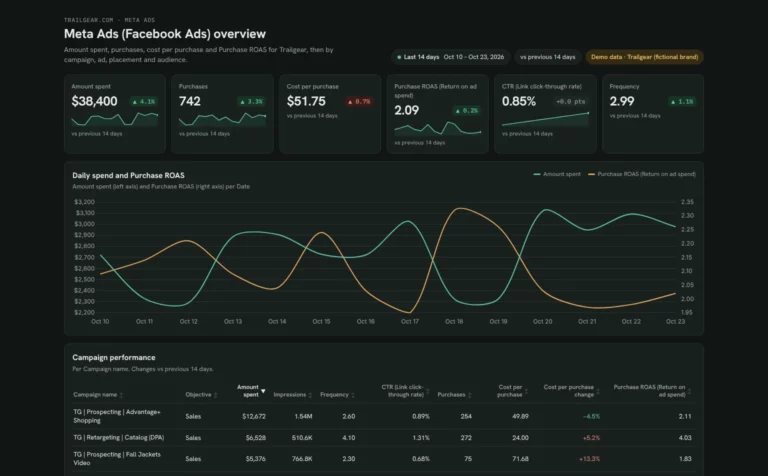 Claude
Meta Ads dashboard template
Track Meta Ads spend, ROAS and cost per purchase, and catch ad fatigue early.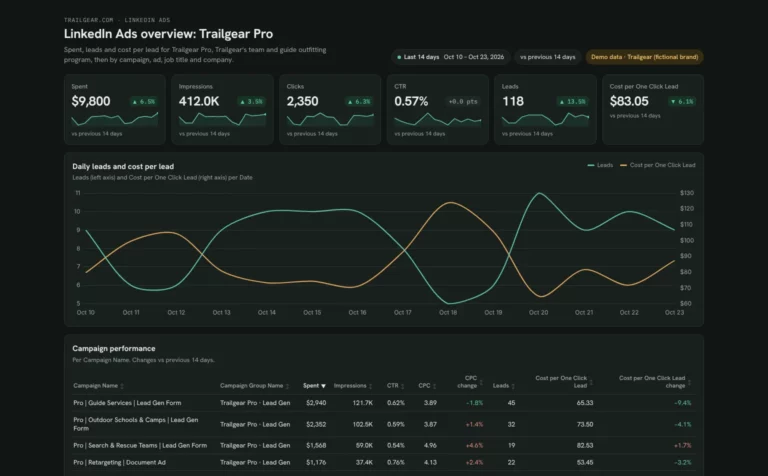 Claude
LinkedIn Ads dashboard template
Track LinkedIn Ads leads and cost per lead, and see which job titles you reach.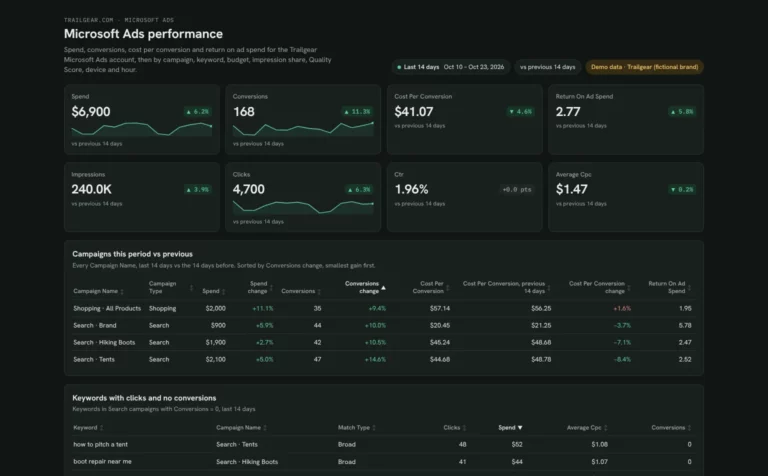 Claude
Microsoft Ads dashboard template
Find Microsoft Ads keywords that waste spend and pace campaigns against the monthly budget.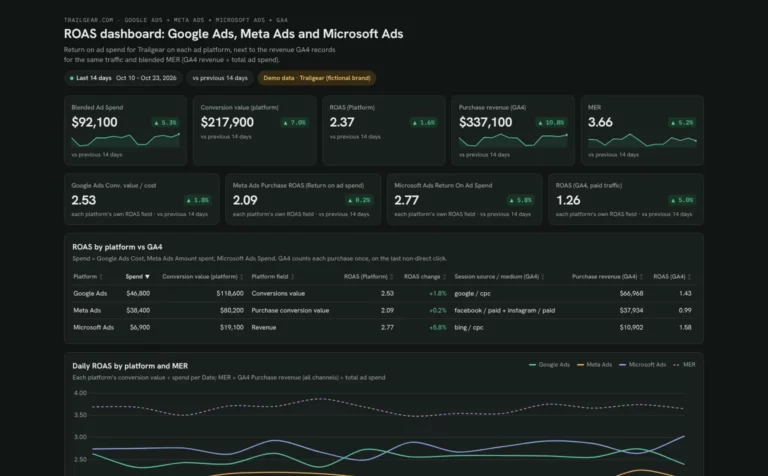 Claude
ROAS dashboard template
Check each ad platform's ROAS against GA4 revenue and find campaigns below break-even.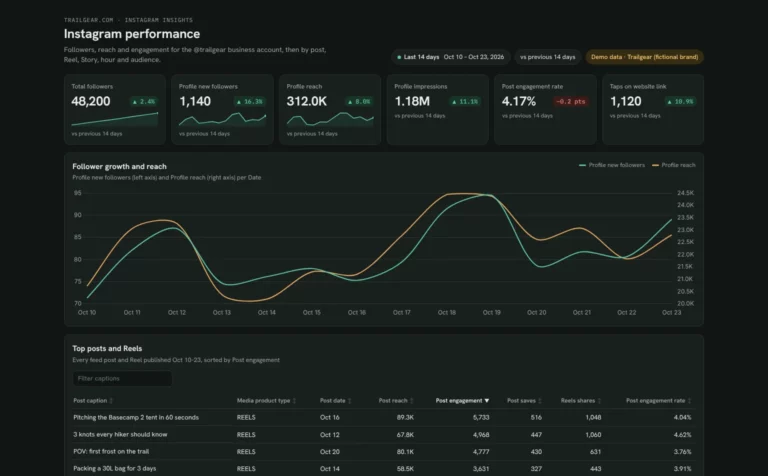 Claude

Instagram dashboard template
See which posts, Reels and Stories grow your account and when your followers are online.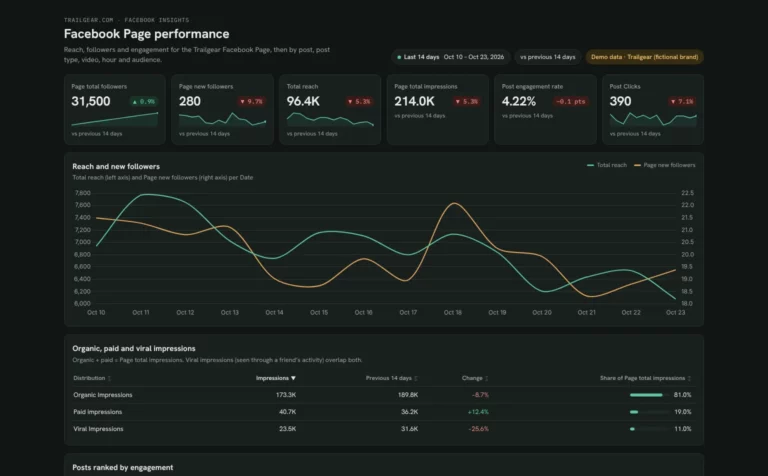 Claude

Facebook Page dashboard template
Find out why your Page reach moves and which posts and videos your followers engage with.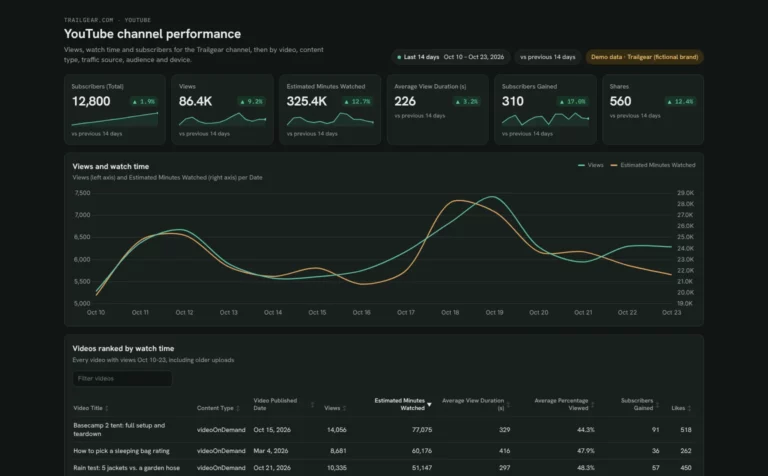 Claude

YouTube dashboard template
See which videos keep people watching and how Shorts compare to long videos.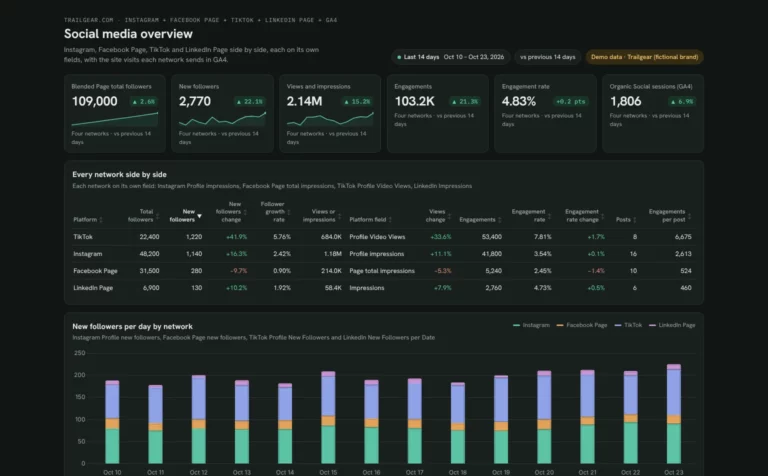 Claude

Social media dashboard template
Compare Instagram, Facebook, TikTok and LinkedIn growth, engagement and top posts.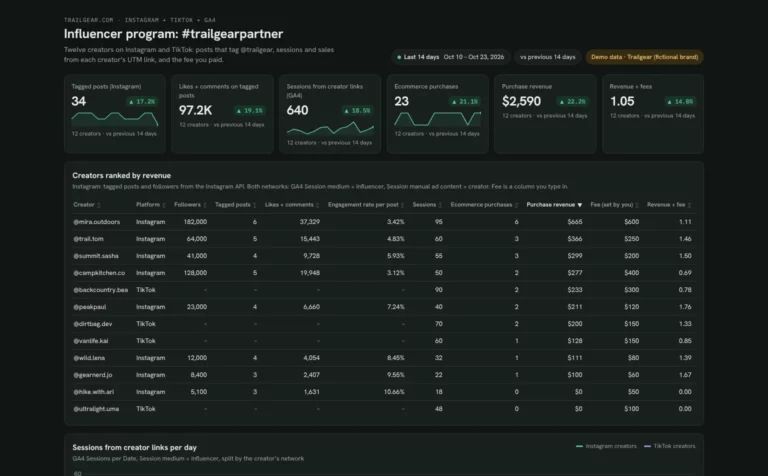 Claude
Influencer dashboard template
See which creators bring sessions and sales, and what each returns on their fee.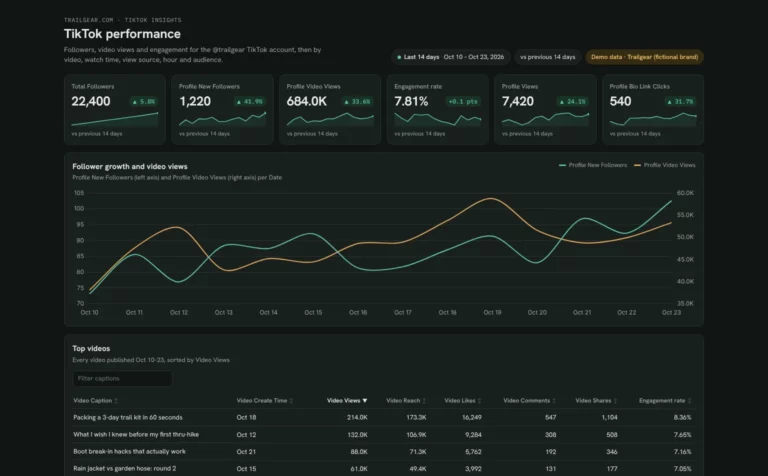 Claude
TikTok dashboard template
See which TikTok videos people finish and follow you for, and when your followers are online.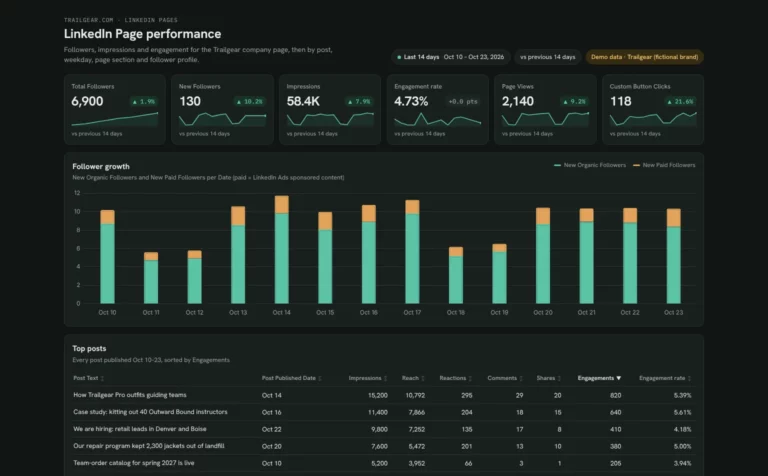 Claude
LinkedIn Page dashboard template
Track company page followers and posts, and see which job titles and industries follow you.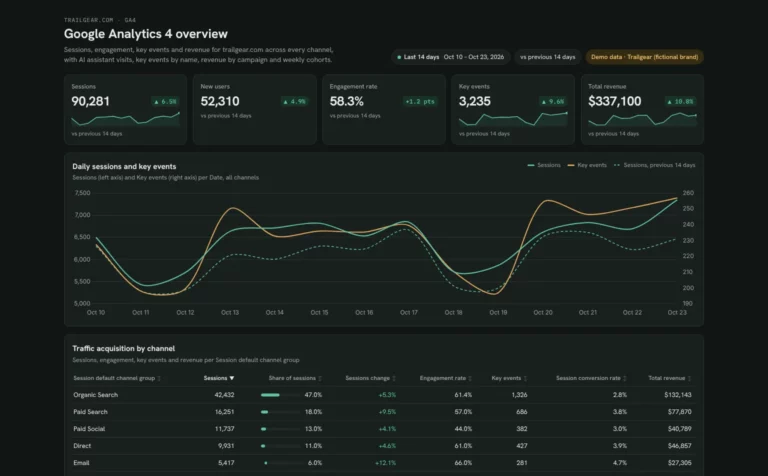 Claude
Google Analytics dashboard template
See which channels and AI assistants bring visitors, key events and revenue.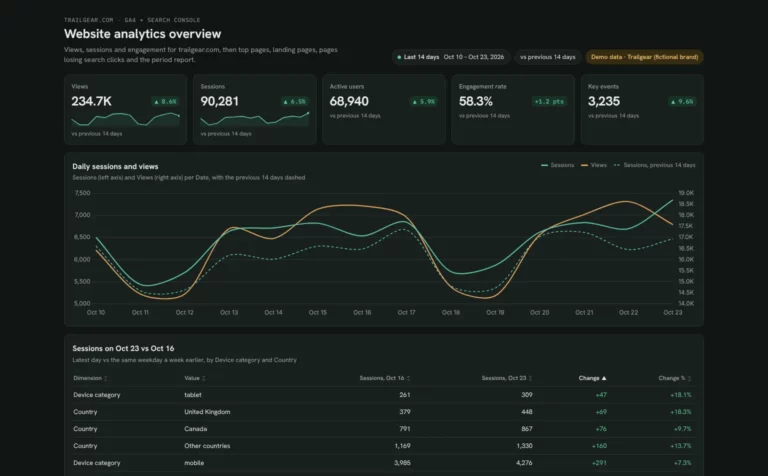 Claude
Web analytics dashboard template
See which pages win visits, which landing pages convert and which pages lose search clicks.How to use a Claude dashboard template
Connect your data in Porter, add Porter to Claude and paste a template prompt. Claude’s Dashboards feature then builds the dashboard on your data. Three steps, no code.
Connect your marketing data in Porter.
Sign up free and connect the sources the template uses, such as the Search Console connector for Claude, the GA4 connector for Claude or the Business Profile connector for Claude.
Add Porter to Claude.
In Claude, open Customize › Connectors › Add custom connector and paste
https://mcp.portermetrics.com/mcp. Then sign in to Porter and allow access. The Porter MCP for Claude tutorial shows each screen.Paste the template prompt.
Open a template page, copy its prompt and paste it into a new Claude chat, with your site in place of the one in brackets. Claude builds the dashboard. Check the query behind any number, then ask Claude to publish it as a Porter dashboard when a client needs to see it.
What you need
- Claude: Dashboards is in beta on Pro, Max, Team and Enterprise plans, per Anthropic’s guide to Claude Dashboards. On Enterprise, an owner turns it on first.
- Porter: the Free plan reads the last 15 days in AI chats. Paid plans read full history.
- Previews: the dashboards on this page are Porter demo dashboards of what you get.
Build a Google Search Console dashboard with Claude · 8:12 · Porter Metrics on YouTube ↗
More Porter videos
Claude Dashboards use caseI Built a Live Google Analytics Dashboard with ClaudeWatch on YouTube
Search Console setup · ShortHow to connect Google Search Console to ClaudeWatch on YouTube
GA4 setup · 1:40How to connect Google Analytics 4 to Claude (no code)Watch on YouTube
What to include in a Claude dashboard
A useful Claude dashboard answers one question per block. Porter’s templates follow these six blocks; use them when you write your own prompt.
KPI tiles
Clicks or key events first, each with the change against the previous period.
Daily trend
So a drop shows the day it started.
Top table
Queries, pages or locations, sorted by clicks.
One breakdown
Device, country, channel or location, to see where the change came from.
Check the query
Ask Claude for the query behind each number before you share it.
Date range
The dates shown and the period you compare against, so nobody misreads a number.
FAQ
Cost, refresh, sharing and privacy. Answers about Claude link to Anthropic’s help pages.
Is the Claude dashboard free?
Porter’s Claude dashboard templates are free, and so is Porter’s Free plan: it never expires, connects unlimited accounts and reads the last 15 days of data in Claude. That’s why every prompt asks for 14 days. Reporting starts at $12.50 per account a month billed annually, with a 14-day trial and no card (Porter pricing).
Do Claude dashboards update themselves?
Each chart in a Claude dashboard shows when its data was last refreshed, and Claude pulls current numbers from Porter whenever you ask it to update.
Can I share a Claude dashboard with a client?
Only if the client uses Claude too. Everyone you share a Claude dashboard with needs their own Claude access and their own data connection, since it reads data through the viewer’s account, not yours (Anthropic’s guide to sharing artifacts).
For a client or a team without Claude, ask Claude to publish it as a Porter dashboard: one Porter connection, a link with viewer or editor access, no Claude subscription needed, and it keeps updating. That also works on Claude Free, where Dashboards isn’t available.
What is the difference between Claude Dashboards and artifacts?
A Claude dashboard is an artifact made from Claude’s Dashboards template, so it’s saved in your Artifacts tab with everything else Claude builds. An artifact can be any page, app or chart. A dashboard is the kind made for numbers that change, and Porter’s templates are written for that format.
Are my Claude artifacts private?
Yes: Claude dashboards and other artifacts start private to you, and nothing is shared until you share it. Porter reads only the accounts you connect, and you can disconnect them in Porter at any time. Before you publish a version, swap in demo data or keep only numbers you’re cleared to show.