





Trusted by 1,600+ marketing teams and agencies


What you can do with this Google Business Profile dashboard
Five jobs this dashboard does. Click one to see its view on demo data, then paste its prompt into the same Claude chat.
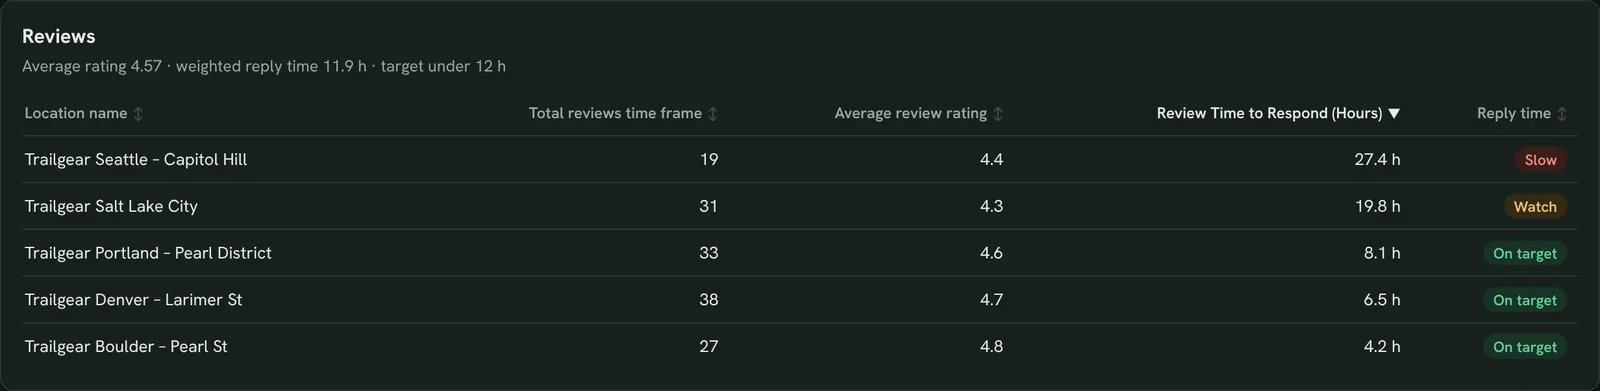
Reply to reviews faster
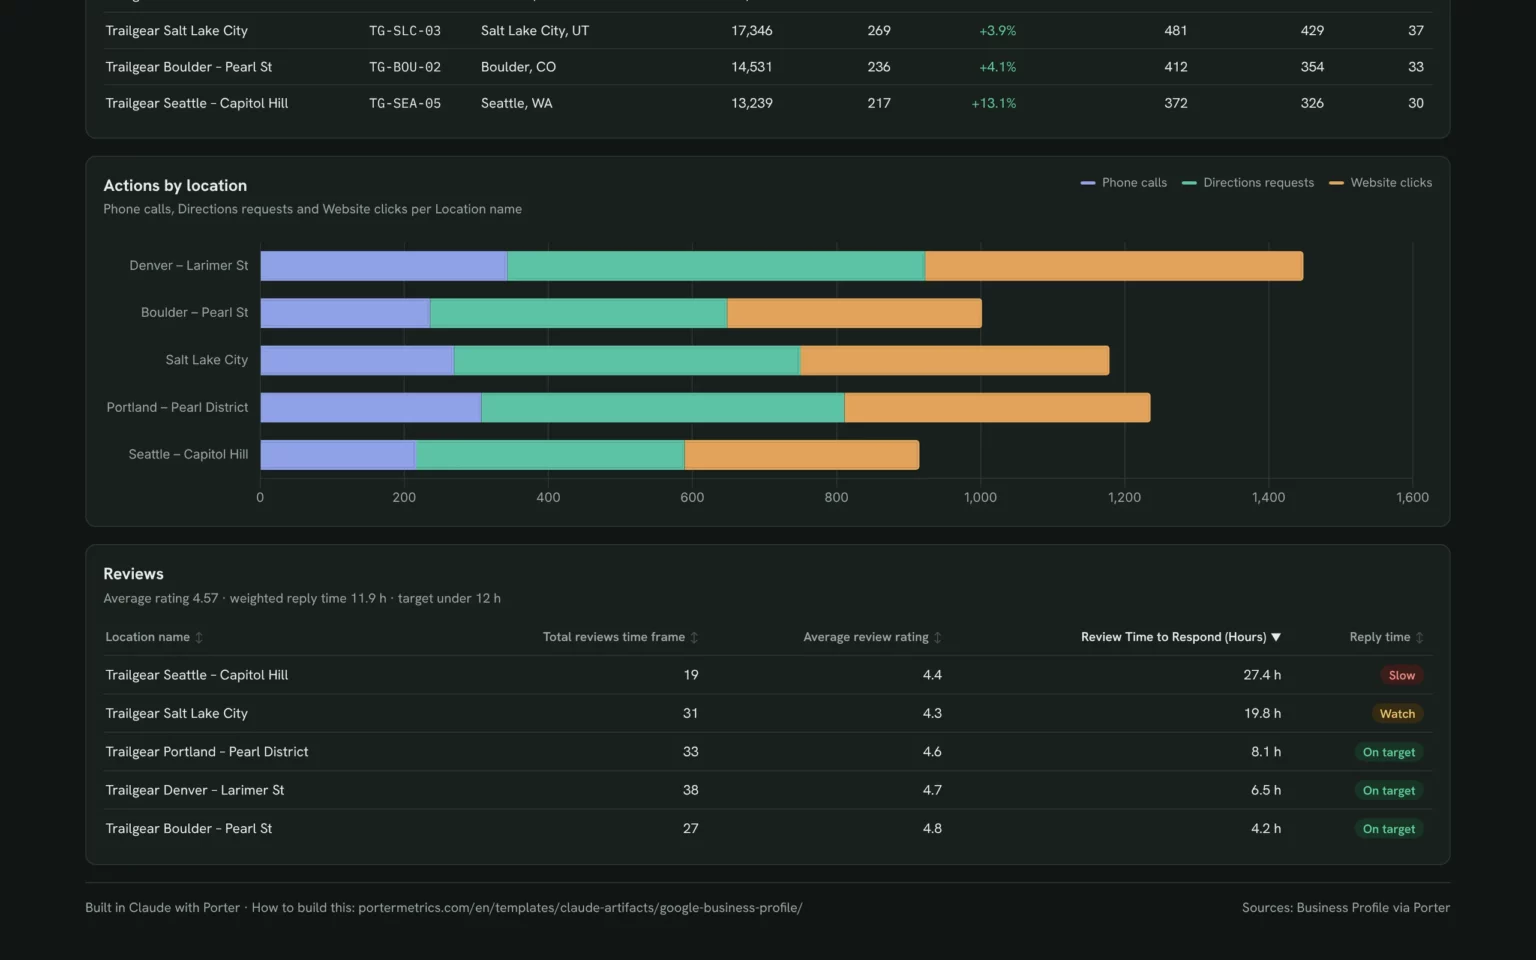
Reviews, rating and reply time for every location, so the slowest store gets answered first.
- Which locations reply to reviews too slowly?
- Where is the rating lowest?
List my locations by Review Time to Respond (Hours), slowest first, with Total reviews time frame and Average review rating next to each.Also built for this: Local SEO dashboard template
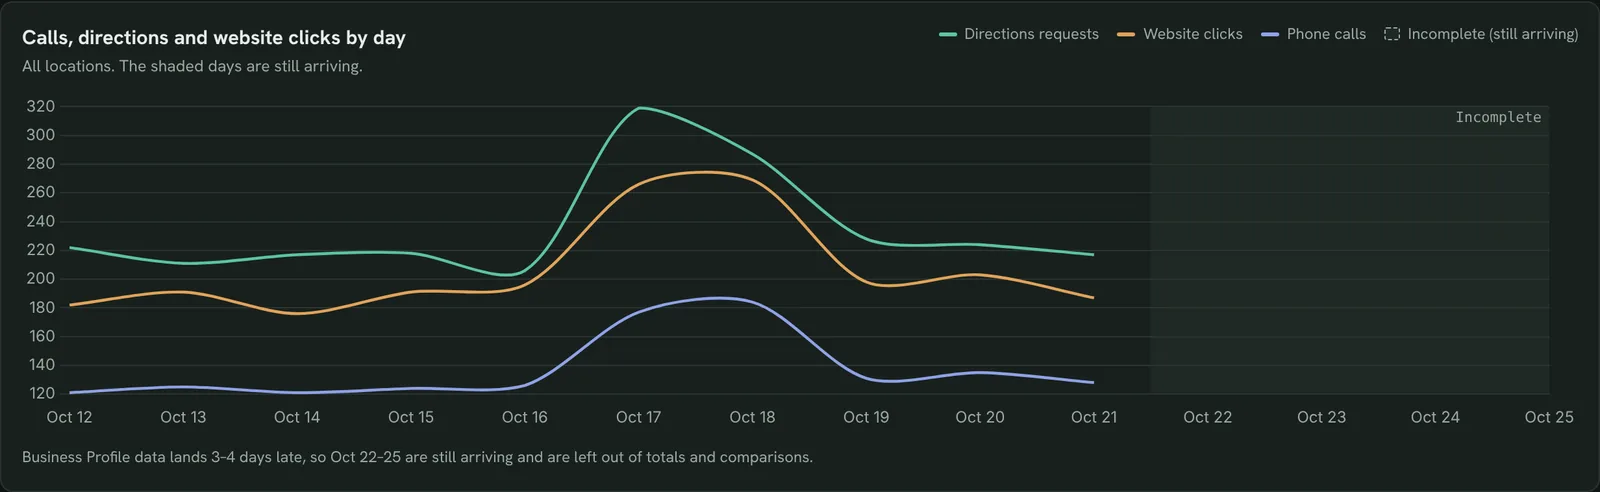
Track calls, directions and website clicks
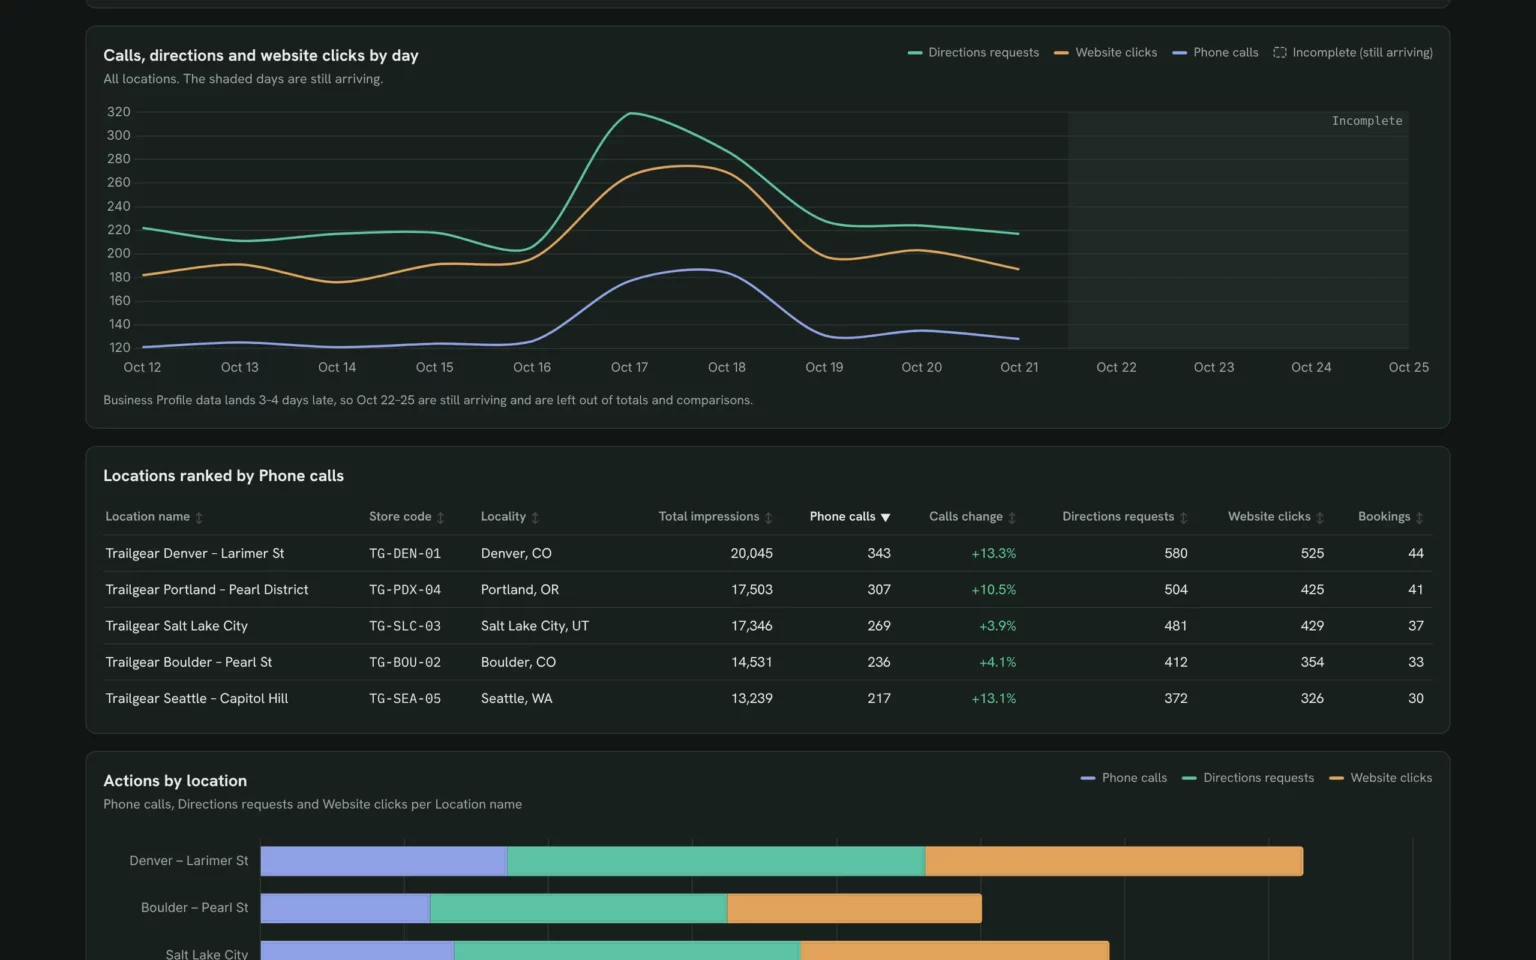
Every action customers take on your profiles, per day, so you see which days bring people in.
- Are calls and directions growing?
- Which days bring the most actions?
Show Phone calls, Directions requests and Website clicks per day for all locations for the last 14 days, and leave out the days Google is still filling in.Also built for this: Monthly SEO dashboard template

See if customers find you on Maps or Search
Impressions on Maps and Search, mobile and desktop, so you know which screen your photos and buttons must work on.
- Do people find us on Maps or in Search?
- Is mobile bigger than desktop?
For each location, show the share of Total impressions from Maps vs Search and from mobile vs desktop, and name the locations where Search brings more than half.Also built for this: Local SEO dashboard template
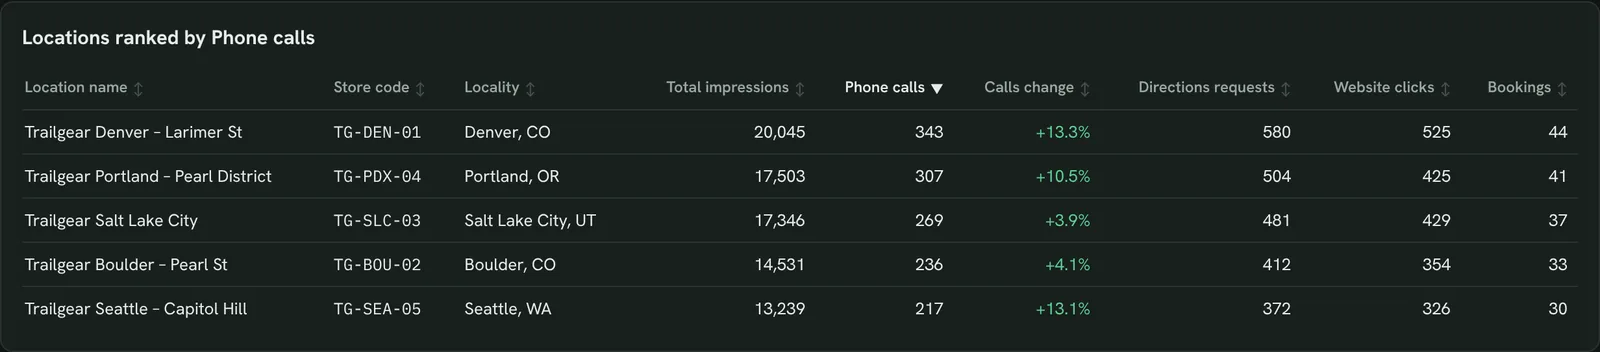
Find your busiest and quietest locations
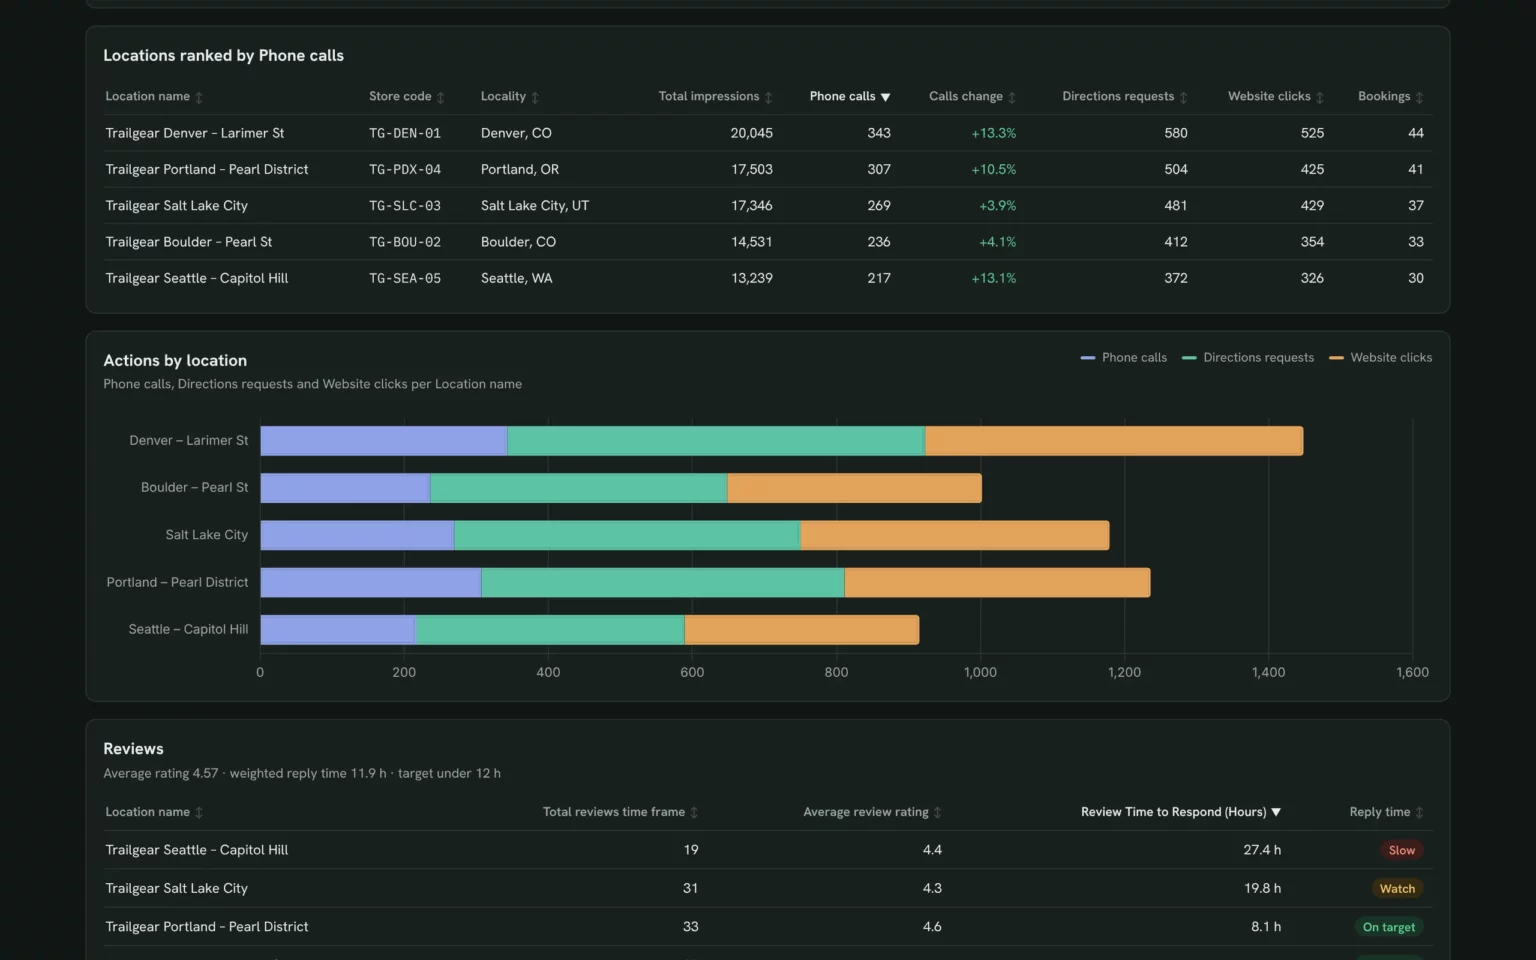
Every store ranked by calls with the change against the previous period, so a falling location stands out.
- Which location gets the most calls?
- Which store lost calls?
Rank my locations by Phone calls for the last 14 days with the change against the 14 days before, and add Directions requests, Website clicks and Bookings.Also built for this: Client SEO dashboard template
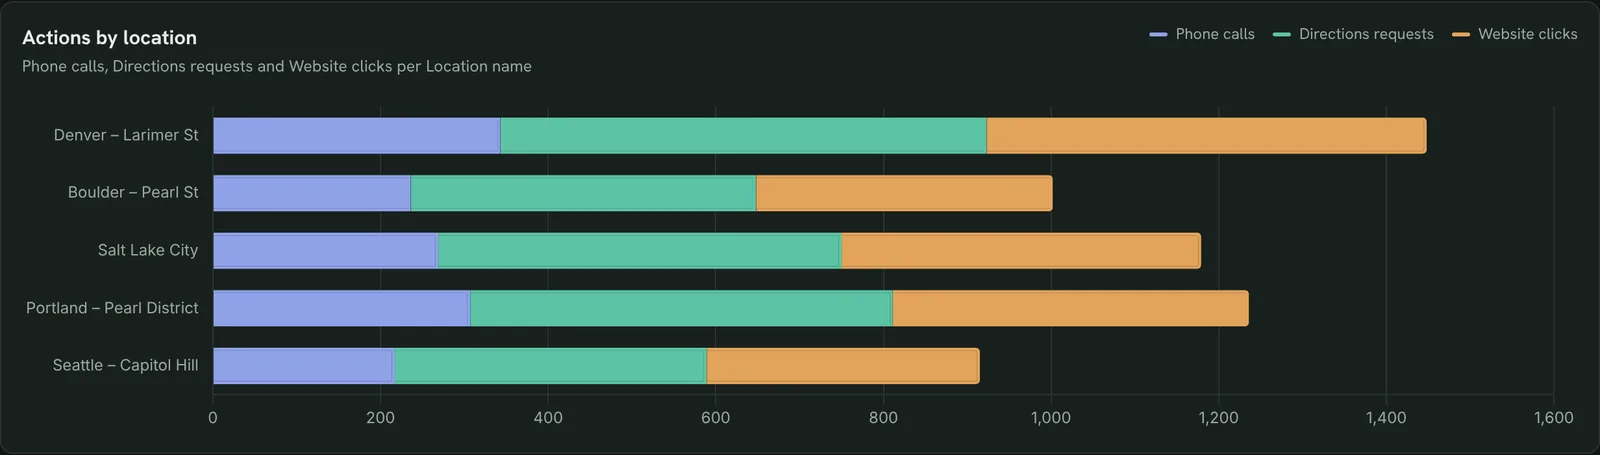
Compare what each location wins
Calls, directions and website clicks per store in one chart, so you see which action each location is best at.
- Which store gets more directions than calls?
- Where do website clicks lag?
Add Phone calls, Directions requests and Website clicks per 100 Total impressions to the location table, and sort by that rate.How to set up the Google Business Profile dashboard in Claude
You need a Business Profile you manage, a free Porter account and Claude Pro, Max, Team or Enterprise for Claude Dashboards. The whole setup takes about 8 minutes.
Connect Google Business Profile in Porter
Sign up free at Porter, open Data sources, pick Google Business Profile, sign in with Google and choose your locations. The Business Profile to Claude tutorial shows each click.
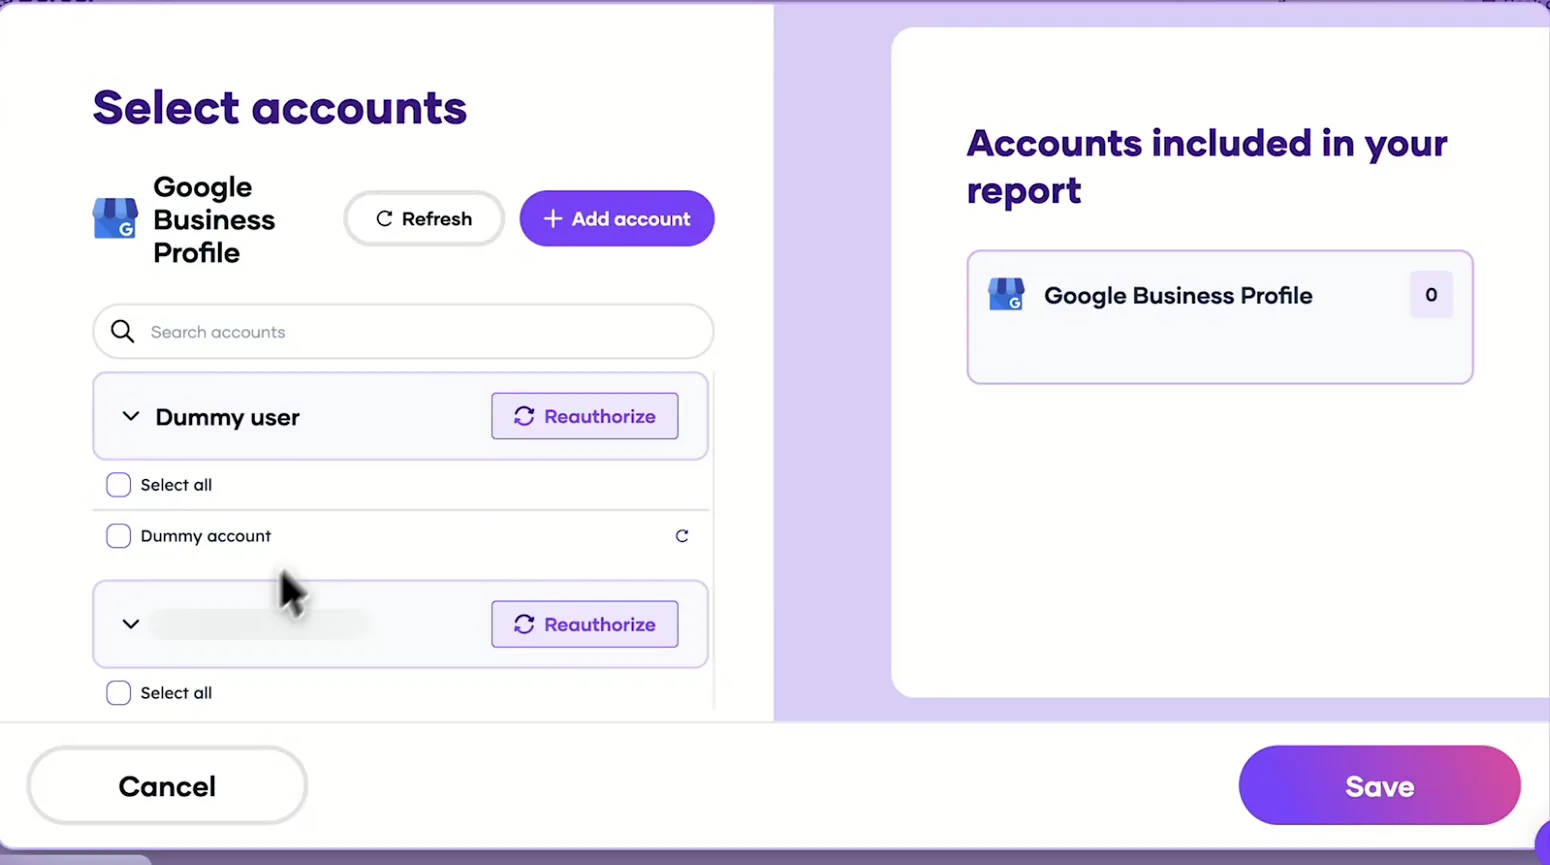
Pick the locations Claude can read, then save. Add Porter to Claude
In Claude, go to Customize → Connectors → Add custom connector, paste https://mcp.portermetrics.com/mcp and name it Porter Metrics. Click Continue, then sign in to Porter and allow access.
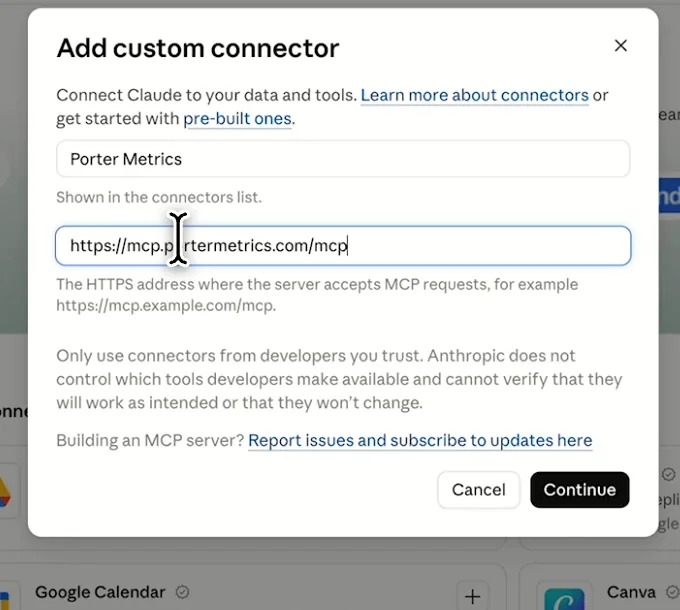
In Claude: Customize, Connectors, Add custom connector, then paste Porter’s MCP URL Paste the install prompt
Open a new chat in Claude, paste this prompt and replace the locations in brackets with yours. Claude queries your data through Porter and builds the dashboard.
Install promptDuplicate this Claude dashboard template and keep its layout, views and styling: https://claude.ai/artifact/Xv6rAeRKFmSjY2f3EUJCG6 Then rebuild it with my own data through Porter: a Google Business Profile dashboard for all my locations for the last 14 days: impressions on Maps vs Search and mobile vs desktop, calls, direction requests, website clicks and bookings by day and by location, plus new reviews, average rating and reply time. Rank locations by calls and mark the last 4 days as incomplete. Open in Claude with this prompt

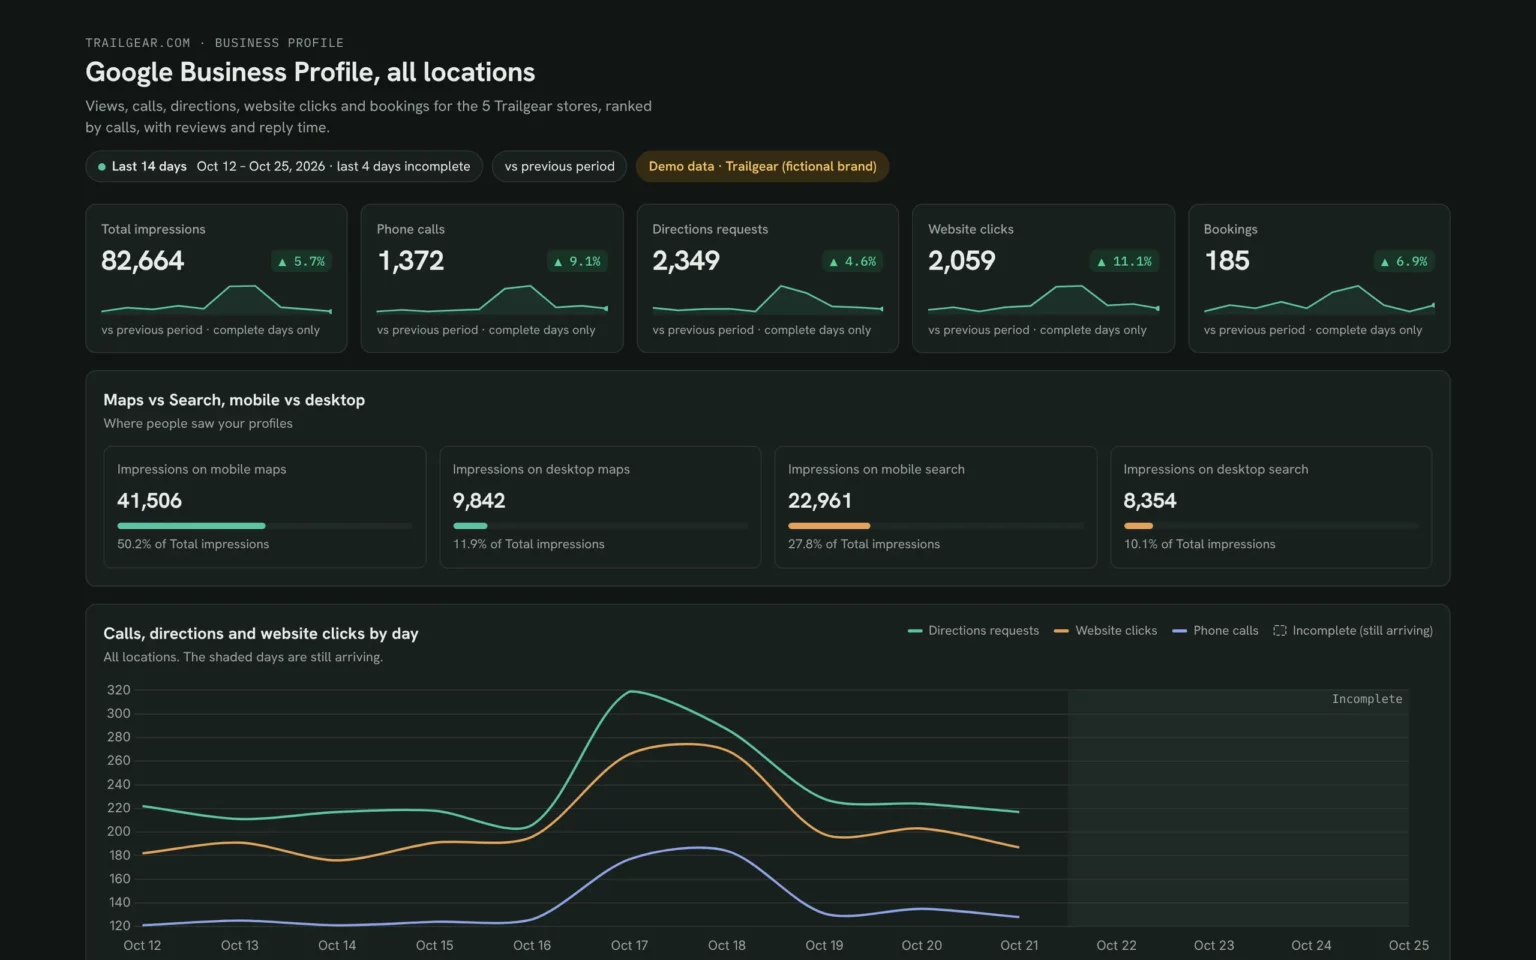
The first thing Claude builds: KPI cards for your own locations. Demo data shown.
How to connect Google Business Profile to Claude
Google Business Profile fields and data
The template uses Business Profile’s performance and review metrics for every location you manage. Porter reads 145 Business Profile fields if you need more.
Top 5 Business Profile KPIs to watch
Trailgear demo data · 5 stores · last 14 days vs the 14 before
- Total impressions82,664+5.7%
How often your profiles showed. Rising views with flat calls means the listing isn’t convincing people.
- Phone calls1,372+9.1%
The action closest to a sale. Check which store moved it, not just the total.
- Directions requests2,349+4.6%
People heading to a store. Compare weekdays and weekends to see when they come in.
- Website clicks2,059+11.1%
Clicks from the profile to your site. A store with few clicks may need a better link or offer.
- Review reply time11.9 htarget under 12 h
Fast replies show customers you listen. Fix the slowest store first.
How the numbers are calculated
- Total impressions
- Impressions on mobile and desktop maps plus impressions on mobile and desktop search.
- Actions
- Phone calls + Directions requests + Website clicks for each location.
- Actions per 100 views
- Actions ÷ Total impressions × 100, so a small store compares fairly with a big one.
- Change
- (This period − previous period) ÷ previous period. Google adds Business Profile data 3–4 days late, so those days are left out of the comparison.
- Review reply time
- Google’s Review Time to Respond in hours, averaged across locations and weighted by reviews.
Data sources
Metrics
 Total impressions
- Phone calls
- Directions requests
- Website clicks
- Bookings
- Impressions on mobile maps
- Impressions on desktop maps
- Impressions on mobile search
- Impressions on desktop search
- Total reviews time frame
- Average review rating
- Review Time to Respond (Hours)
Dimensions
- Date
- Location name
- Store code
- Locality
See all fields:Google Business Profile · 145 fields
What makes this Business Profile dashboard different
What you get that checking each profile in Google one by one can’t give you.
Ask the next question in the same chat
See a store slip, then ask Claude which action fell and since when, without exporting anything.
Answer reviews without switching tools
The same Porter connection can reply to reviews in bulk, so a slow store gets answered from the chat.
See profile clicks next to site results
Add Search Console or GA4 and each location’s website clicks sit next to what its page did.
Give each manager their own view
Publish it as a Porter dashboard: managers get view access and chosen teammates edit, with no per-seat fee.
Send clients a report on your logo
With white label, the Porter dashboard carries your agency’s logo, not a third-party tool’s.
Skip the CSV downloads
A refresh pulls the latest days Google has published, so nobody exports location reports by hand.
What the dashboard includes
- KPI cards for impressions, calls, directions, website clicks and bookings against the previous period
- Maps vs Search and mobile vs desktop impressions
- A daily actions trend that marks the days Google is still filling in
- Every location ranked by calls, with the change
- Actions per location in one chart
- Reviews, rating and reply time per location
Related dashboard templates
 Claude

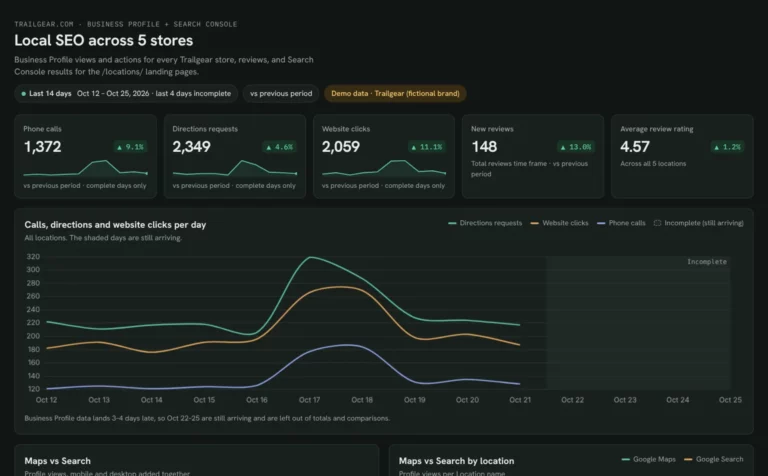
Local SEO dashboard template
Compare calls, directions and website clicks for every location.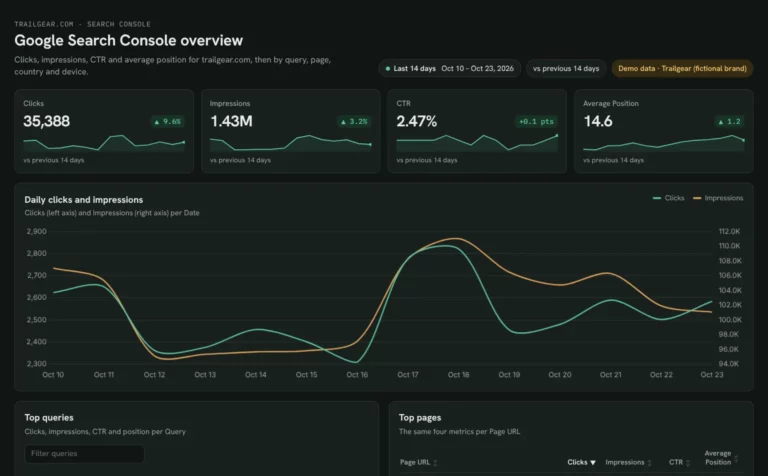 Claude
Google Search Console dashboard template
Find queries close to page one and fix low CTR by page and device.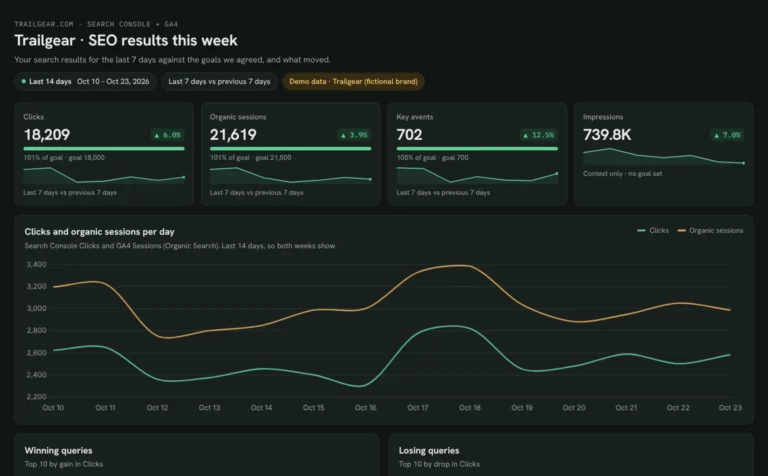 Claude

Client SEO dashboard template
Report clicks, sessions and key events against each client’s goals.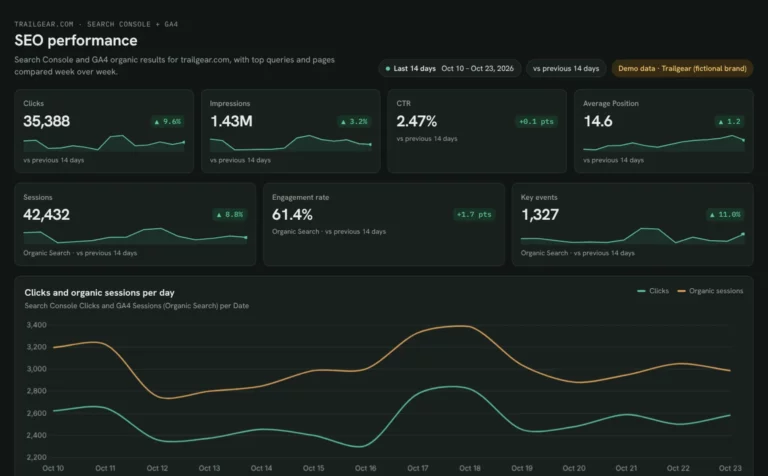 Claude
SEO dashboard template
See which Search Console clicks turn into GA4 sessions and key events.Browse more Claude dashboard templates
 Data Studio
 Google Sheets
 ChatGPT
Get your free Business Profile dashboard
Sign up free, connect Business Profile and paste the prompt. Your own locations fill the same layout as the demo.
Free plan · 14-day trial · No card needed