





Trusted by 1,600+ marketing teams and agencies


What you can do with this YouTube dashboard
Click a job to see it on demo data, then paste its prompt into Claude.
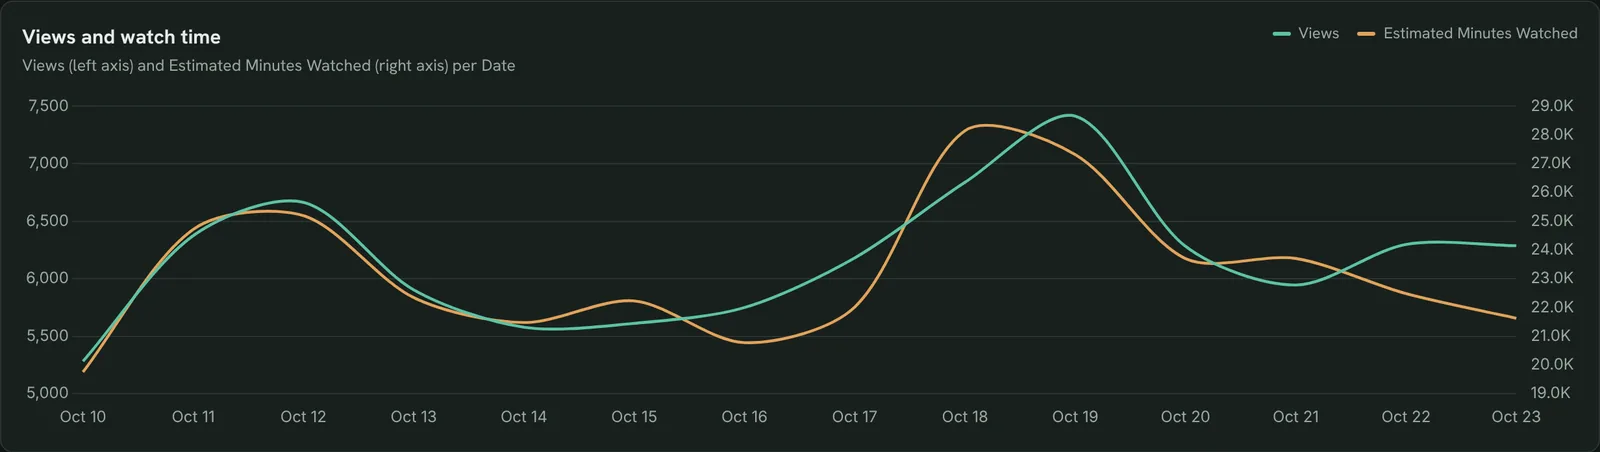
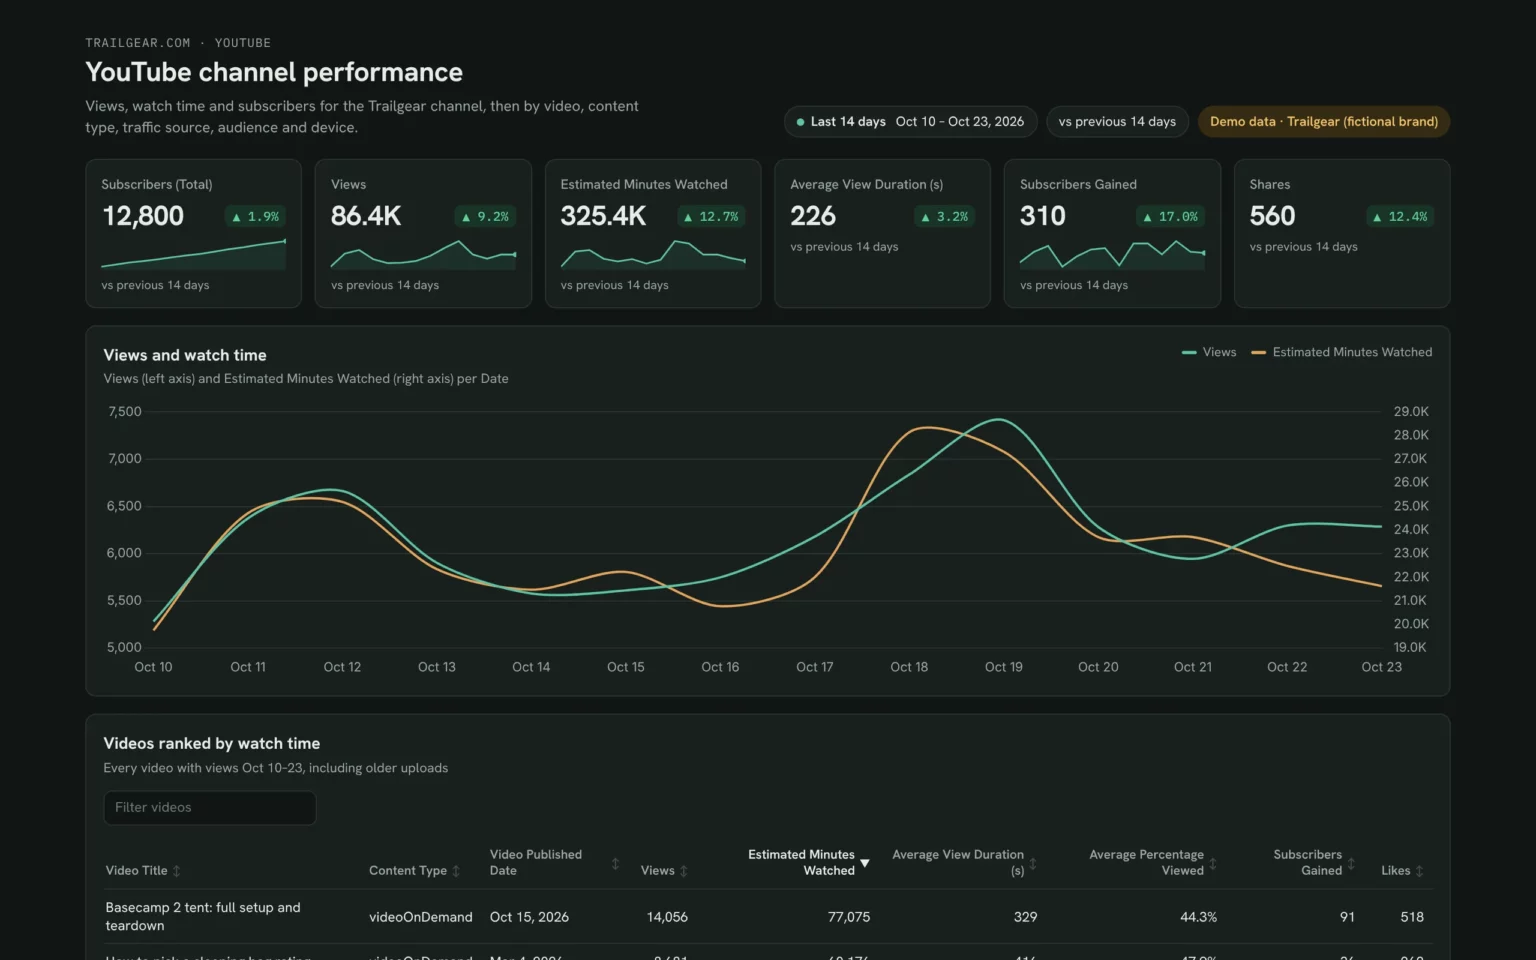
Track views, watch time and subscribers
Views and minutes watched by day, so you see what an upload did to the whole channel.
- Did the new upload lift watch time?
- Are views and minutes moving together?
Chart Views and Estimated Minutes Watched per day for the last 14 days.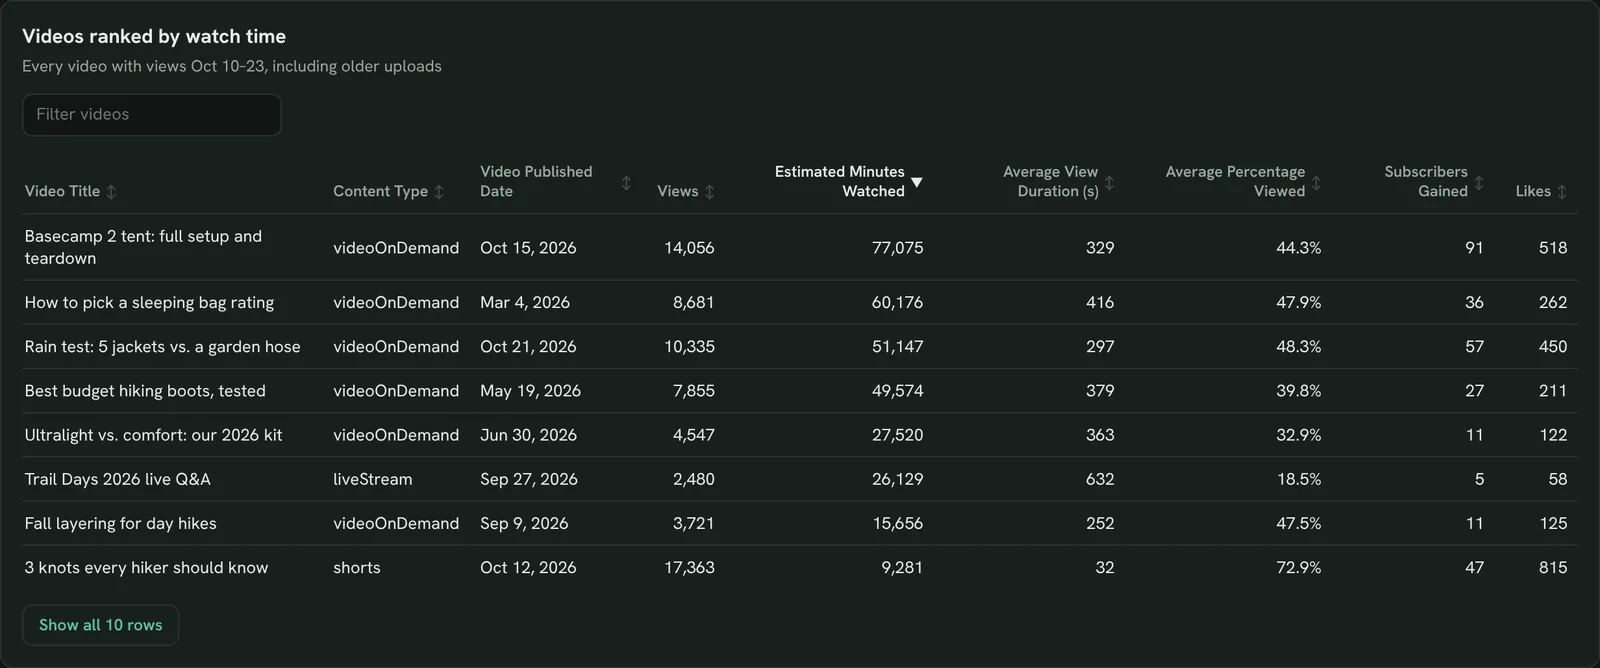
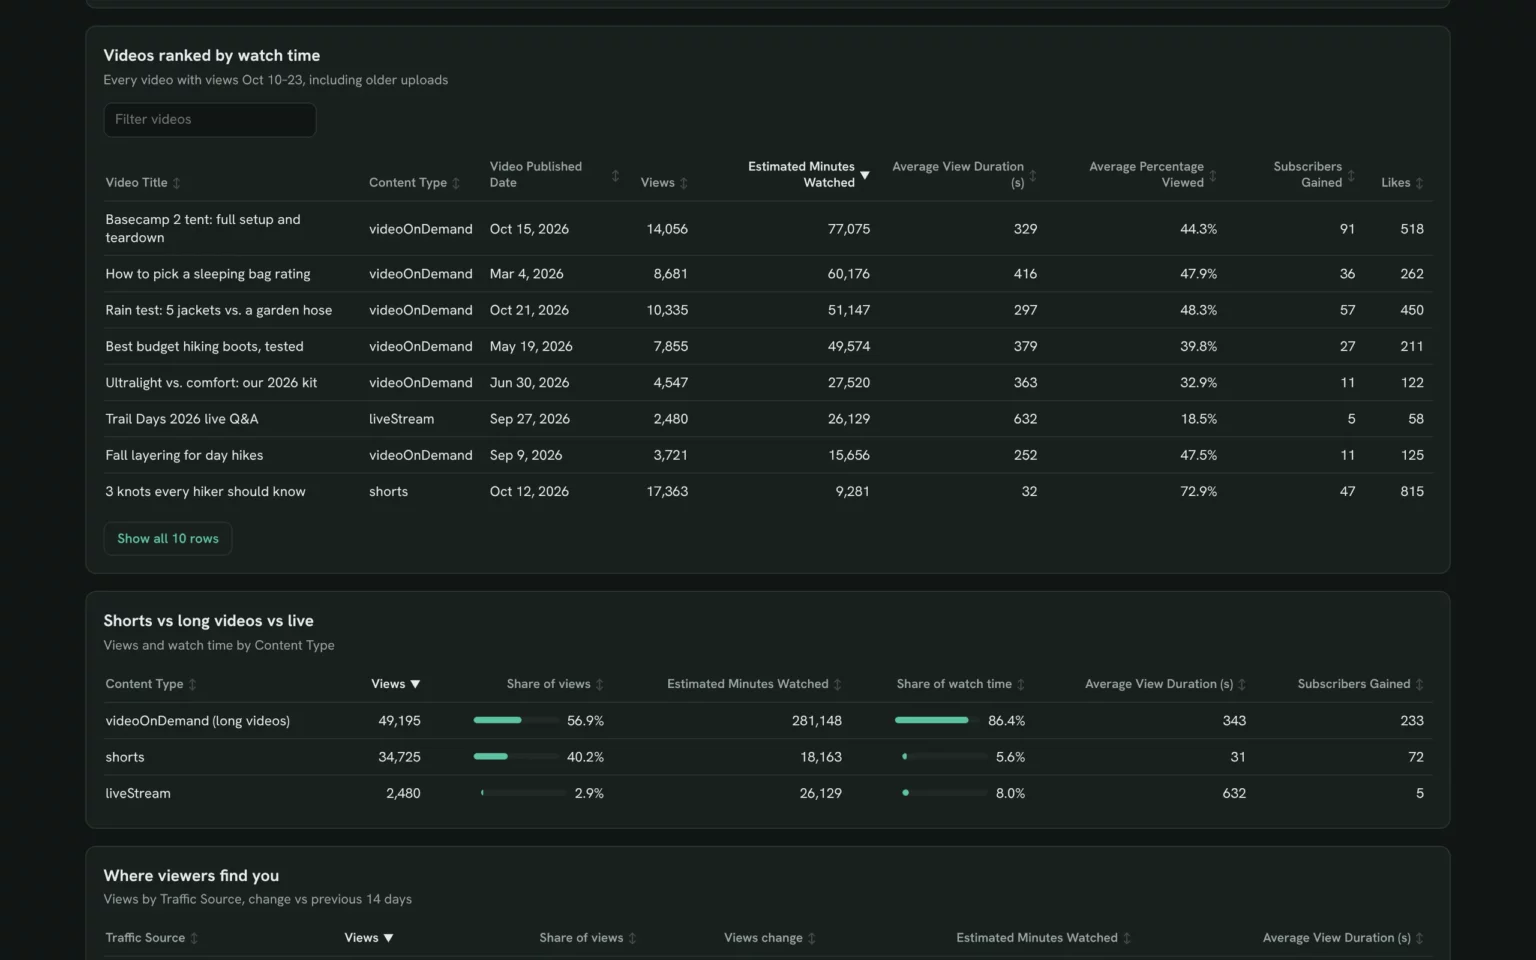
Find the videos that hold attention
Every video ranked by watch time with average view duration, so you know which topics keep people watching.
- Which older videos still earn watch time?
- Which video has the best Average Percentage Viewed?
List my YouTube videos with views in the last 14 days, with Views, Estimated Minutes Watched, Average View Duration (s), Average Percentage Viewed and Subscribers Gained.
Compare Shorts, long videos and live
Views and watch time by content type, so you see whether Shorts bring views but long videos bring the minutes.
- What share of watch time comes from Shorts?
- Which type brings subscribers?
Show Views, Estimated Minutes Watched and Subscribers Gained by Content Type for the last 14 days.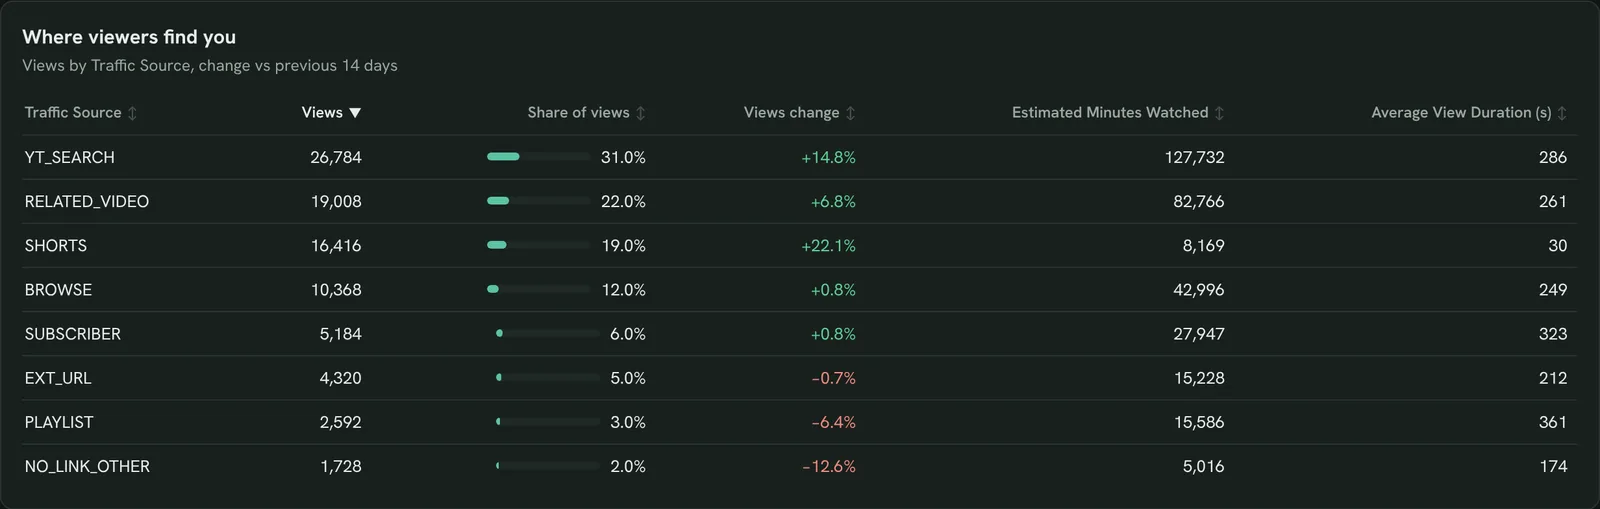
See where viewers find you
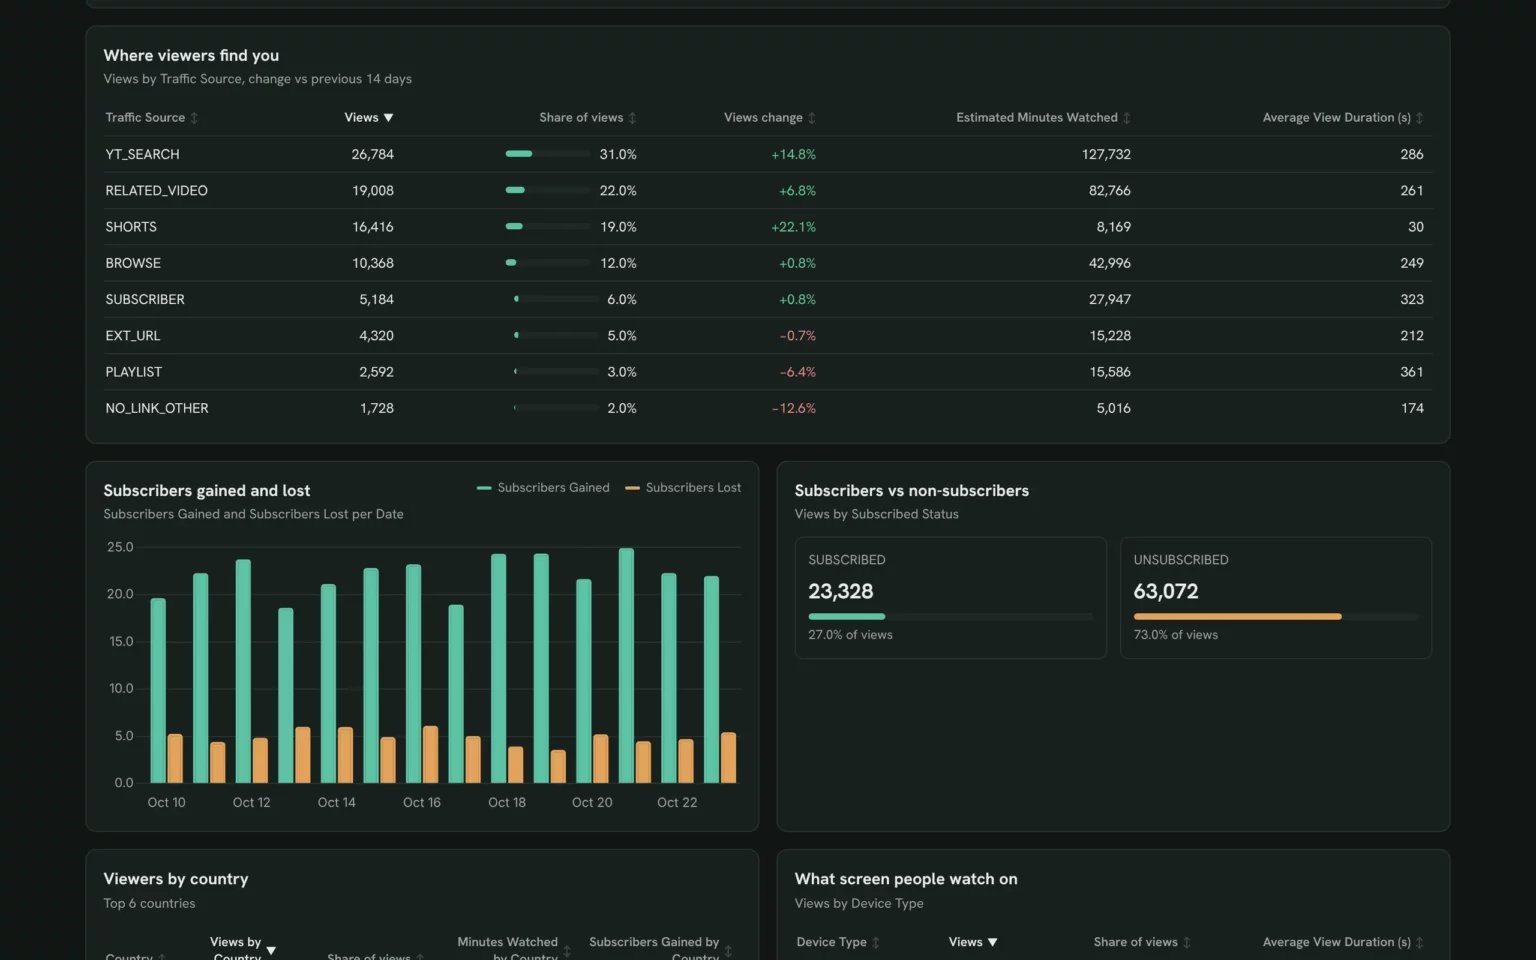
Views by traffic source against the 14 days before, so you know whether search, suggestions or Shorts grew.
- How much comes from YouTube search?
- Which source dropped?
Show Views and Estimated Minutes Watched by Traffic Source for the last 14 days, with the change vs the 14 days before.Also built for this: Google Search Console dashboard template
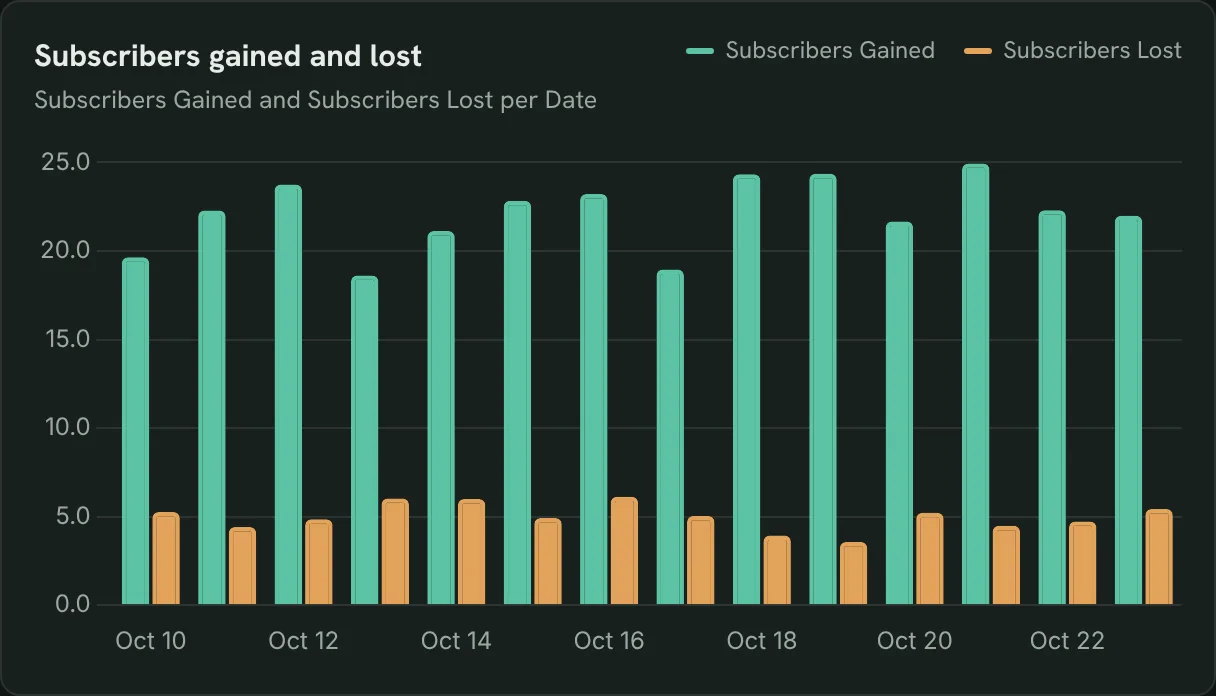
Track subscribers gained and lost
Subscribers gained next to subscribers lost by day, so a spike in losses stands out next to the upload that caused it.
- Which day lost the most subscribers?
- Did an upload bring new subscribers?
Chart Subscribers Gained and Subscribers Lost per day for the last 14 days.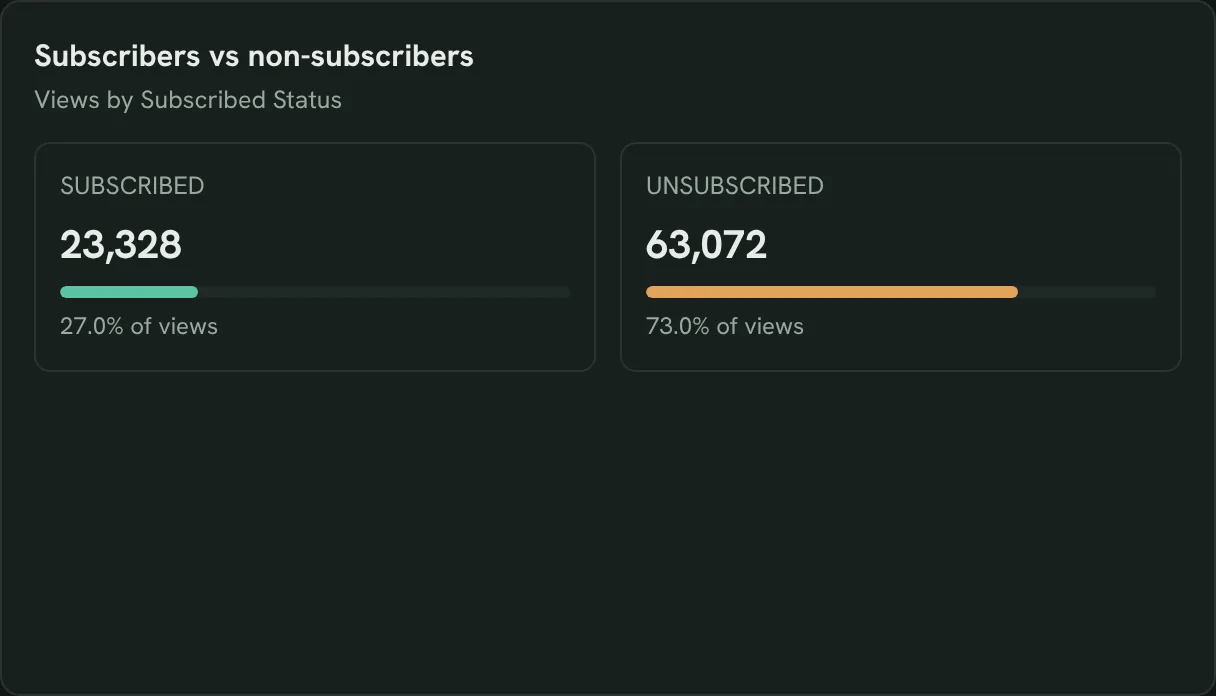
See if subscribers still watch
Views from subscribers and non-subscribers, so you know whether you reach new people or your base.
- What share of views comes from subscribers?
- Are new viewers finding the channel?
Show Views and Estimated Minutes Watched by Subscribed Status for the last 14 days.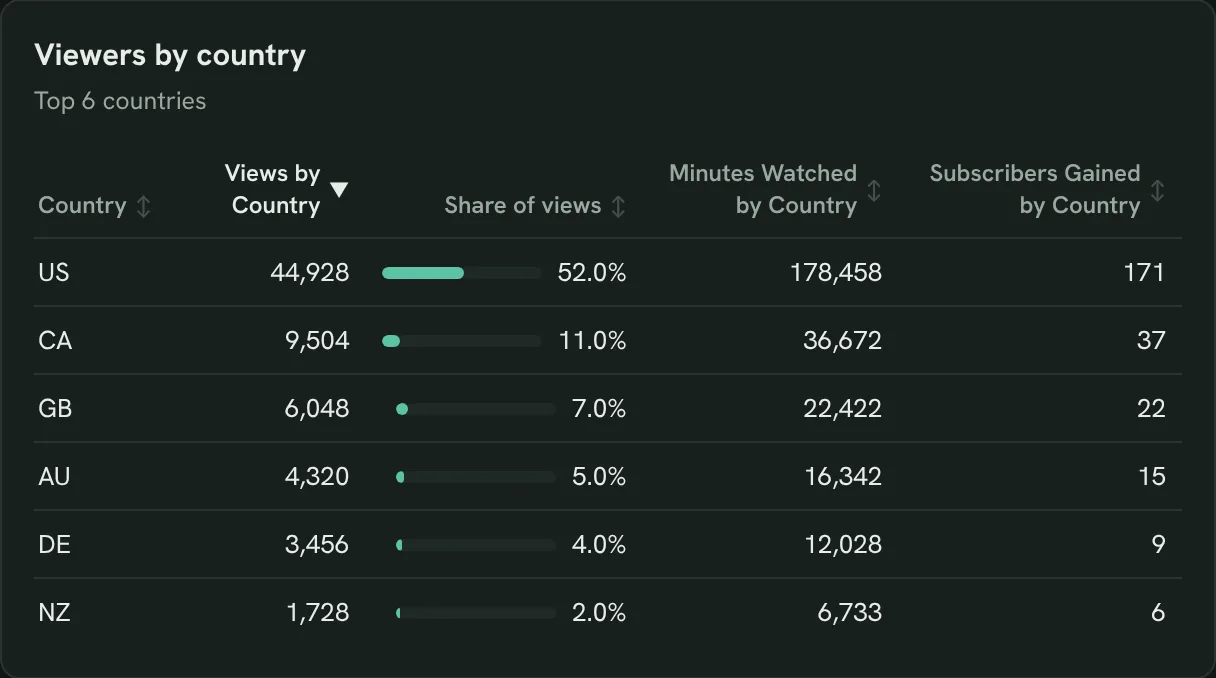
See which countries watch longest
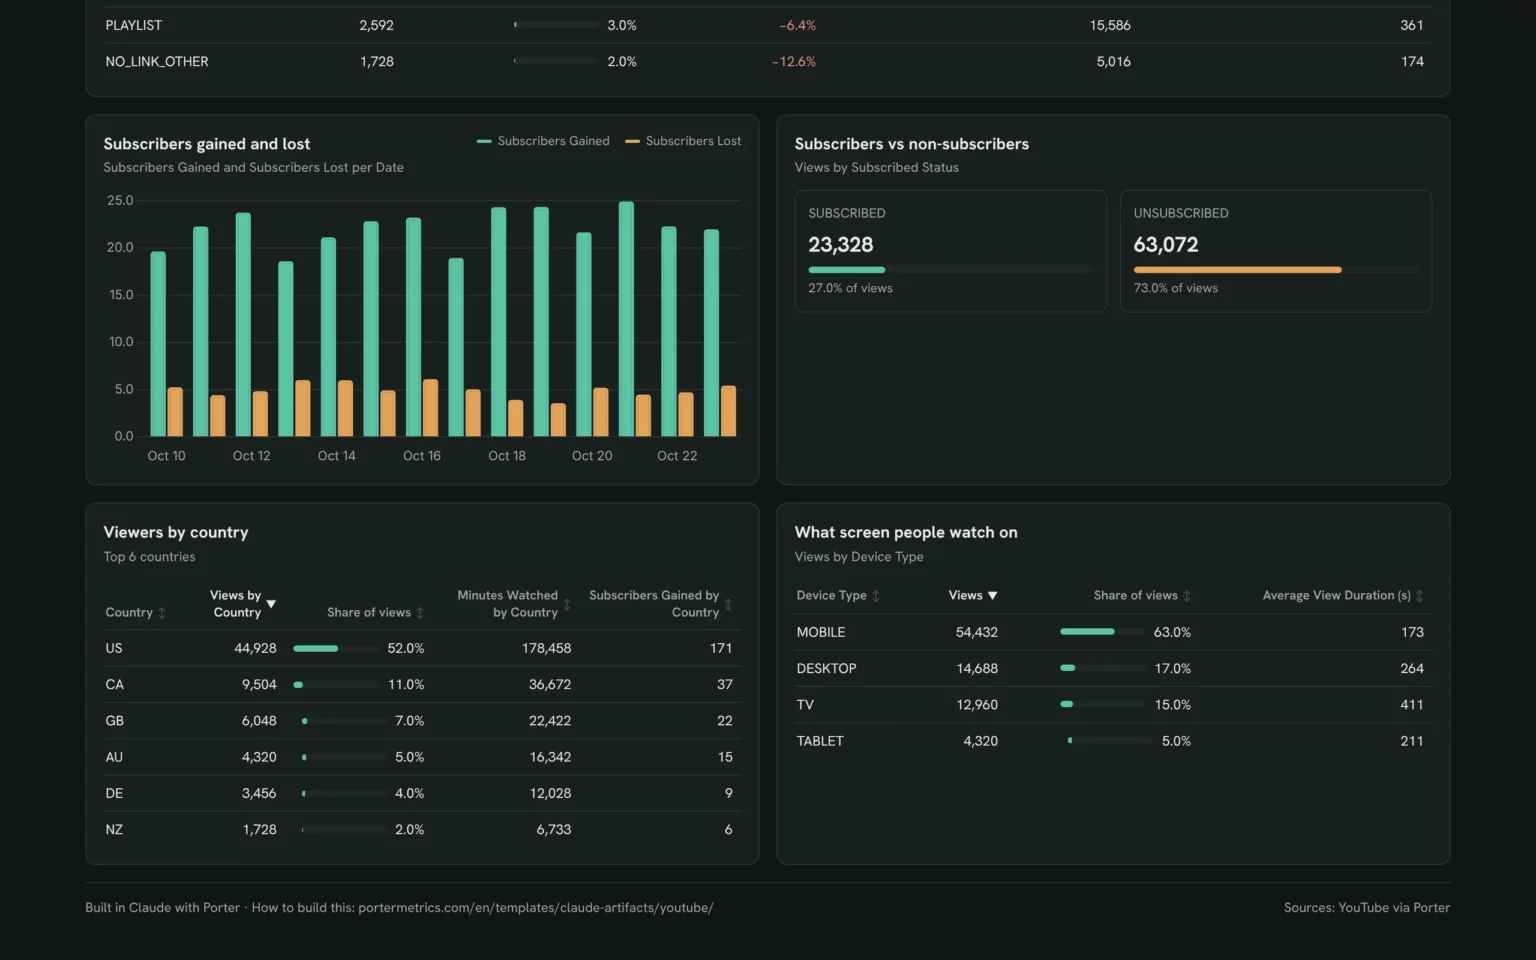
Views, minutes and new subscribers by country, so you plan topics and upload times for your real audience.
- Which country watches the most minutes?
- Where do new subscribers come from?
Show Views by Country, Minutes Watched by Country and Subscribers Gained by Country for the last 14 days, top 10.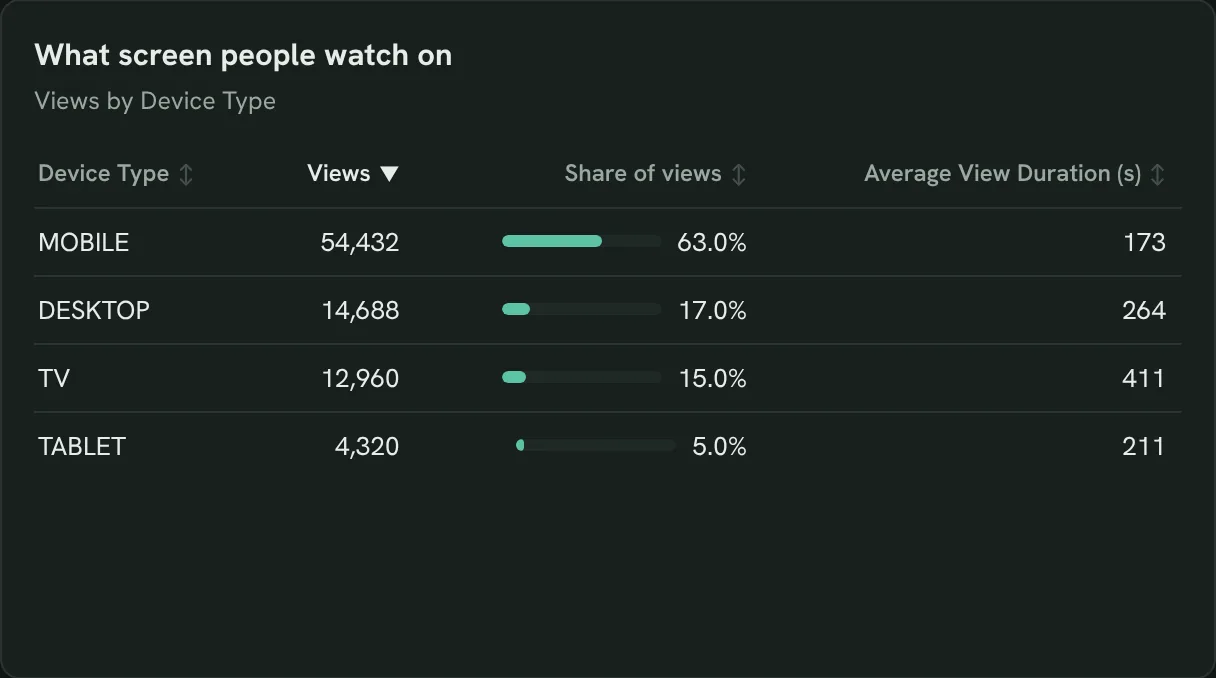
Check what screen people watch on
Views and view duration by device, so you know whether to design for phones or TVs.
- How much is watched on TV?
- Do mobile viewers leave sooner?
Show Views and Average View Duration (s) by Device Type for the last 14 days.Also built for this: Instagram dashboard template
How to set up the YouTube dashboard in Claude
You need access to a YouTube channel, a free Porter account and a paid Claude plan. Setup takes about 10 minutes.
Connect YouTube in Porter
Sign up free at Porter, pick YouTube, sign in with the Google account that owns the channel and pick Claude as the destination. The YouTube fields list shows what Porter reads.
Add Porter to Claude
In Claude, go to Customize → Connectors → Add custom connector, paste https://mcp.portermetrics.com/mcp and name it Porter Metrics. Then sign in to Porter and allow access.
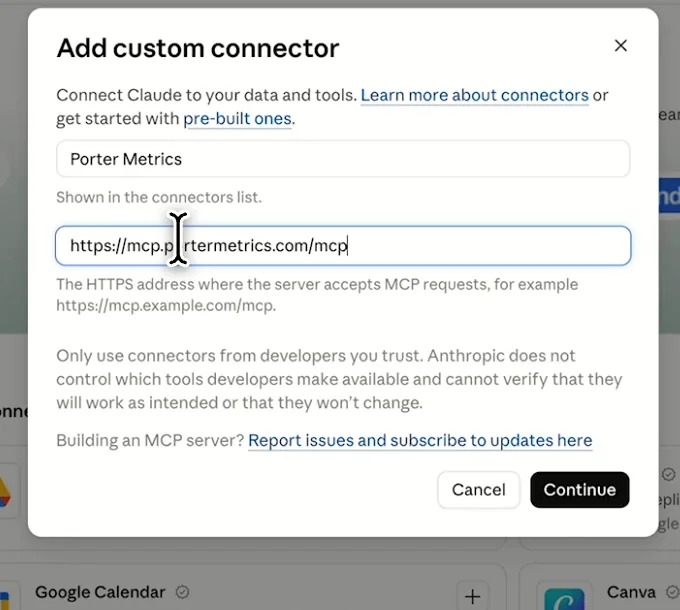
In Claude: Customize, Connectors, Add custom connector, then paste Porter’s MCP URL Paste the install prompt
Paste this prompt into a new chat and swap in your channel. The Free plan covers 14 days; the trial adds comparisons. YouTube adds the last 2 to 3 days later.
Install promptDuplicate this Claude dashboard template and keep its layout, views and styling: https://claude.ai/artifact/U4eGHA2K9L9SjHyF5qe8Wu Then rebuild it with my own data through Porter: a YouTube dashboard for [channel] for the last 14 days: KPI cards for Subscribers (Total), Views, Estimated Minutes Watched, Average View Duration (s), Subscribers Gained and Shares; daily Views and Estimated Minutes Watched; every video by Video Title with Content Type, Video Published Date, Views, Estimated Minutes Watched, Average View Duration (s), Average Percentage Viewed, Subscribers Gained and Likes; Views and minutes by Content Type; Views and minutes by Traffic Source; daily Subscribers Gained and Subscribers Lost; Views by Subscribed Status; Views by Country, Minutes Watched by Country and Subscribers Gained by Country; and Views and Average View Duration (s) by Device Type. Open in Claude with this prompt

The first thing Claude builds: KPI cards for your own channel. Demo data shown.
How to connect Instagram to Claude (no code)
YouTube fields and data
The template uses 20 of the 34 YouTube fields Porter reads, such as Playback Location or YouTube Premium Views.
Top 5 YouTube KPIs to watch
Trailgear demo data · last 14 days vs the 14 before
- Estimated Minutes Watched325.4K+12.7%
Watch time grows the channel more than views; check which videos earn it.
- Average View Duration (s)226+3.2%
A drop on a new upload points to the opening, not the topic.
- Subscribers Gained310+17.0%
Read it next to Subscribers Lost; net growth is what counts.
- Views86.4K+9.2%
Views up with flat minutes usually means Shorts, not long videos, grew.
- Shares560+12.4%
Videos people share bring viewers from outside YouTube. Make more on those topics.
How the numbers are calculated
- Watch time (hours)
- Estimated Minutes Watched ÷ 60.
- Average View Duration (s)
- Seconds watched ÷ Views, as YouTube reports it.
- Net subscribers
- Subscribers Gained − Subscribers Lost.
- Share of views
- Views for the row ÷ all Views.
- Change
- (This period − previous) ÷ previous.
Data sources
Metrics
 Subscribers (Total)
- Subscribers Gained
- Subscribers Lost
- Views
- Estimated Minutes Watched
- Average View Duration (s)
- Average Percentage Viewed
- Likes
- Shares
- Views by Country
- Minutes Watched by Country
- Subscribers Gained by Country
Dimensions
- Date
- Video Title
- Video Published Date
- Content Type
- Traffic Source
- Subscribed Status
- Country
- Device Type
See all fields:YouTube · 34 fields
What makes this YouTube dashboard different
YouTube Studio shows one tab at a time. This puts videos, sources and audience on one link you can question from the chat.
Ask why watch time dropped in the same chat
Ask Claude which video or source caused it.
See the site visits YouTube sends
Add GA4 to see sessions and sales from YouTube.
Read Shorts and long videos apart
Views and minutes split by content type on one screen.
Compare any two periods
Set any range against the one before or last year.
Send clients a report on your logo
Email it with your logo on a schedule.
Share it without Studio access
Anyone with the link sees it, no channel role needed.
What the dashboard includes
- Six KPI cards
- Daily views and watch time
- Every video ranked by watch time
- Shorts vs long videos vs live
- Views by traffic source
- Subscribers gained and lost
- Subscribers vs non-subscribers
- Country and device
- Share by link, PDF or email
Related dashboard templates
 Claude

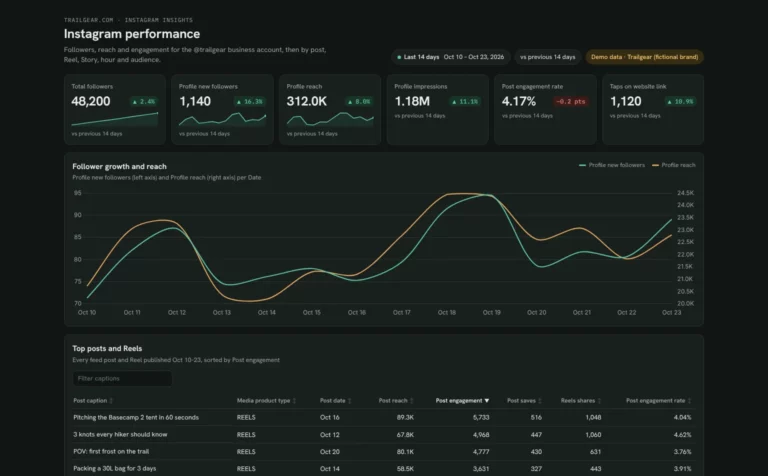
Instagram dashboard template
See which posts, Reels and Stories grow your account and when your followers are online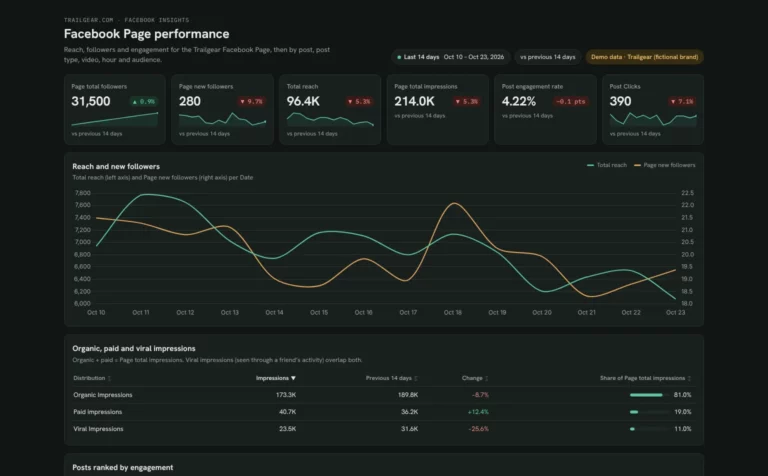 Claude

Facebook Page dashboard template
Find out why your Page reach moves and which posts and videos your followers engage with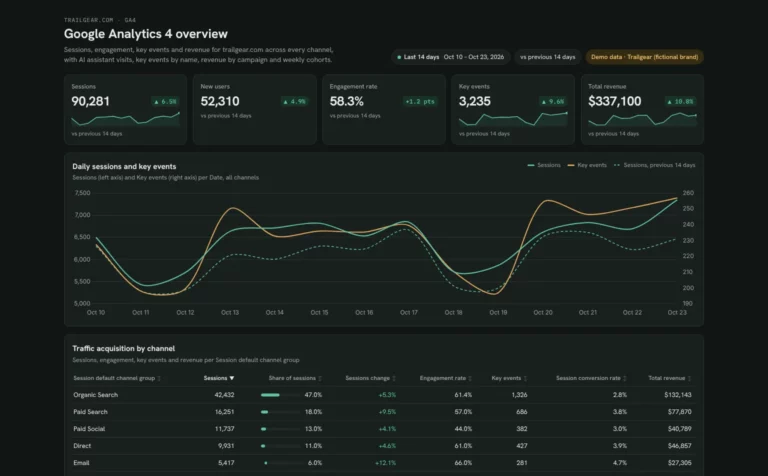 Claude

Google Analytics dashboard template
See which channels and AI assistants bring visitors, key events and revenue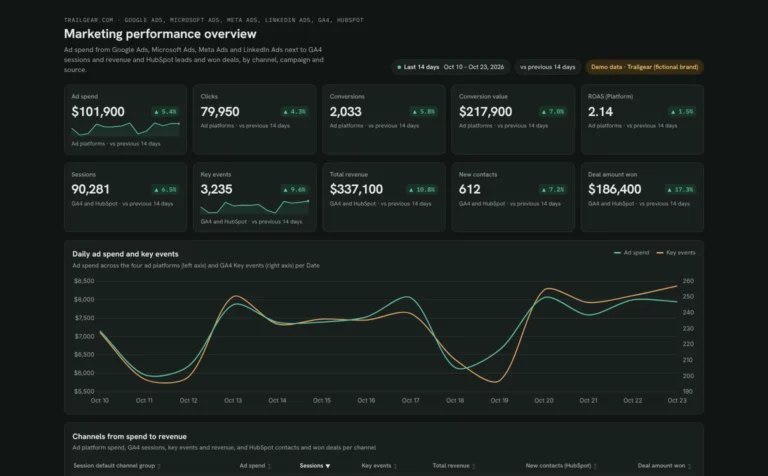 Claude


Marketing dashboard template
See which channels turn ad spend into leads, won deals and revenueBrowse more Claude dashboard templates
Get the YouTube template in other tools
 Data Studio
 Google Sheets
Get your free YouTube dashboard
Connect your channel and paste the prompt. Your videos fill the same layout.
Free plan · 14-day trial · No card needed