





Trusted by 1,600+ marketing teams and agencies


What you can do with this local SEO dashboard
Six jobs this dashboard does. Click one to see its view on demo data, then paste its prompt into the same Claude chat.
Find your busiest and quietest locations
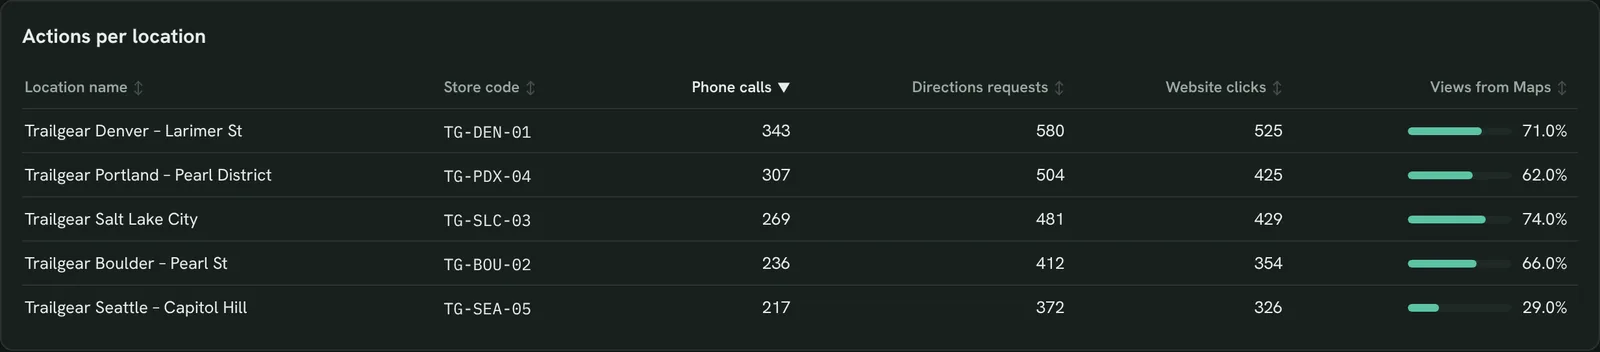
Calls, directions and website clicks for every store side by side, so you know where to spend time first.
- Which location gets the most calls and directions?
- Which store is falling behind?
Rank my locations by Phone calls for the last 14 days, with Directions requests and Website clicks next to each, and flag any store below the average.Also built for this: Google Business Profile dashboard template
Spot a drop in calls or directions
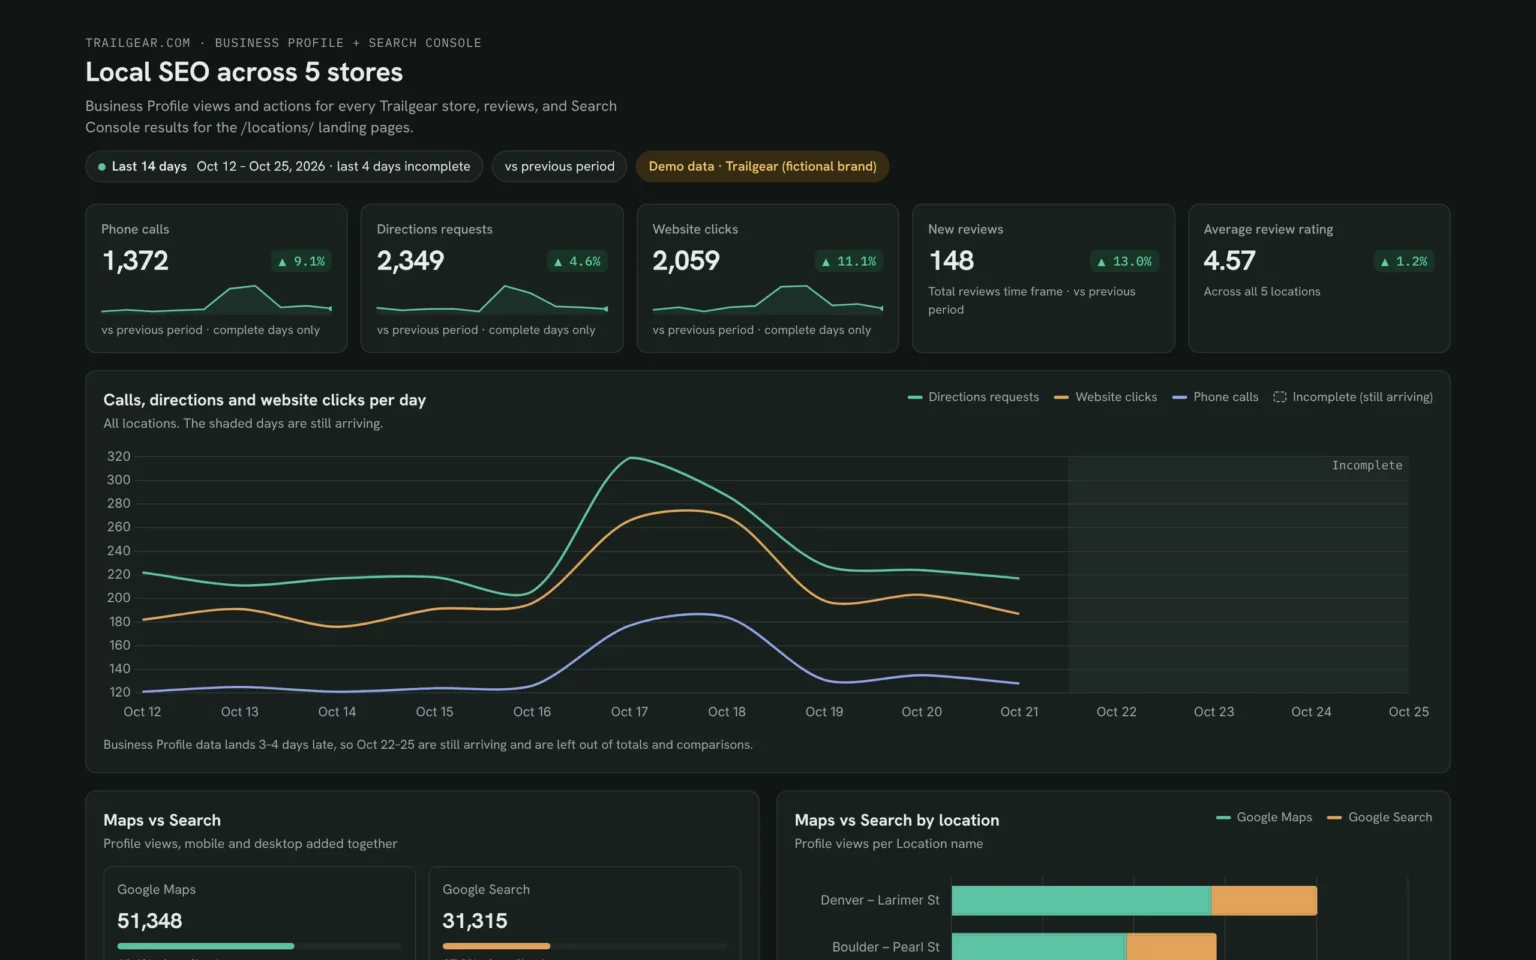
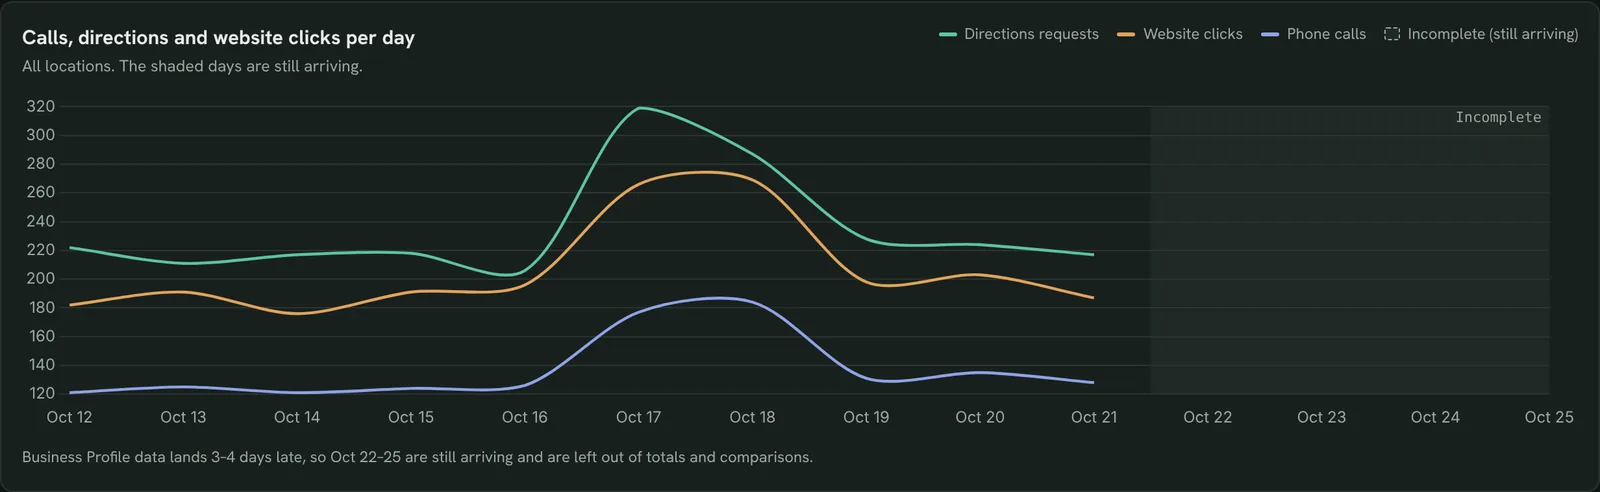
Calls, directions and website clicks per day for all stores, so a fall shows up before the month ends.
- Did calls or directions drop this week?
- Which action fell first?
Compare Phone calls, Directions requests and Website clicks for the latest 5 complete days with the 5 days before, by location, and flag any drop over 20%.Also built for this: Monthly SEO dashboard template
See whether customers find you on Maps or Search
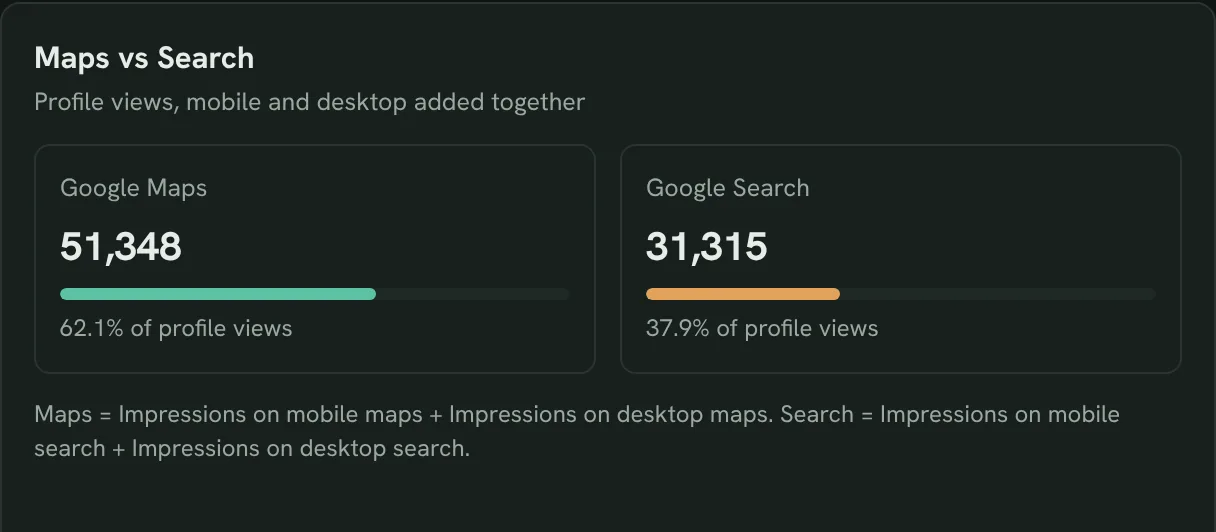
Profile views from Google Maps against Google Search, so you know where your listing has to look its best.
- Do people find us on Maps or in Search?
- Is Maps growing faster than Search?
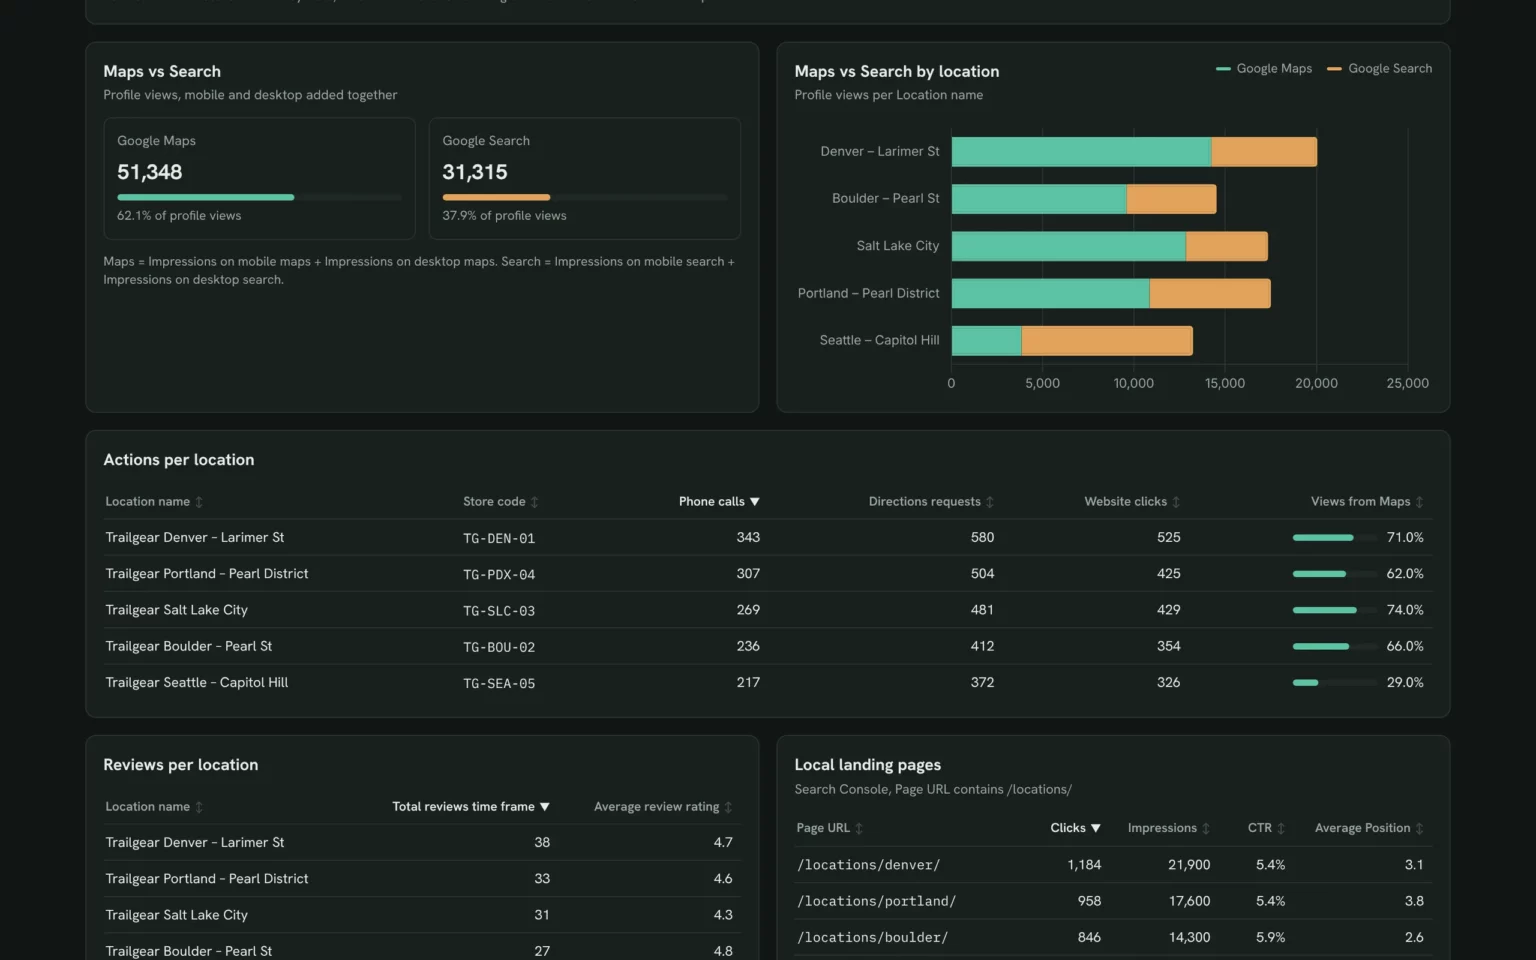
Split my Business Profile views into Maps (Impressions on mobile maps + Impressions on desktop maps) and Search (Impressions on mobile search + Impressions on desktop search) for the last 14 days against the 14 days before.Also built for this: Google Business Profile dashboard template
Find the store that Maps is missing
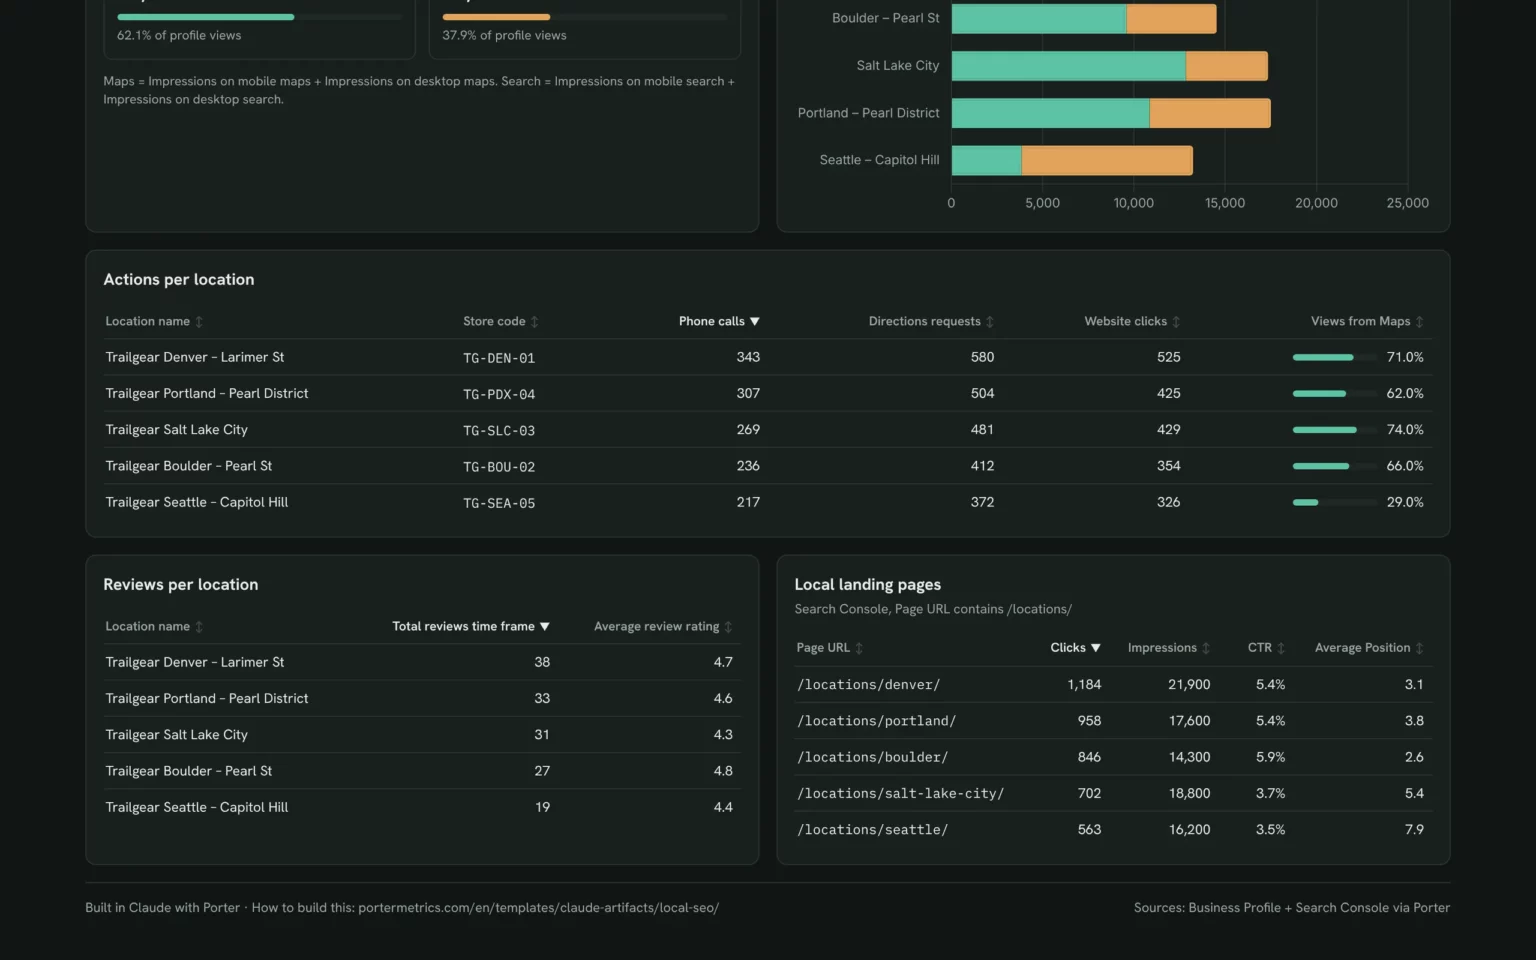
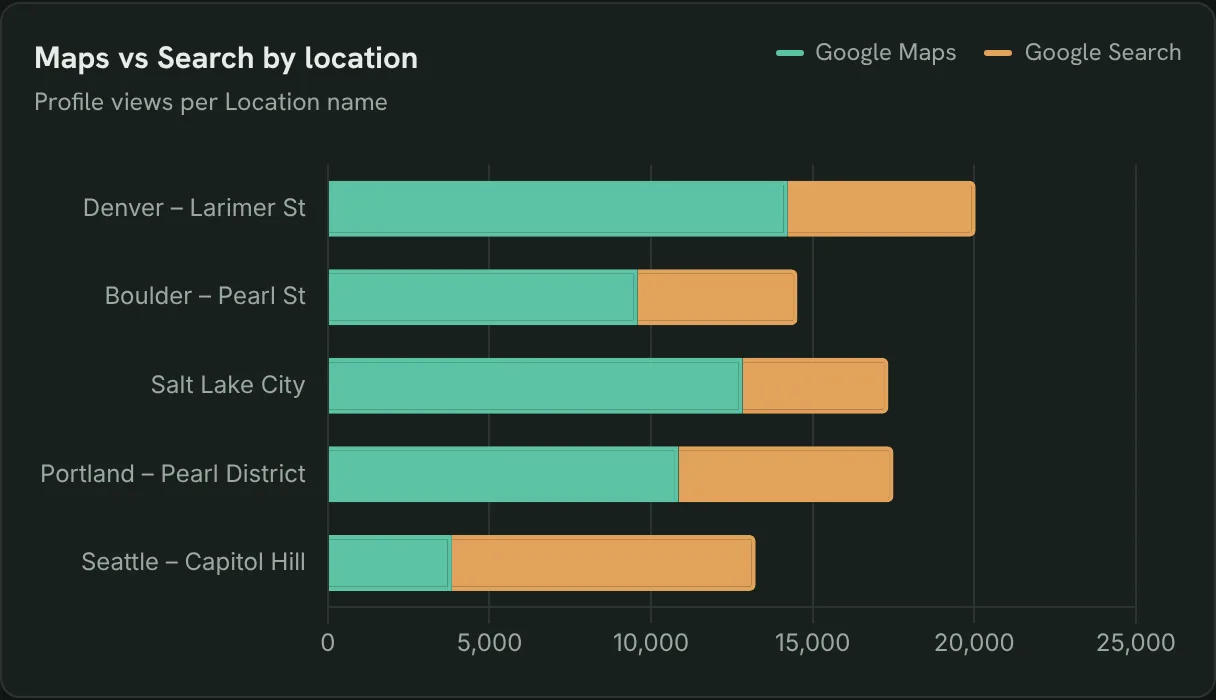
Maps and Search views for each location, so a store that depends on Search stands out at once.
- Which store gets fewer Maps views than the rest?
- Whose Maps listing needs work?
For each location, show the share of profile views from Maps vs Search, and list the locations where Search brings more than half.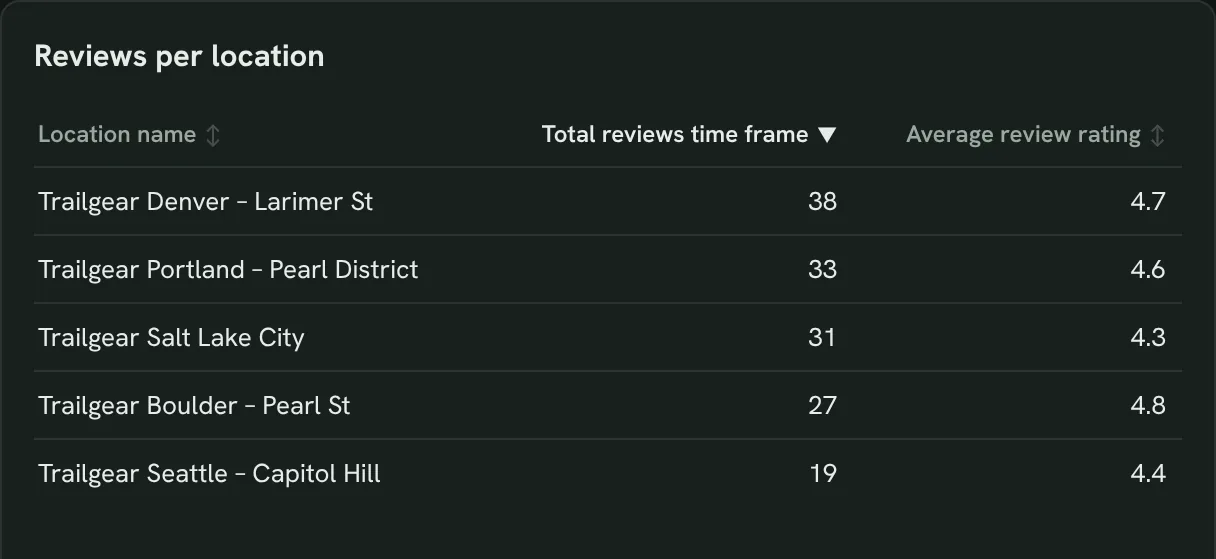
Keep ratings up at every store
New reviews and average rating per location, so a store slipping below the rest gets attention.
- Which store gets the fewest new reviews?
- Where is the rating lowest?
List my locations by Total reviews time frame and Average review rating for the last 14 days, lowest rating first.Also built for this: Client SEO dashboard template
Win more clicks to each location page
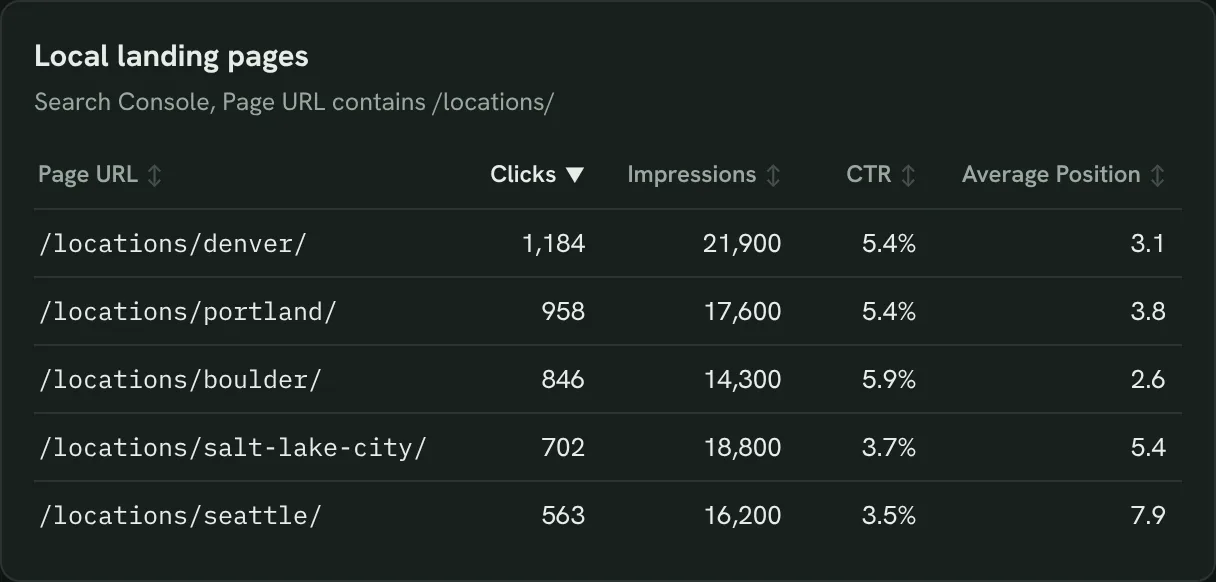
Search Console clicks, CTR and position for every /locations/ page, so you know which page needs a better title.
- Which location page gets the fewest clicks?
- Which one ranks below position 5?
Show Search Console Clicks, Impressions, CTR and Average Position for pages containing /locations/ for the last 14 days, lowest CTR first.Also built for this: Google Search Console dashboard template
How to set up the local SEO dashboard in Claude
You need a Business Profile you manage, a Search Console property for your site, a free Porter account and Claude Pro, Max, Team or Enterprise for Claude Dashboards. The whole setup takes about 10 minutes.
Connect Business Profile and Search Console in Porter
Sign up free at Porter, open Data sources, pick Google Business Profile and choose your locations, then add Google Search Console and your property. The Business Profile to Claude tutorial shows each click.
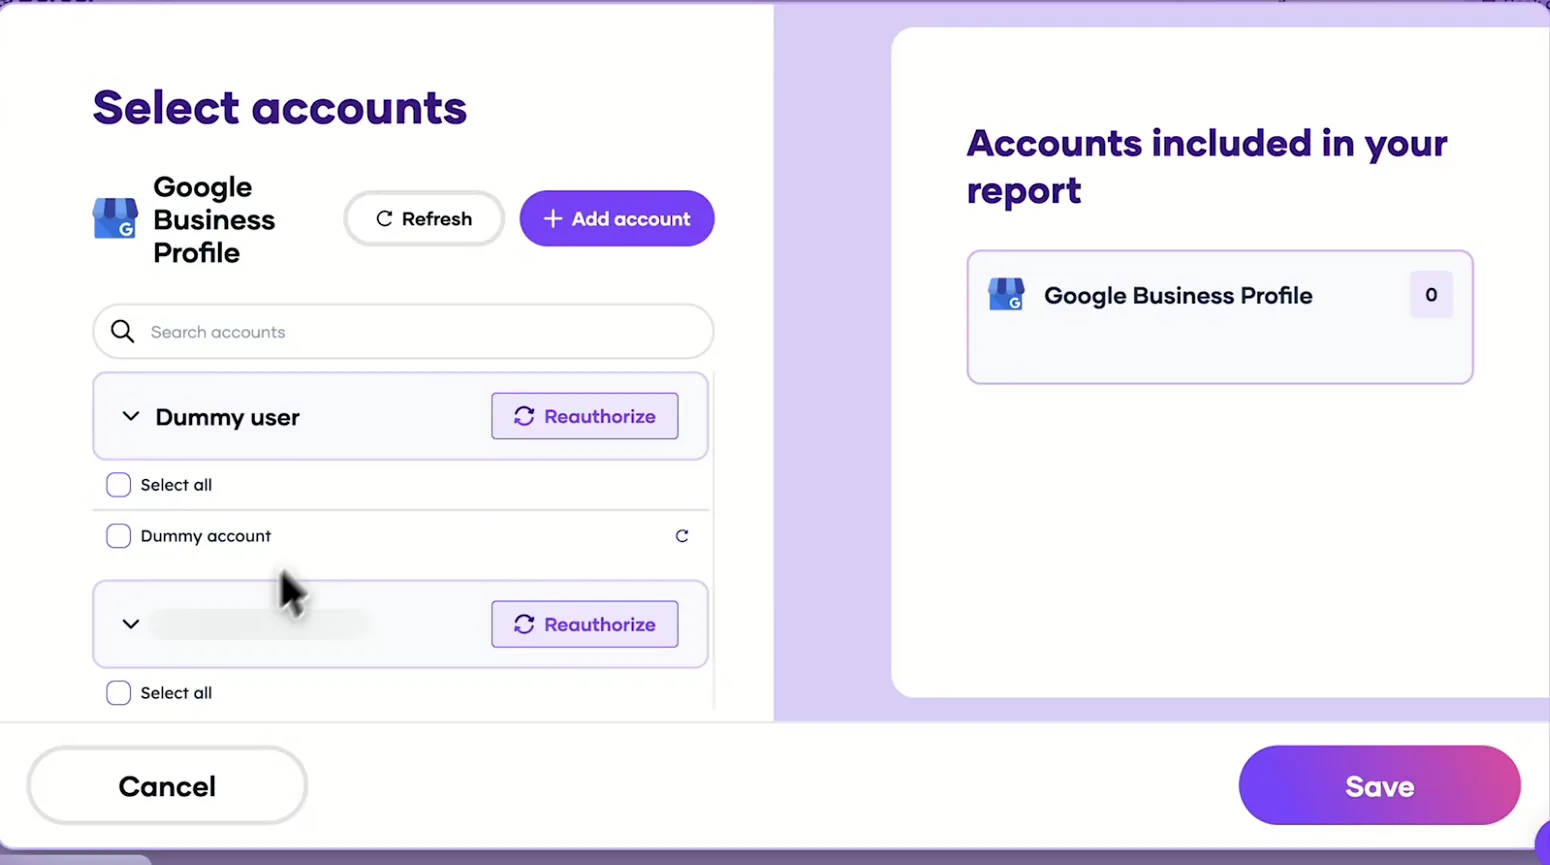
Pick the locations Claude can read, then save. Add Porter to Claude
In Claude, go to Customize → Connectors → Add custom connector, paste https://mcp.portermetrics.com/mcp and name it Porter Metrics. Click Continue, then sign in to Porter and allow access.
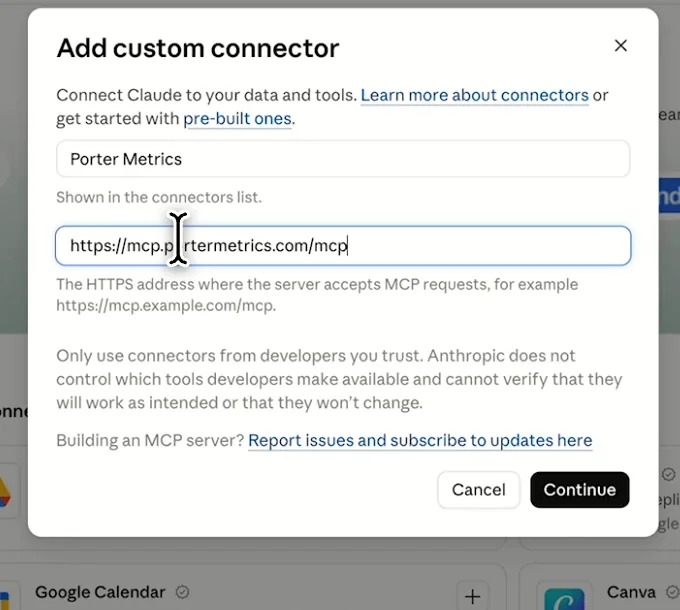
In Claude: Customize, Connectors, Add custom connector, then paste Porter’s MCP URL Paste the install prompt
Open a new chat in Claude, paste this prompt and replace the business in brackets with yours. Claude queries your data through Porter and builds the dashboard.
Install promptDuplicate this Claude dashboard template and keep its layout, views and styling: https://claude.ai/artifact/SGymJ2EWSSSS5Yb3QXUpxi Then rebuild it with my own data through Porter: a local SEO dashboard for [business] for the last 14 days: Business Profile impressions on Maps vs Search, calls, direction requests and website clicks per location, new reviews and average rating, plus Search Console clicks, impressions and average position for my local landing pages (URLs containing [/locations/]). Mark the last 4 days as incomplete. Open in Claude with this prompt

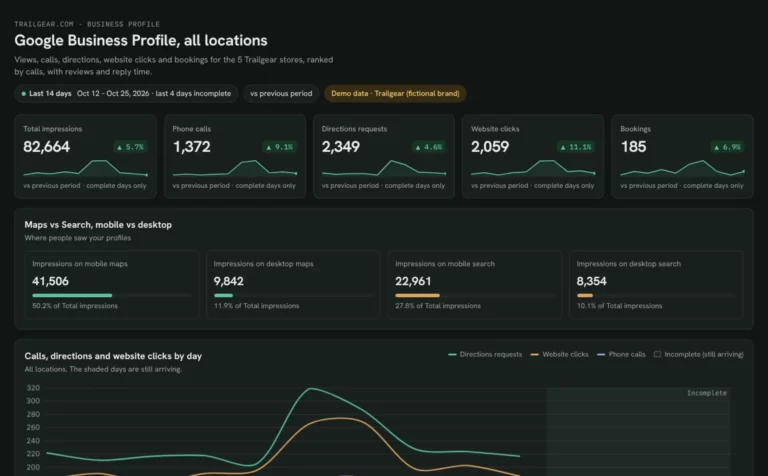
The first thing Claude builds: KPI cards for your own locations. Demo data shown.
How to connect Google Business Profile to Claude
Local SEO fields and data
Business Profile metrics for every store you manage, plus Search Console results for each /locations/ page. Porter reads 145 Business Profile and 27 Search Console fields if you need more.
Top 5 local SEO KPIs to watch
Trailgear demo data · 5 stores · last 14 days vs the 14 before
- Phone calls1,372+9.1%
The action closest to a sale. Check which store moved it, not just the total.
- Directions requests2,349+4.6%
People on their way to a store. A drop with steady views usually means the listing needs a look.
- Website clicks2,059+11.1%
Clicks from the profile to your site. Compare them with what the location page earns in Search.
- Views from Maps62.1%1 store at 29%
Most local views come from Maps. A store far below the others needs its Maps listing fixed.
- Average review rating4.57+0.05
Watch the weakest store, not the average: one low rating pulls the brand down.
How the numbers are calculated
- Profile views
- Impressions on mobile and desktop maps plus impressions on mobile and desktop search.
- Views from Maps
- Maps impressions ÷ all profile views, per location or for every store together.
- Change
- (This period − previous period) ÷ previous period. Google adds Business Profile data 3–4 days late, so those days are left out of the comparison.
- Average review rating
- The average star rating Google reports for each location in the period.
- Location page CTR
- Search Console clicks ÷ impressions for pages containing /locations/.
Data sources
Metrics
 Phone calls
- Directions requests
- Website clicks
- Impressions on mobile maps
- Impressions on desktop maps
- Impressions on mobile search
- Impressions on desktop search
- Total reviews time frame
- Average review rating
 Clicks
- Impressions
- CTR
- Average Position
Dimensions
- Date
- Location name
- Store code
- Page URL
See all fields:Google Business Profile · 145 fieldsGoogle Search Console · 27 fields
What makes this local SEO dashboard different
What you get that checking each profile in Google one by one can’t give you.
Ask the next question in the same chat
See a store slip, then ask Claude which action fell and since when, without exporting anything.
Put profile clicks next to page clicks
Each location’s Business Profile website clicks sit next to the Search Console clicks its page earns.
Answer reviews without switching tools
The same Porter connection can reply to reviews in bulk, so a slow store gets answered from the chat.
Compare stores on the same scale
Build your own metric, like calls per 100 views, and rank every location by it.
Give each client their own report
Publish it as a Porter dashboard with your logo and give location managers view access.
Skip the CSV downloads
A refresh pulls the latest days Google has published, so nobody exports location reports by hand.
What the dashboard includes
- KPI cards for calls, directions, website clicks, new reviews and rating against the previous period
- A daily trend that marks the days Google is still filling in
- Maps vs Search views, overall and per location
- An actions table for every store
- Reviews and rating per location
- Search Console results for each location page
Related dashboard templates
 Claude
Google Business Profile dashboard template
See Maps and Search views, calls and reviews for each location.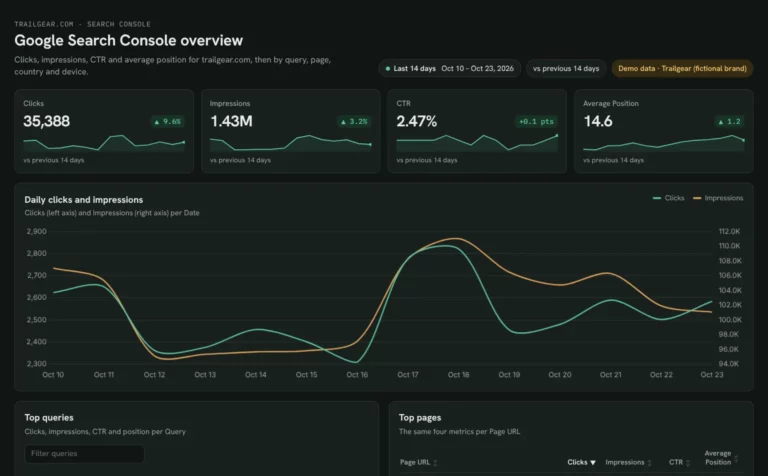 Claude
Google Search Console dashboard template
Find queries close to page one and fix low CTR by page and device.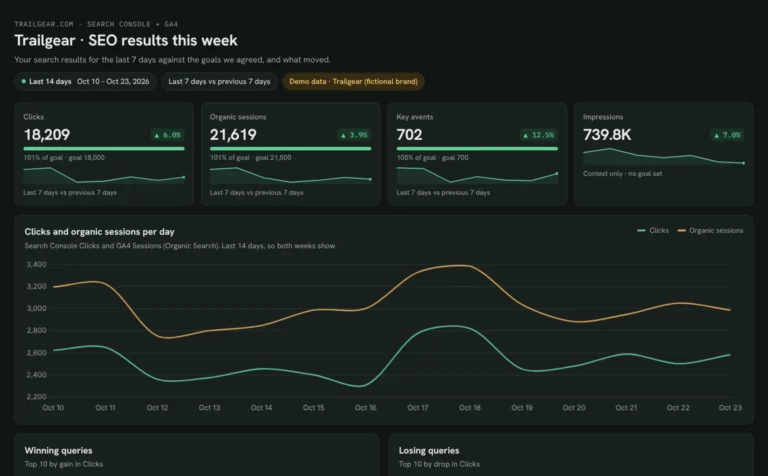 Claude

Client SEO dashboard template
Report clicks, sessions and key events against each client’s goals.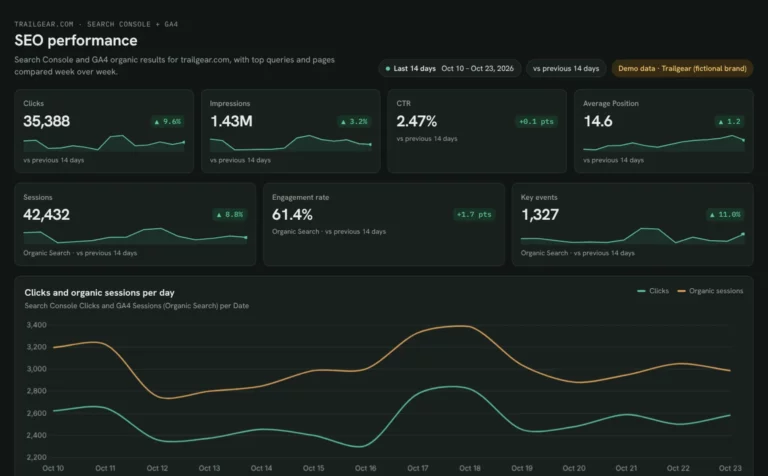 Claude
SEO dashboard template
See which Search Console clicks turn into GA4 sessions and key events.Browse more Claude dashboard templates
 Data Studio
 Google Sheets
 ChatGPT
Get your free local SEO dashboard
Sign up free, connect Business Profile and Search Console and paste the prompt. Your own stores fill the same layout as the demo.
Free plan · 14-day trial · No card needed