





Trusted by 1,600+ marketing teams and agencies


What you can do with this SEM dashboard
Six jobs this dashboard does. Click one to see its view on demo data, then paste its prompt into the same Claude chat.
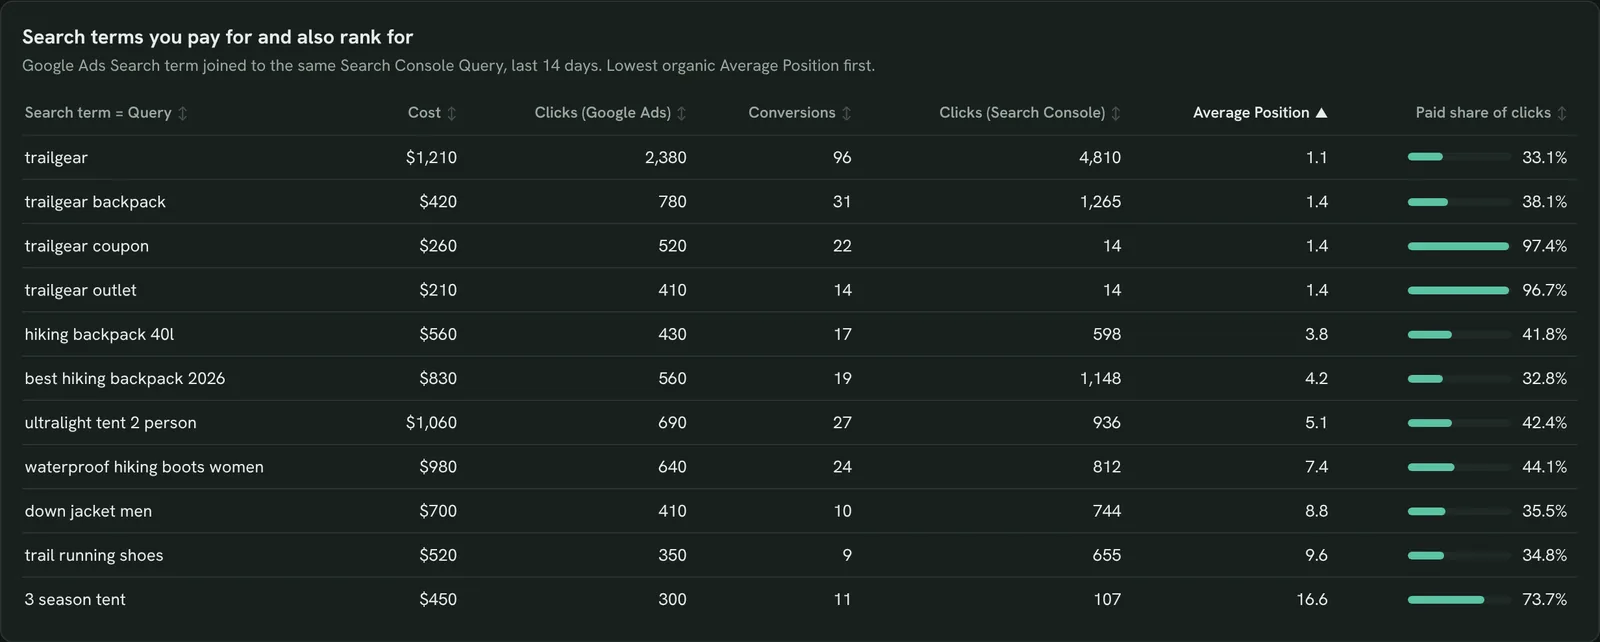
Find queries you pay for but already rank for
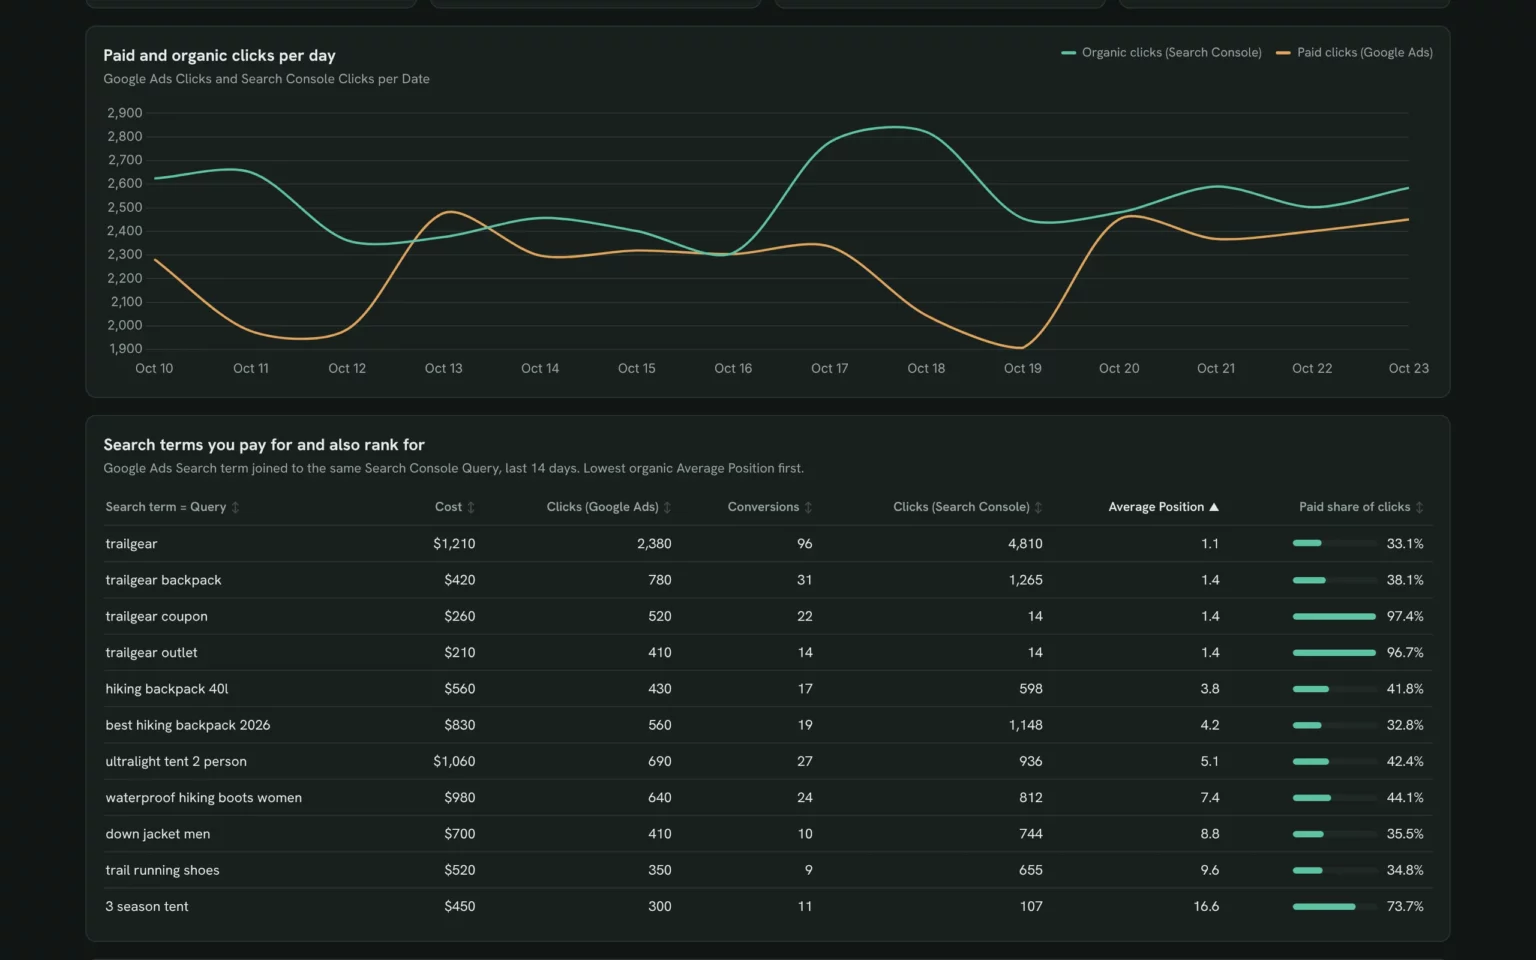
Search terms you buy next to your organic position for the same query, so you see where ads may only buy clicks you’d get anyway.
- Which search terms cost money while we rank top 3?
- Which bids could I test lowering?
Match my Google Ads search terms to the same Search Console queries for the last 14 days, with cost, paid clicks, organic clicks and average position, lowest position first.Also built for this: Google Search Console dashboard template
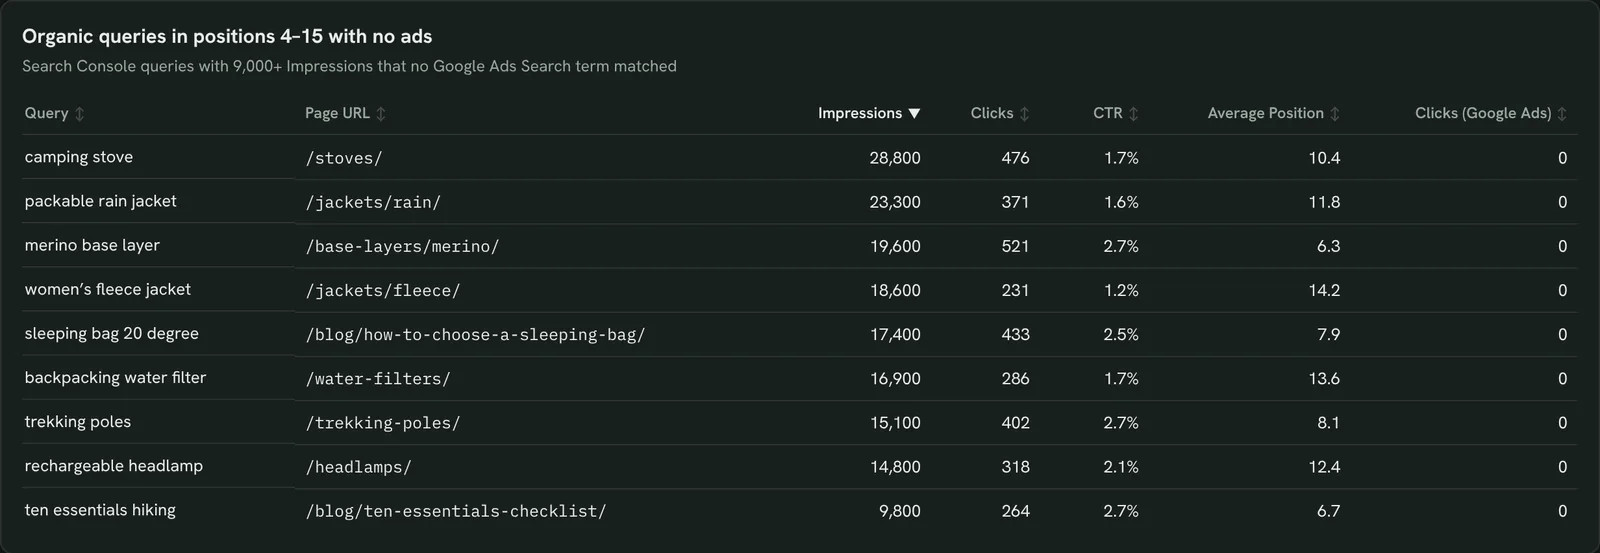
Find organic queries worth bidding on
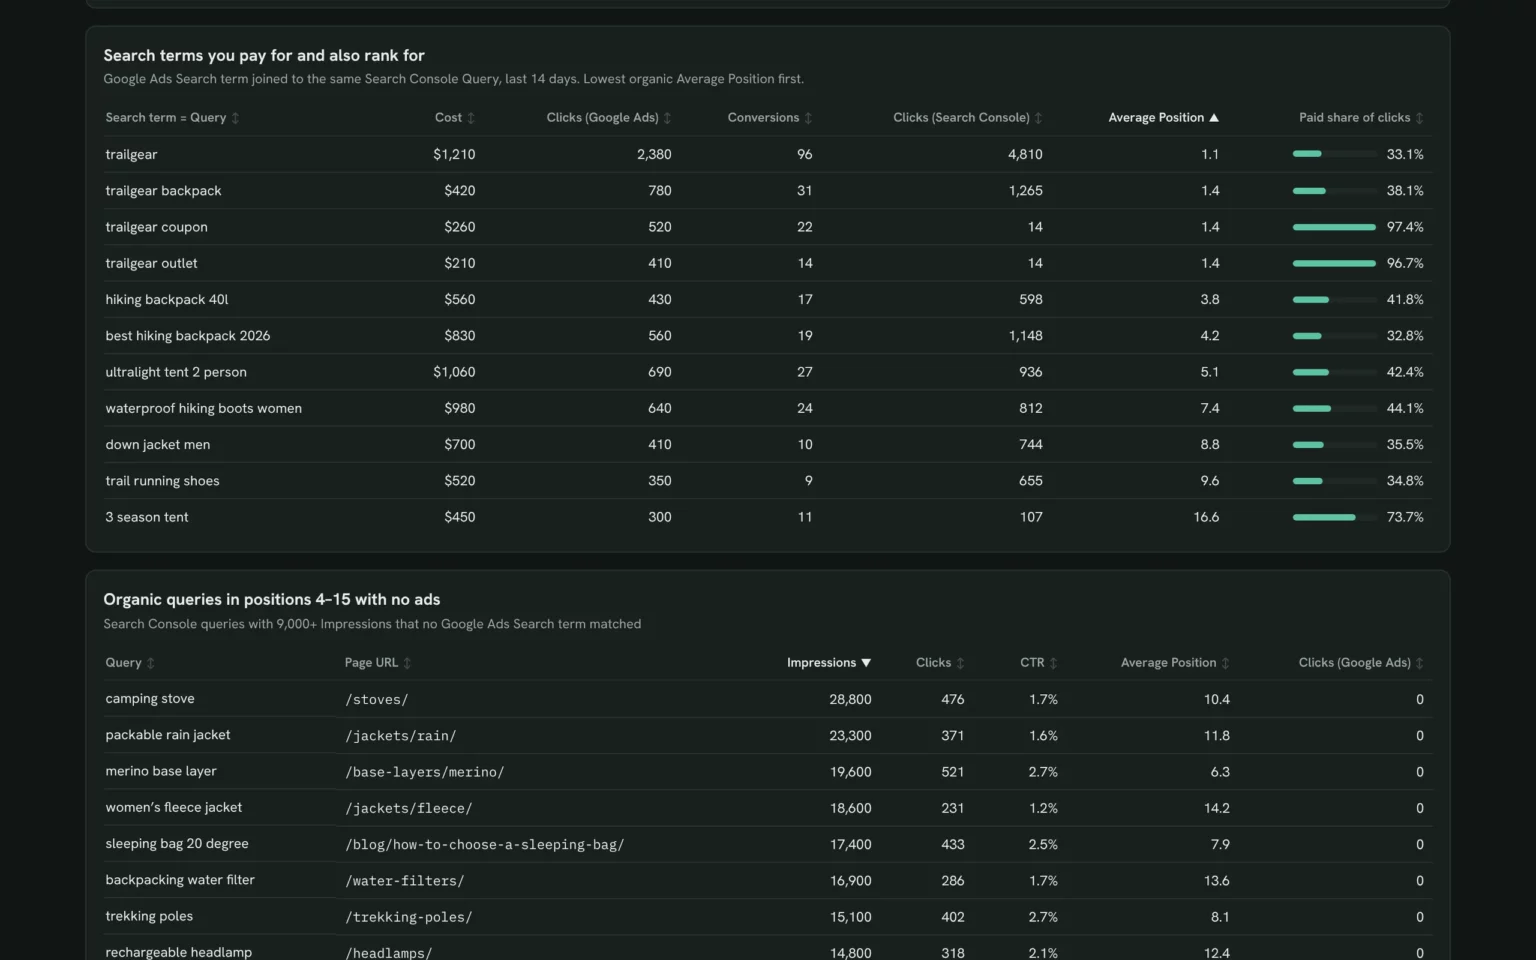
Queries ranking 4–15 with high demand and no ads, so you know where paid search could cover a gap.
- Which queries rank 4–15 with no ads?
- Which pages sit behind them?
List Search Console queries ranking 4–15 with the most impressions in the last 14 days that no Google Ads search term matched, with the page for each.Also built for this: Keyword ranking dashboard template

Split branded and non-branded search
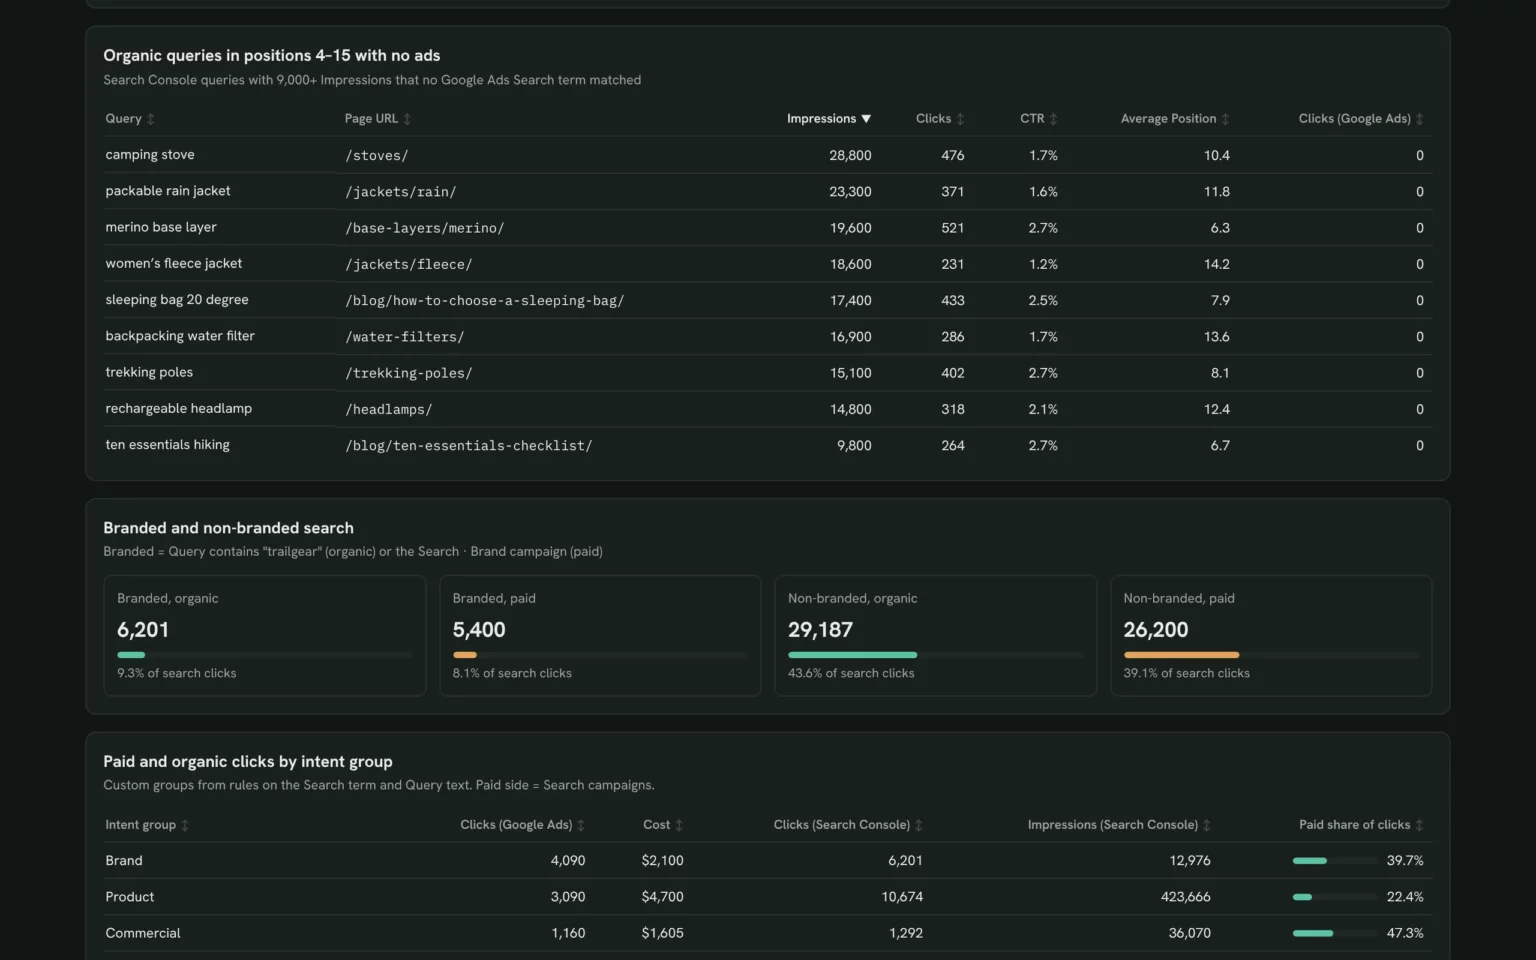
Branded and non-branded clicks, paid and organic, so you see whether you pay for searches that would find you anyway.
- How much branded traffic do we pay for?
- Where do new searchers come from?
Split clicks into branded (containing [brand]) and non-branded, paid and organic, for the last 14 days.Also built for this: Client SEO dashboard template
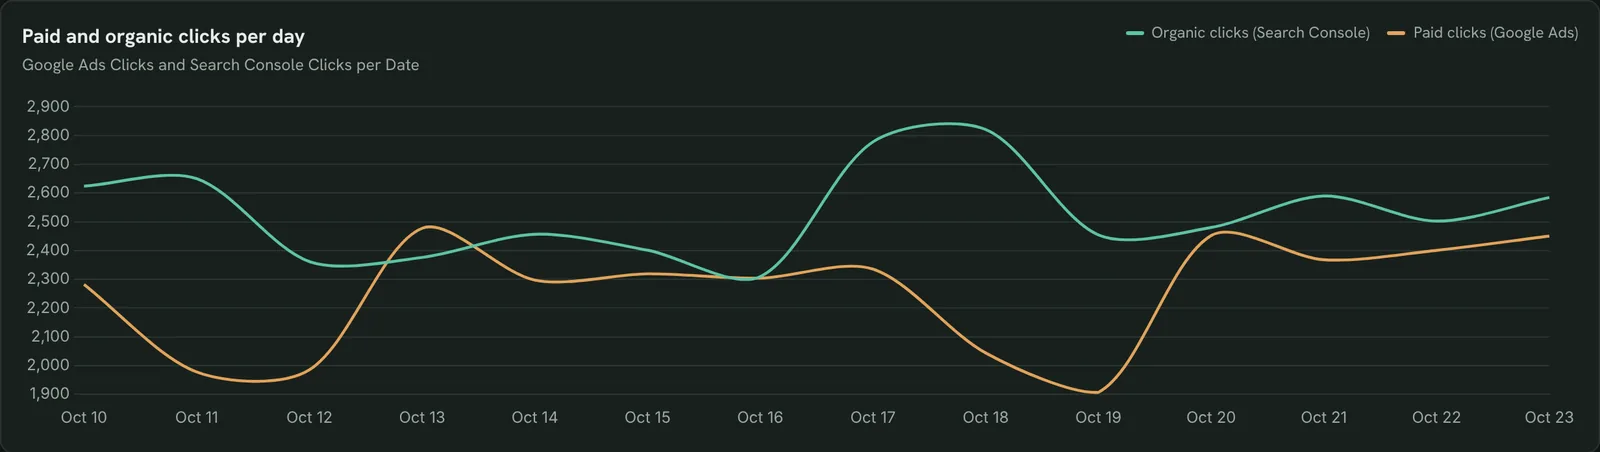
Track paid and organic clicks in one trend
Paid and organic clicks per day on one chart, so you see if ads grew while organic fell.
- Did paid grow while organic dropped?
- Which days moved both?
Chart Google Ads clicks and Search Console clicks per day for the last 14 days.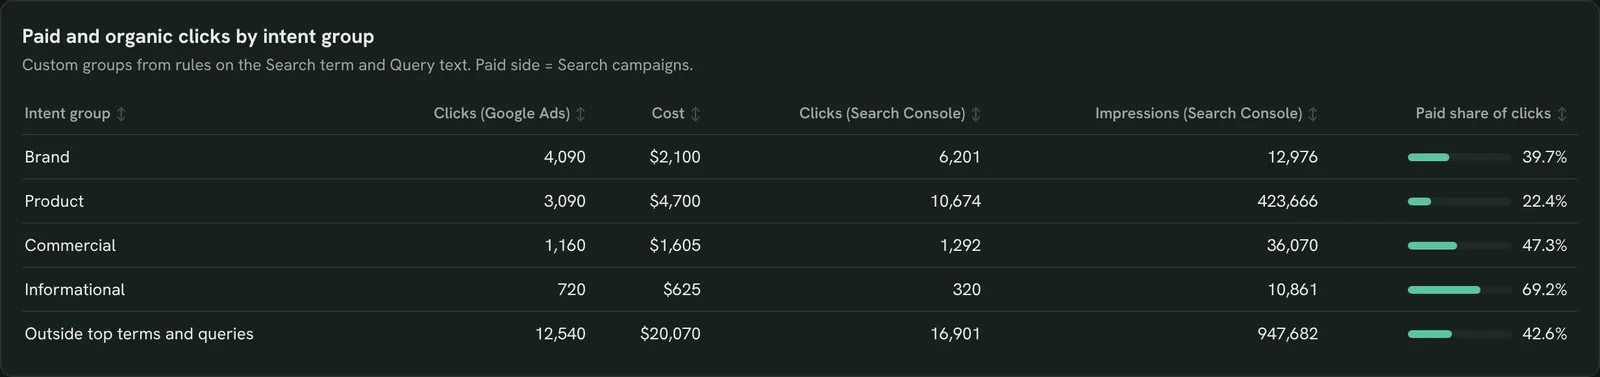
Group queries by intent
Paid and organic clicks by intent group, so you see which intents you win organically and which only with ads.
- Which intent relies most on ads?
- Where does organic carry us?
Group search terms and queries into [intent groups and rules] and show paid clicks, cost and organic clicks per group for the last 14 days.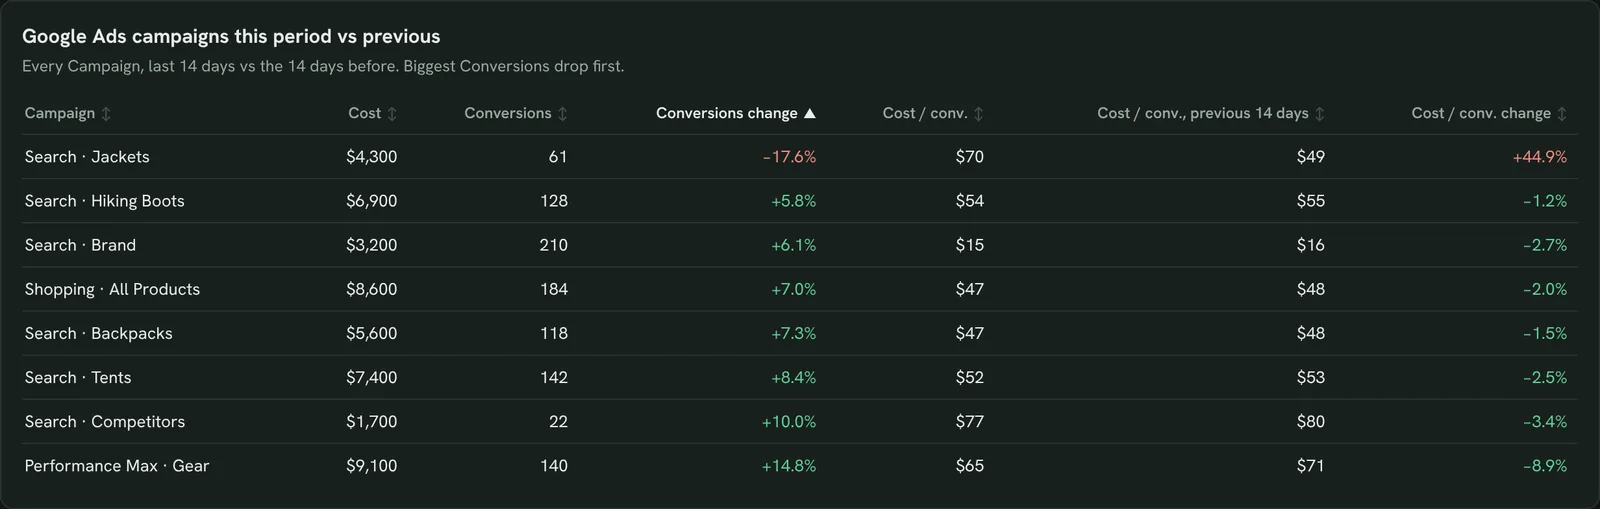
Spot paid campaigns going off track
Each campaign’s conversions and cost per conversion against the 14 days before, so you catch the one that slipped.
- Which campaigns lost conversions?
- Where did cost per conversion jump?
Compare cost, conversions and cost / conv. by Google Ads campaign for the last 14 days with the 14 days before.How to set up the SEM dashboard in Claude
You need a Google Ads account and a Search Console property for the same site, a free Porter account and Claude Pro, Max, Team or Enterprise for Claude Dashboards. Setup takes about 10 minutes.
Connect Google Ads and Search Console in Porter
Sign up free at Porter, open Data sources and connect Google Ads, then Google Search Console, picking the account and site for the same website. The Search Console to Claude tutorial shows each click.
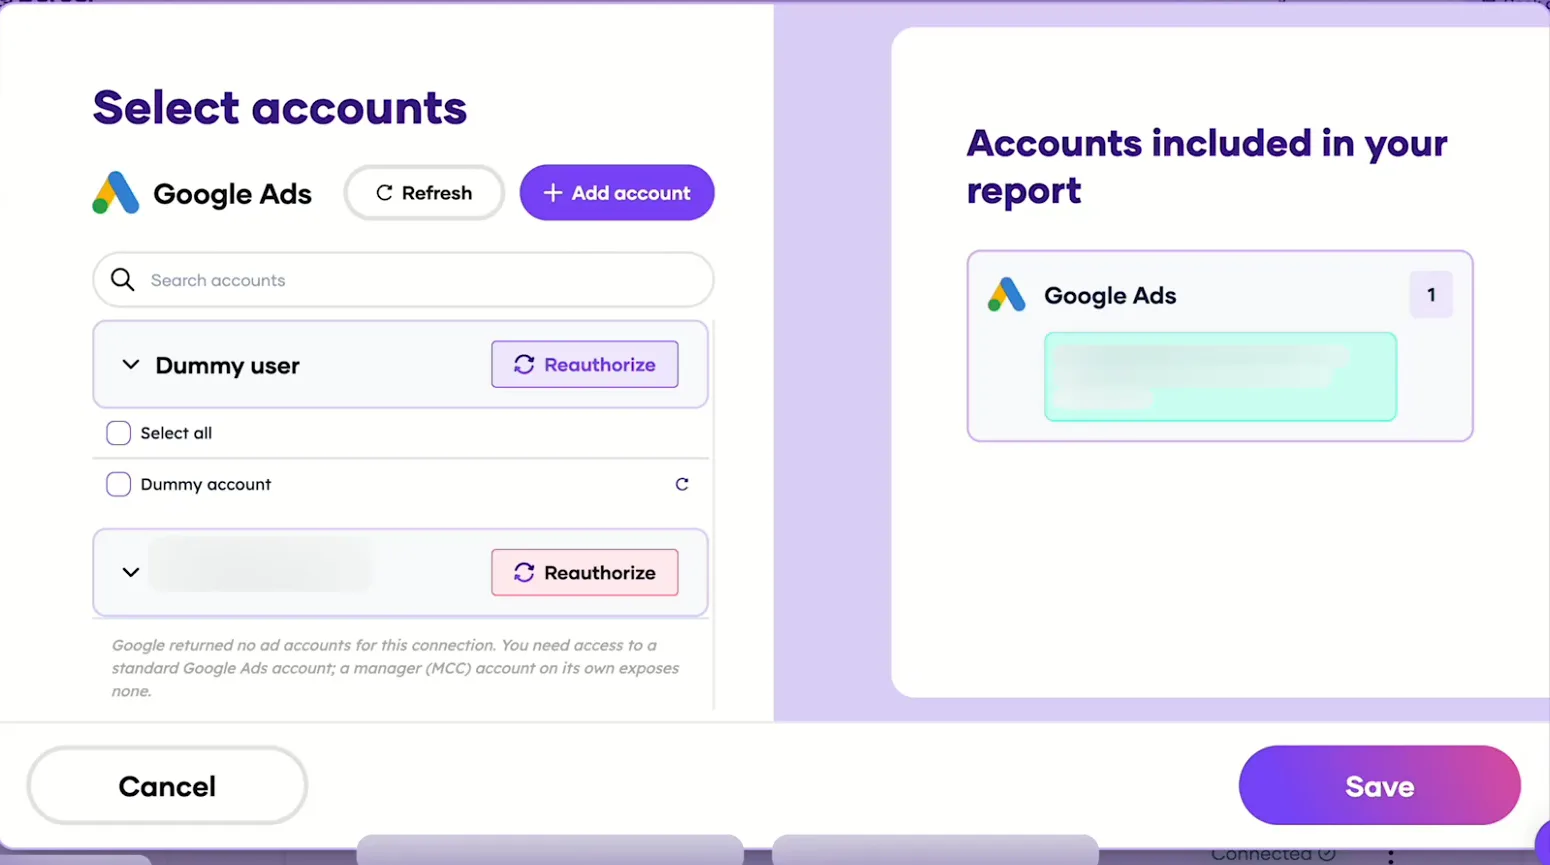
Pick the Google Ads account Claude can read, then add Search Console the same way. Add Porter to Claude
In Claude, go to Customize → Connectors → Add custom connector, paste https://mcp.portermetrics.com/mcp and name it Porter Metrics. Click Continue, then sign in to Porter and allow access.
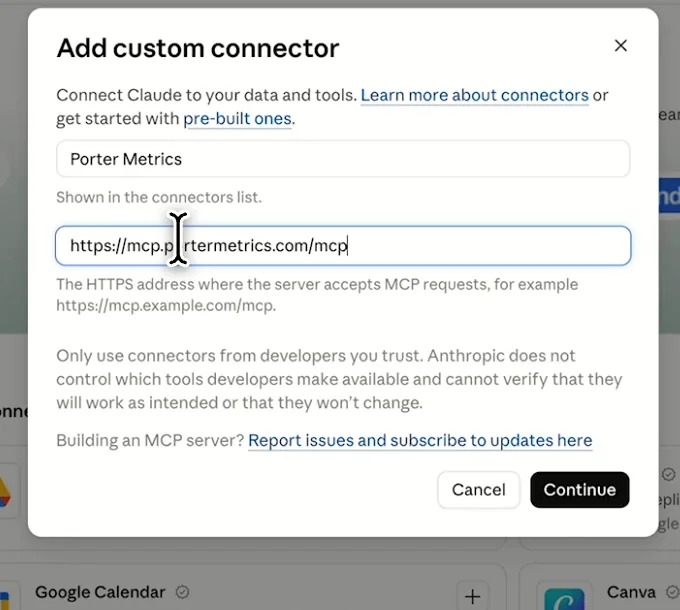
In Claude: Customize, Connectors, Add custom connector, then paste Porter’s MCP URL Paste the install prompt
Open a new chat in Claude, paste this prompt and replace the account and site in brackets. Claude queries both sources through Porter and builds the dashboard.
Install promptDuplicate this Claude dashboard template and keep its layout, views and styling: https://claude.ai/artifact/14oFpB95CzwPLDttWcLXk8 Then rebuild it with my own data through Porter: an SEM dashboard for [Google Ads account] and [site] for the last 14 days: KPI cards for paid, organic and total search clicks, paid share, Google Ads cost and cost / conv., and average position; paid and organic clicks per day; Google Ads search terms matched to the same Search Console queries with cost and position; queries ranking 4–15 with no ads; branded vs non-branded clicks for [brand]; and Google Ads campaigns. Open in Claude with this prompt
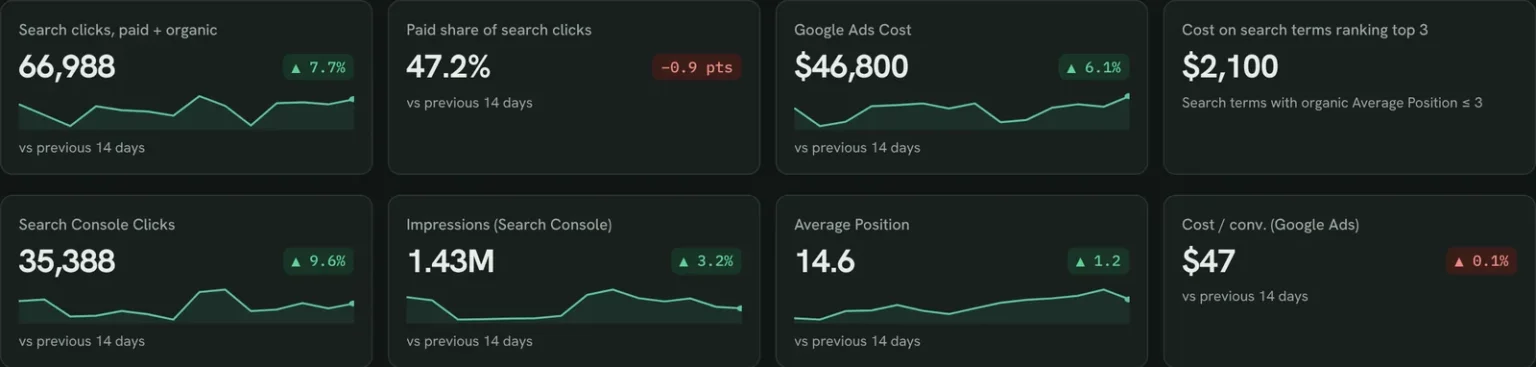
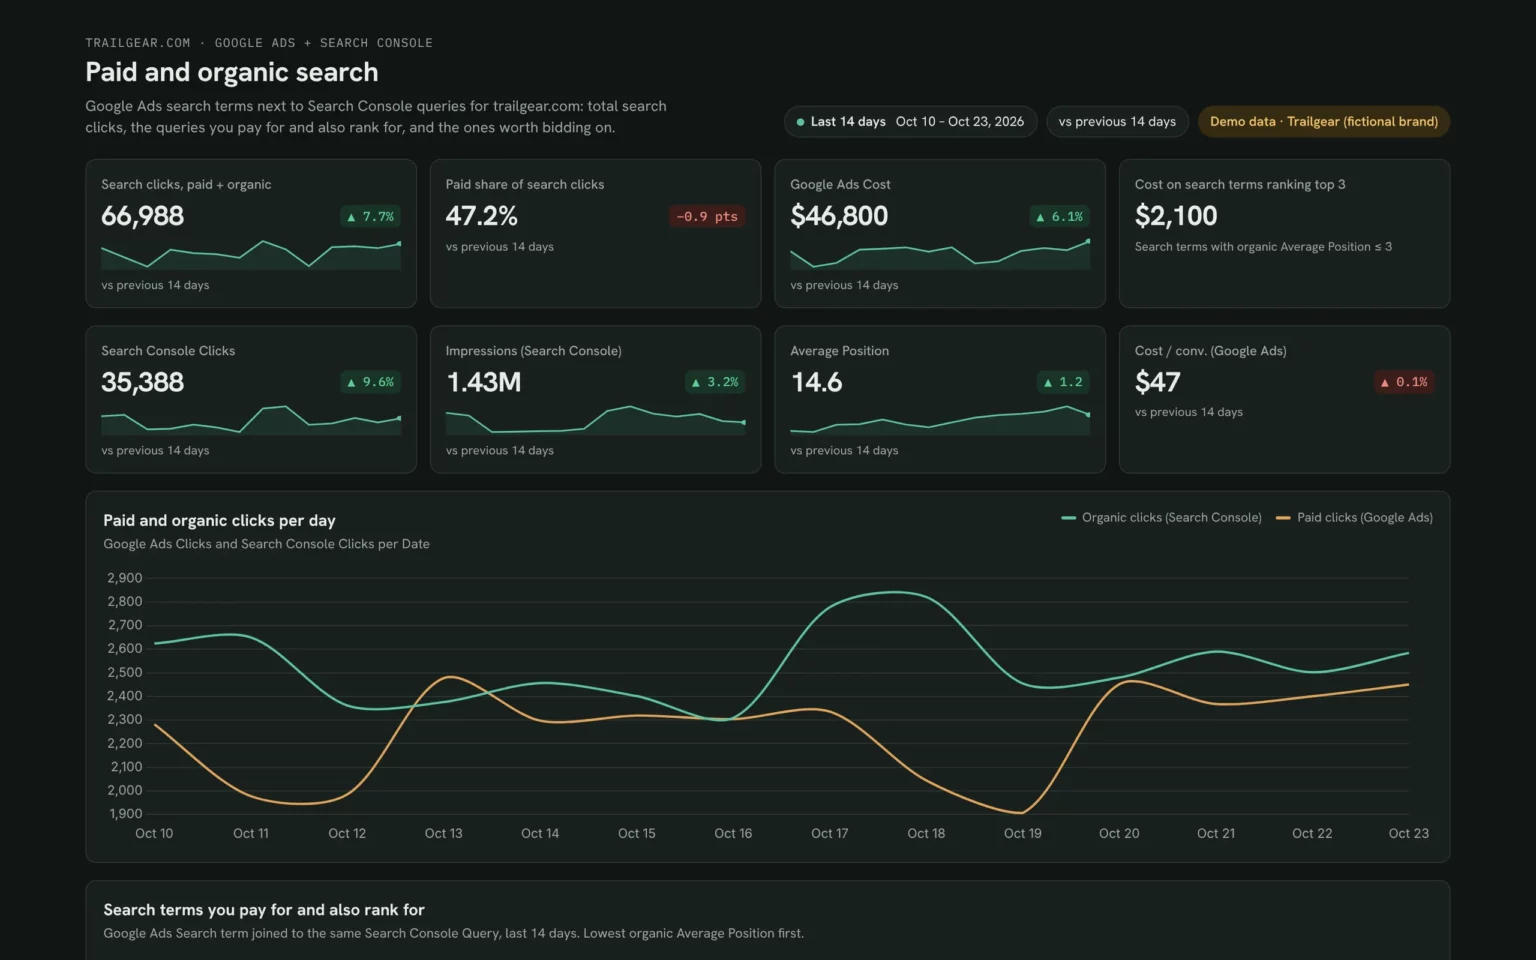
The first thing Claude builds: paid and organic KPI cards for your own site. Demo data shown.
How to use the Google Ads MCP in Claude (no code)
SEM dashboard fields and data
The template joins Google Ads search terms to Search Console queries on the same text. Porter reads 1,042 Google Ads and 27 Search Console fields.
Top 5 SEM KPIs to watch
Trailgear demo data · last 14 days vs the 14 before
- Search clicks, paid + organic66,988+7.7%
All the clicks search brings you. Check it before you judge either channel alone.
- Paid share of search clicks47.2%−0.9 pts
Rising share with flat total clicks means ads are replacing organic, not adding to it.
- Cost on terms ranking top 3$2,1004 search terms
Money spent where you already rank first. Test lowering bids here first.
- Cost / conv.$46.57+0.1%
A campaign far above your target is the first place to cut or fix.
- Average Position14.61.2 better
Watch the trend: a falling number means pages move up and may need less ad support.
How the numbers are calculated
- Paid share
- Google Ads clicks ÷ (Google Ads clicks + Search Console clicks).
- Overlap
- A Google Ads search term that matches a Search Console query exactly.
- Ranking top 3
- Search Console average position of 3 or better for that query.
- Branded
- Queries containing your brand terms, plus your brand campaign.
- Change
- (This period − previous) ÷ previous. Position shows “better” when it drops.
Data sources
Metrics
 Cost
- Clicks
- Conversions
- Cost / conv.
 Clicks
- Impressions
- CTR
- Average Position
Dimensions
- Date
- Campaign
- Search term
- Date
- Query
- Page URL
See all fields:Google Ads · 1,042 fieldsGoogle Search Console · 27 fields
What makes this SEM dashboard different
What you get that Google Ads and Search Console can’t show you on their own.
See paid and organic for the same query
Search terms and queries sit in one row, matched on the text.
Ask the next question in the same chat
Spot paid clicks rising, then ask Claude which queries lost organic clicks.
Act on it after you approve
Ask Claude to add a negative keyword or lower a bid. Porter asks first.
Compare any two periods
Put the last 14 days next to the 14 before or last year.
Send clients a report on your logo
Publish it in Porter and email it on the day you choose.
Share it without account access
Anyone with the Porter link sees both sources.
What the dashboard includes
- Paid, organic and total search KPI cards
- Paid and organic clicks per day
- Overlap and bid-candidate tables
- Brand split, intent groups and campaigns
Related dashboard templates
 Claude
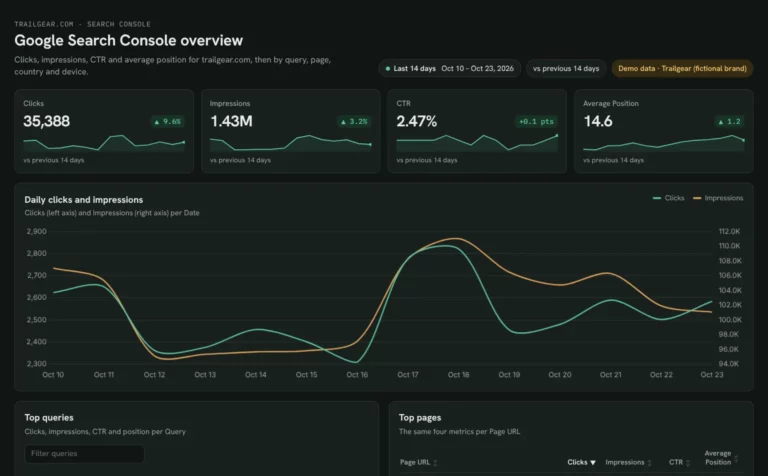
Google Search Console dashboard template
Find queries close to page one and fix low CTR by page and device.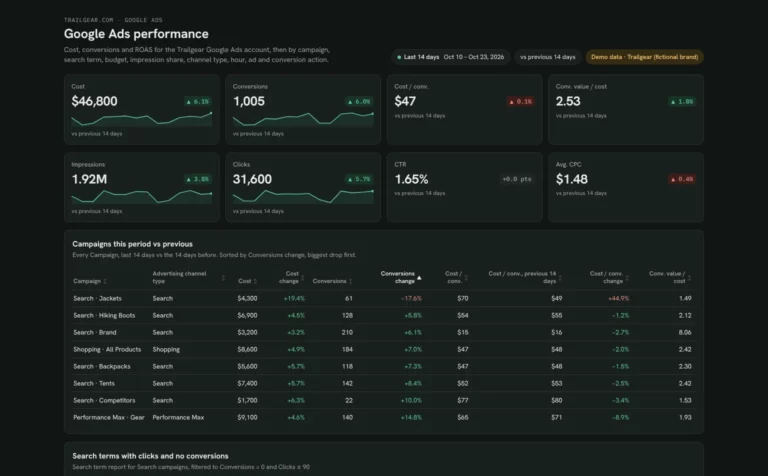 Claude
Google Ads dashboard template
Find search terms that waste spend and see which campaigns are limited by budget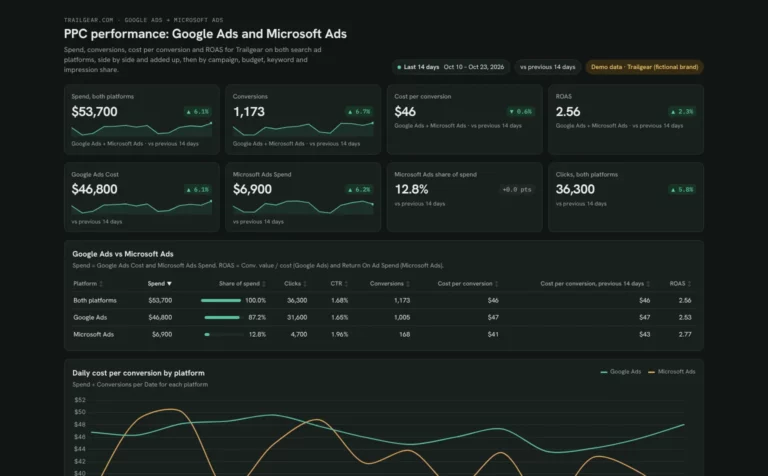 Claude

PPC dashboard template
Compare Google Ads and Microsoft Ads spend and cost per conversion side by side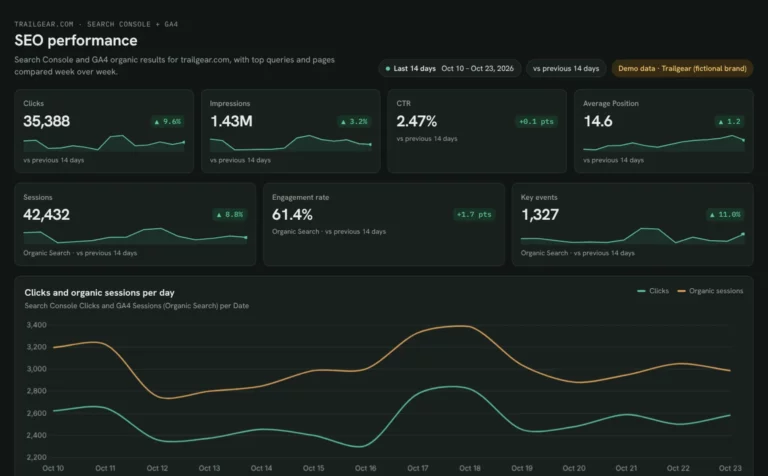 Claude

SEO dashboard template
See which Search Console clicks turn into GA4 sessions and key events.Browse more Claude dashboard templates
 Data Studio
 Google Sheets
 ChatGPT
Get your free SEM dashboard
Sign up free, connect Google Ads and Search Console and paste the prompt. Your own data fills the same layout as the demo.
Free plan · 14-day trial · No card needed