





Trusted by 1,600+ marketing teams and agencies


What you can do with this social media dashboard
Click a job to see it on demo data, then paste its prompt into Claude.
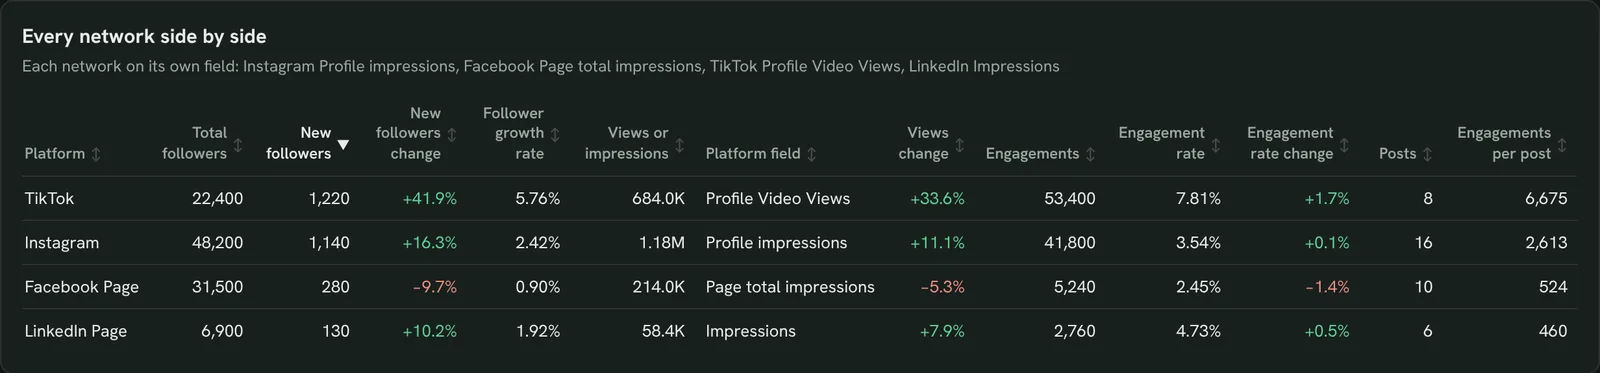
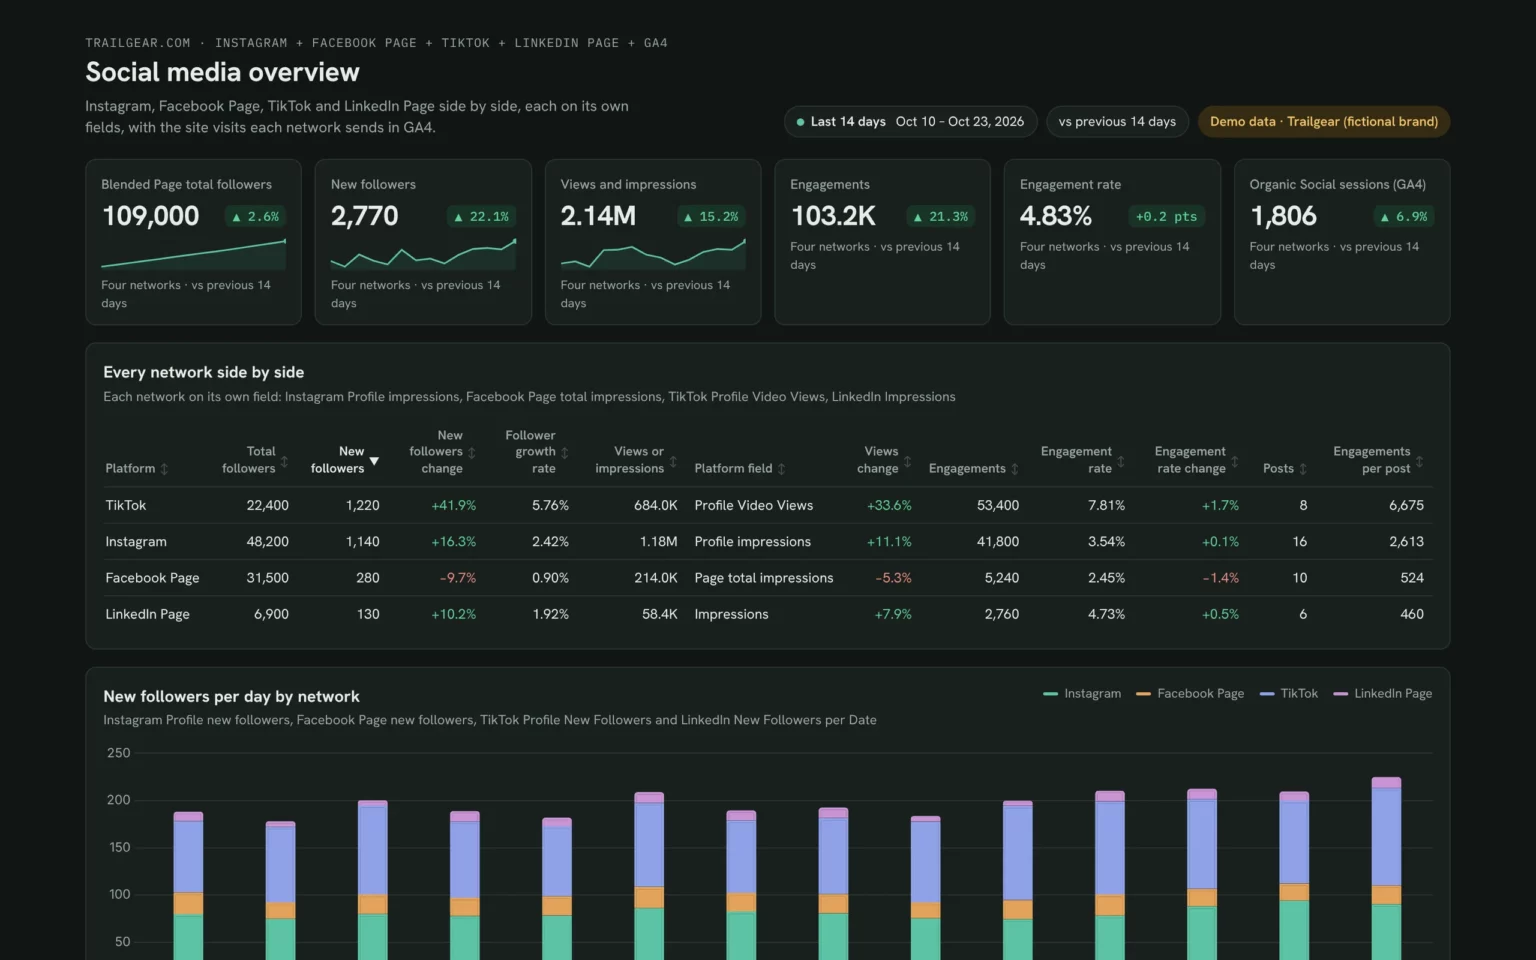
Compare every network on one screen
Followers, views, engagement rate and posts for each network in one table, so you see which one earns your time.
- Which network grew the most this period?
- Where did engagement rate drop?
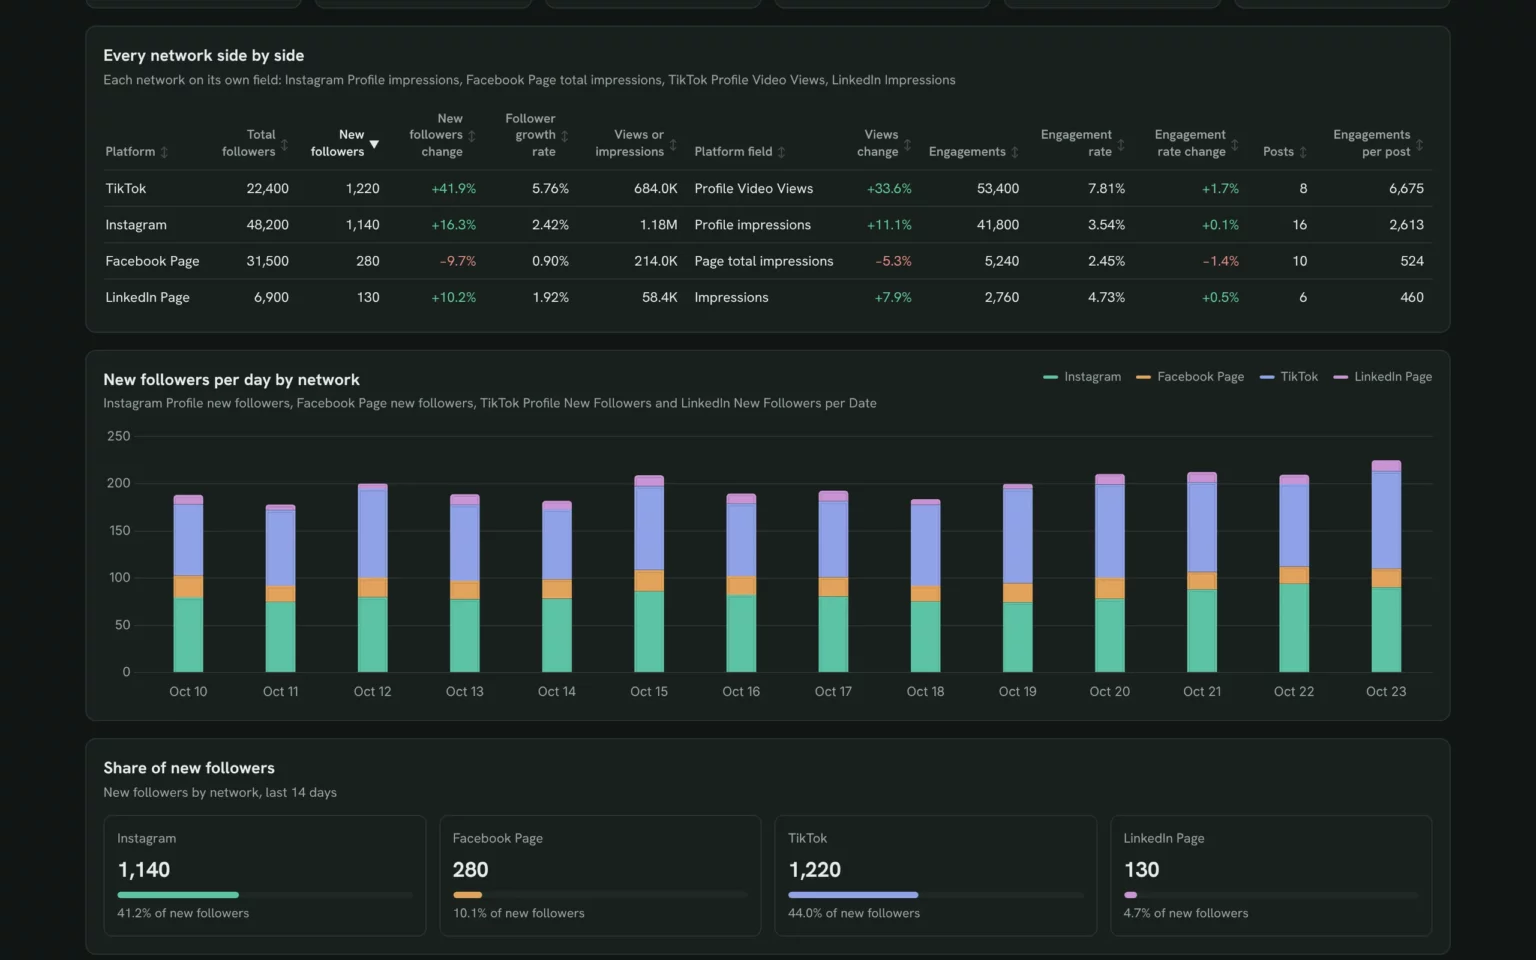
Compare Instagram, Facebook Page, TikTok and LinkedIn Page for the last 14 days: followers, new followers, views or impressions, engagements, engagement rate and posts.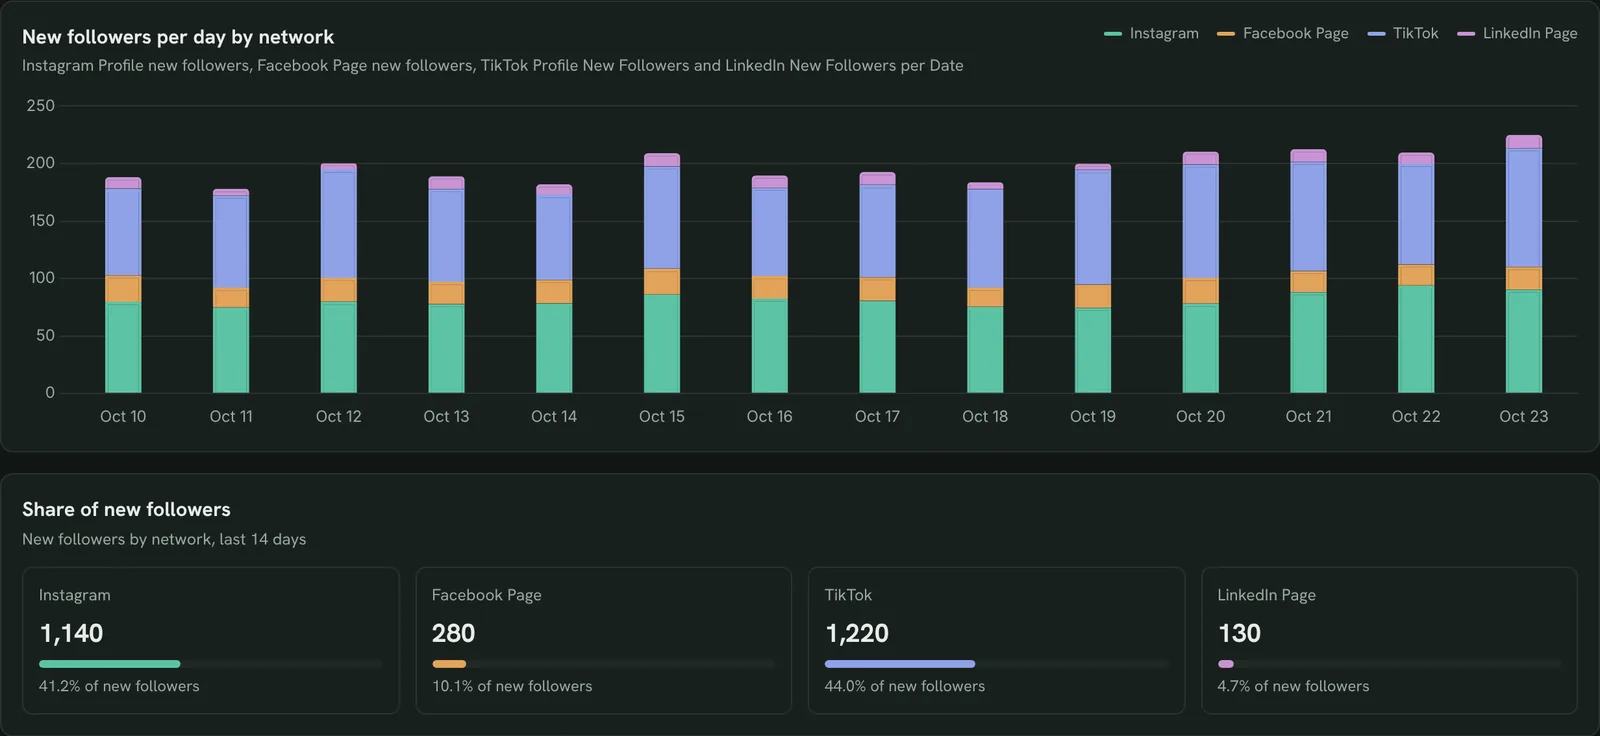
See which network grows your audience
New followers per day on each network, so a stalled account shows up before the month ends.
- Where do new followers come from?
- Is any network losing pace?
Chart new followers per day by network for the last 14 days and show each network’s share of the total.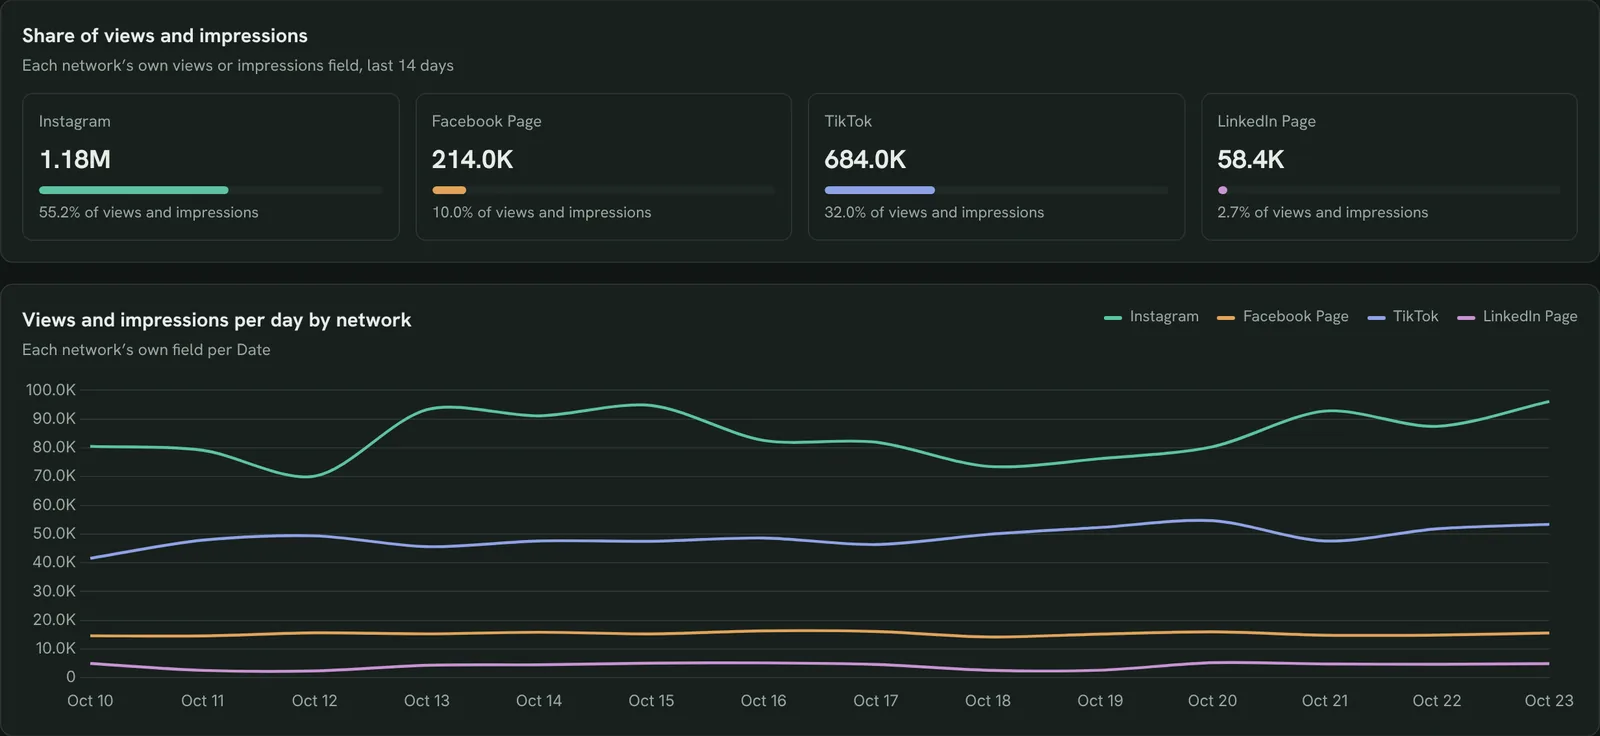
See where people actually see your posts
Each network’s own views or impressions field per day, so you know where your audience scrolls.
- Which network carries most of the views?
- Is that share shifting?
Chart views or impressions per day for each network on its own field, then show each network’s share.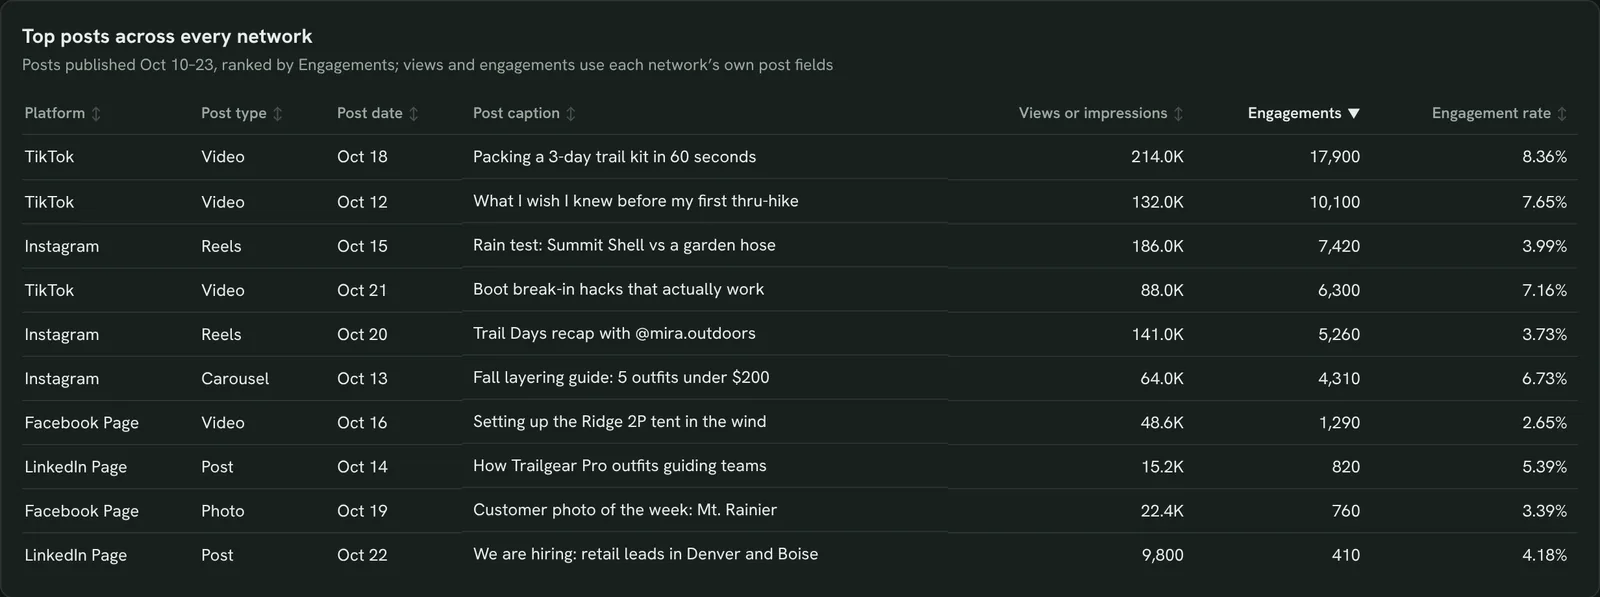
Find your best posts on any network
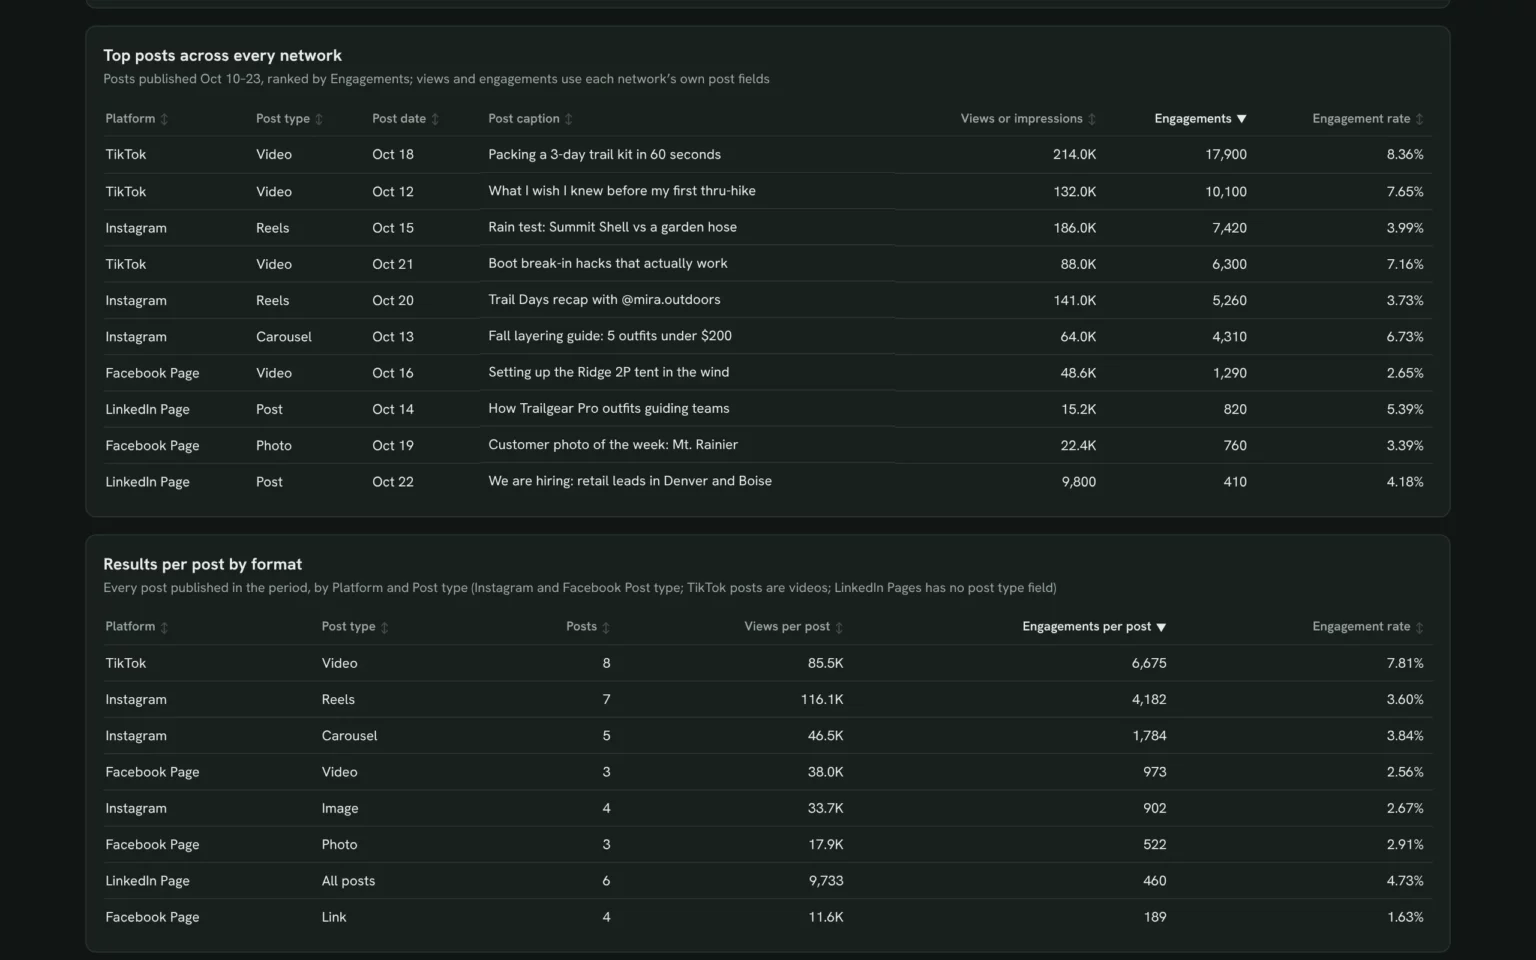
Posts from all four networks ranked by engagements, so you can repost the idea on the others.
- Which posts earned the most engagements?
- Do the winners share a topic or format?
List my top 10 posts across Instagram, Facebook Page, TikTok and LinkedIn Page in the last 14 days by engagements, with views and engagement rate.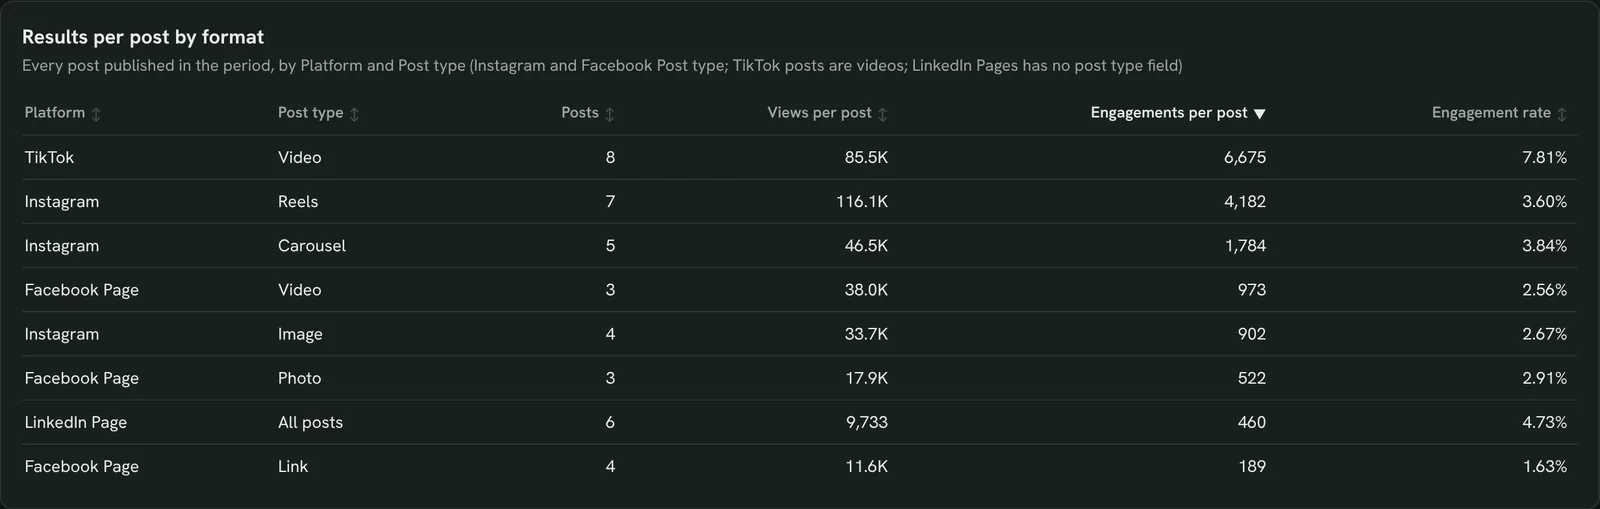
Know which format earns the most per post
Views and engagements per post by post type, so you make more of what works.
- Do Reels, carousels or TikTok videos earn more per post?
- Which format should I post less?
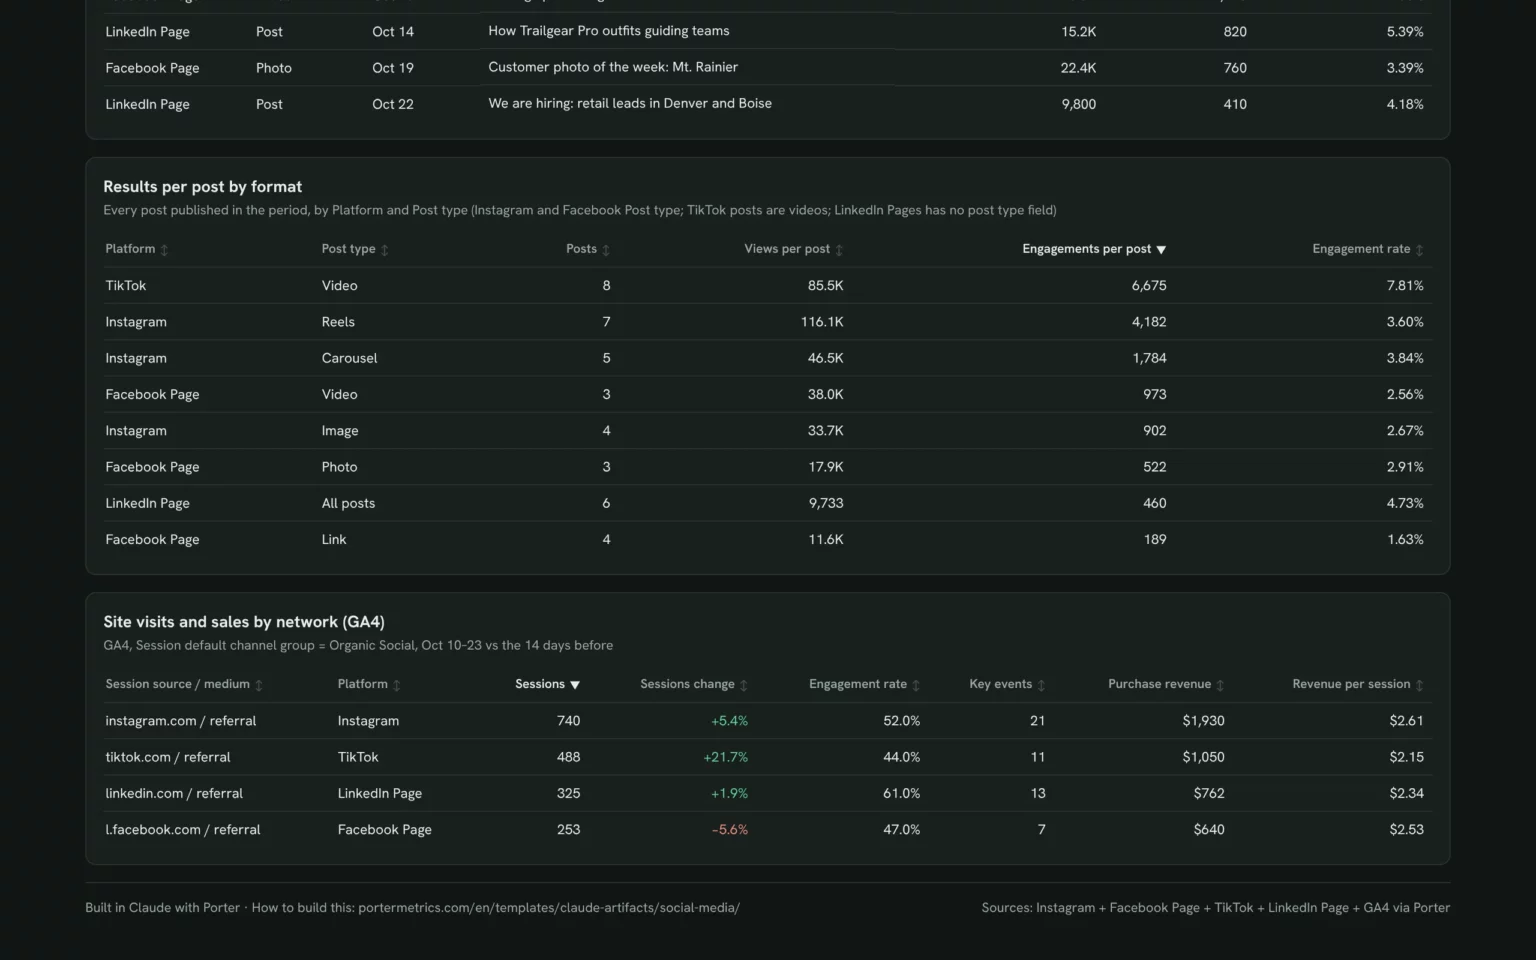
Group every post from the last 14 days by network and post type, with posts, views per post, engagements per post and engagement rate.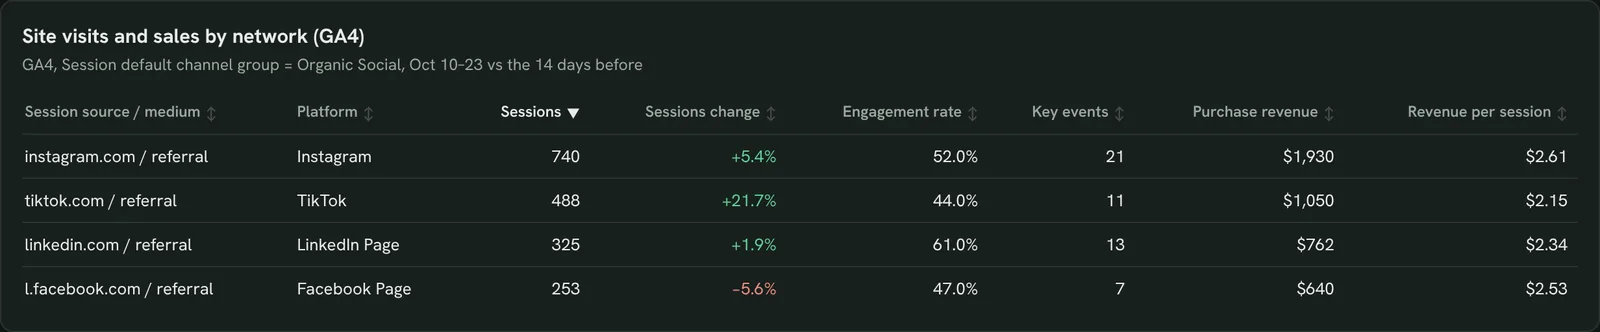
See which network sends visitors and sales
GA4 sessions, key events and revenue from each network, so likes get weighed against sales.
- Which network sends the most sessions?
- Which one brings revenue?
From GA4, show Organic Social sessions, engagement rate, key events and purchase revenue by session source for the last 14 days.Also built for this: Web analytics dashboard template
How to set up the social media dashboard in Claude
You need an Instagram Business account linked to a Facebook Page, your TikTok and LinkedIn Page logins, a free Porter account and a paid Claude plan. Setup takes about 15 minutes.
Connect your social accounts in Porter
Sign up free at Porter, sign in with Facebook to add Instagram and your Facebook Page, then add TikTok and LinkedIn Pages. Add GA4 for the site visits view. The Instagram, TikTok and LinkedIn Pages tutorials show each click.
Add Porter to Claude
In Claude, go to Customize → Connectors → Add custom connector, paste https://mcp.portermetrics.com/mcp and name it Porter Metrics. Then sign in to Porter and allow access.
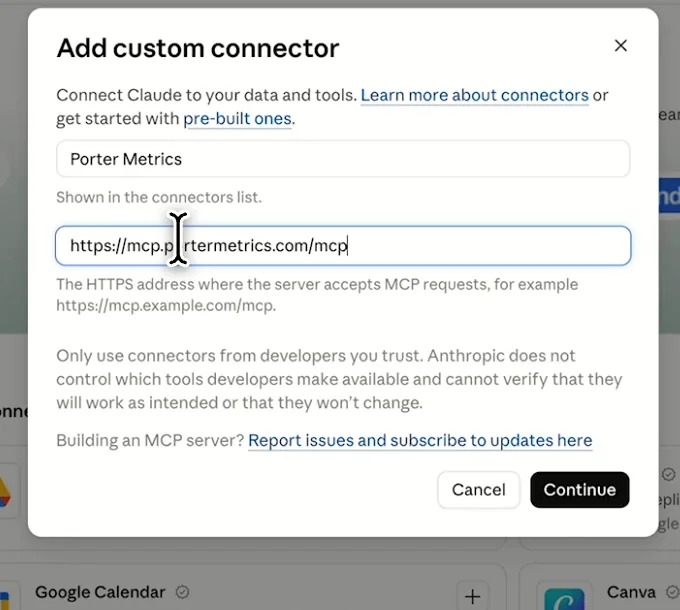
In Claude: Customize, Connectors, Add custom connector, then paste Porter’s MCP URL Paste the install prompt
Paste this prompt into a new chat and swap in your brand. The Free plan covers the last 15 days; comparisons with the 14 days before need the trial.
Install promptDuplicate this Claude dashboard template and keep its layout, views and styling: https://claude.ai/artifact/B8X4we9mpF95GJj8HFPcYb Then rebuild it with my own data through Porter: a social media dashboard for [brand] for the last 14 days across Instagram, Facebook Page, TikTok and LinkedIn Page, each on its own fields: KPI cards for followers, new followers, views or impressions, engagements and engagement rate; every network side by side; new followers and views per day by network; top posts across every network; engagements per post by post type; and GA4 Organic Social sessions, key events and purchase revenue by session source. Open in Claude with this prompt

The first thing Claude builds: KPI cards across your four networks. Demo data shown.
How to connect Instagram to Claude (no code)
Social media fields and data
The template reads each network on its own fields, so Instagram impressions and TikTok video views are never forced into one label.
Top 5 social media KPIs to watch
Trailgear demo data · last 14 days vs the 14 before
- New followers2,770+22.1%
One network carrying the growth while another stalls tells you where to post next.
- Engagement rate4.83%+0.2 pts
Read it per network. A drop on one network with steady views points to the posts, not the reach.
- Views and impressions2.14M+15.2%
Rising views with flat engagements means more people see you but fewer react; test new hooks.
- Engagements per post2,580+12.2%
Posting more with fewer engagements per post means volume is diluting results.
- Organic Social sessions1,806+6.9%
Engagement without sessions means posts entertain but do not send people to your site.
How the numbers are calculated
- Engagement rate
- Engagements ÷ views or impressions, per network.
- Engagements
- Instagram Post engagement; Facebook Page Engagements; TikTok likes, comments and shares; LinkedIn Engagements.
- Follower growth rate
- New followers ÷ followers at the start of the period.
- Engagements per post
- Engagements ÷ posts published.
- Change
- (This period − previous period) ÷ previous period.
Metrics
 Total followers
- Profile new followers
- Profile impressions
- Post engagement
 Page total followers
- Page new followers
- Page total impressions
- Page Engagements
 Total Followers
- Profile New Followers
- Profile Video Views
- Video Engagements
 New Followers
- Impressions
- Engagements
- Posts count
 Sessions
- Key events
- Purchase revenue
Dimensions
- Date
- Post type
- Post caption
- Post type
- Post message
- Video Caption
- Post Text
- Session source / medium
- Session default channel group
See all fields:Instagram Insights · 104 fieldsFacebook Insights · 277 fieldsTikTok Organic · 88 fieldsLinkedIn Pages · 159 fieldsGoogle Analytics 4 · 285 fields
What makes this social media dashboard different
Each network’s own app shows one account at a time. This puts all four on one screen and ties them to the visits they send.
Compare four networks without four logins
Every network sits in one table on its own fields.
See which network sends buyers
GA4 sessions and revenue by network sit next to the likes.
Ask why a network slipped in the same chat
Ask Claude which posts pulled TikTok or Facebook down.
Compare any two periods
Set any range against the one before or last year.
Send clients a report on your logo
Email it with your logo on the day you choose.
Share it without page access
Anyone with the link sees it, no admin seat on each network.
What the dashboard includes
- Six KPI cards across four networks
- Every network side by side
- New followers and views per day by network
- Share of followers and views
- Top posts across every network
- Results per post by format
- GA4 site visits and revenue by network
- Share by link, PDF or email
Related dashboard templates
 Claude
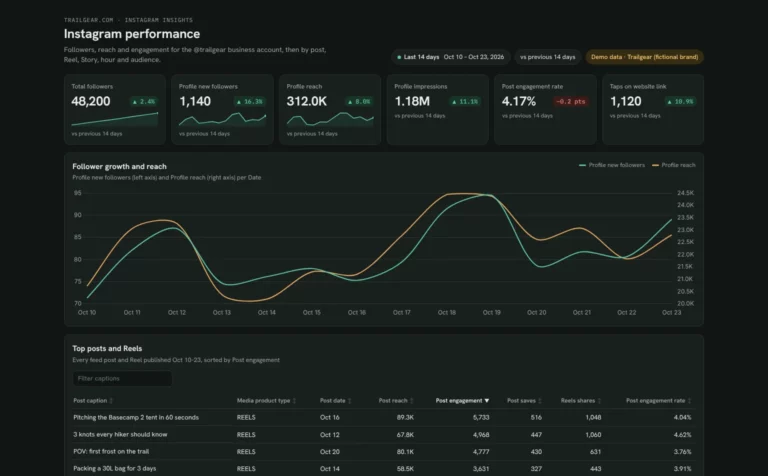
Instagram dashboard template
See which posts, Reels and Stories grow your account and when your followers are online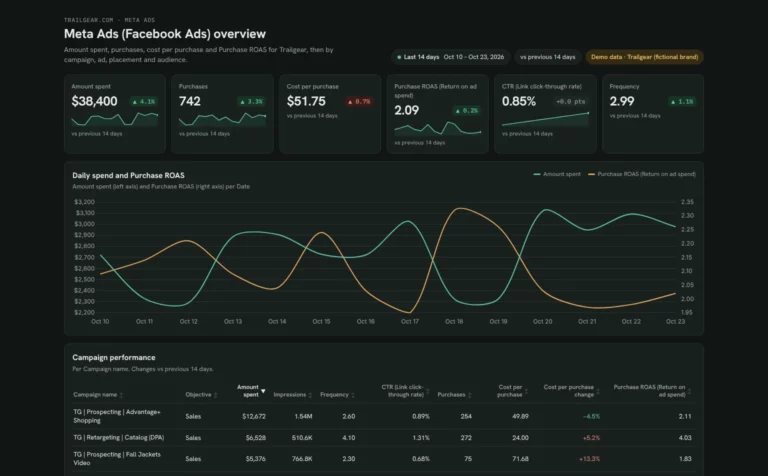 Claude

Meta Ads dashboard template
Track Meta Ads spend, ROAS and cost per purchase by campaign, ad and placement, and catch ad fatigue early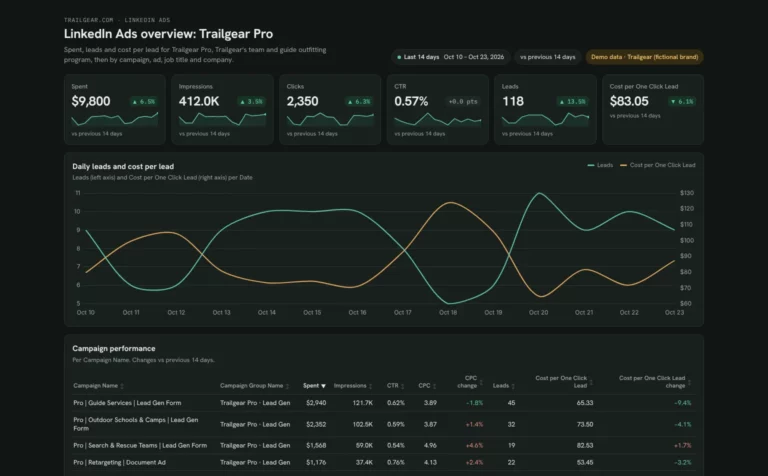 Claude
LinkedIn Ads dashboard template
Track LinkedIn Ads spend, leads and cost per lead by campaign, and see which job titles and companies your ads reach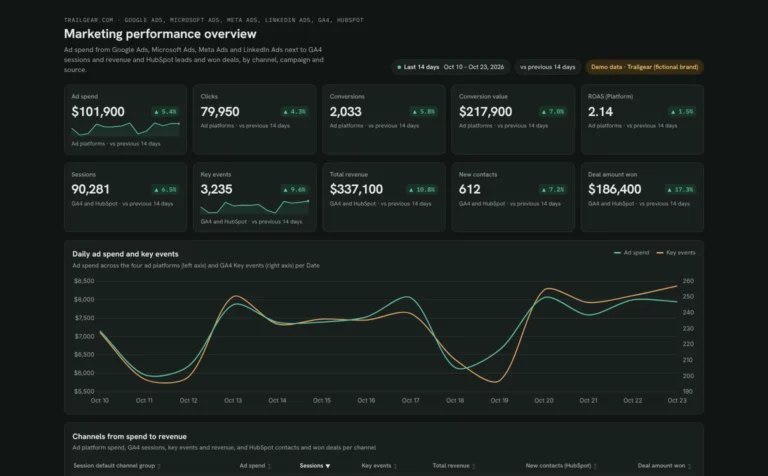 Claude


Marketing dashboard template
See which channels turn ad spend into leads, won deals and revenueBrowse more Claude dashboard templates
 Data Studio
 Google Sheets
 ChatGPT
Get your free social media dashboard
Connect your social accounts and paste the prompt. Your networks fill the same layout.
Free plan · 14-day trial · No card needed