





Trusted by 1,600+ marketing teams and agencies


What you can do with this PPC dashboard
Seven jobs this dashboard does. Click one to see its view on demo data, then paste its prompt into the same Claude chat.

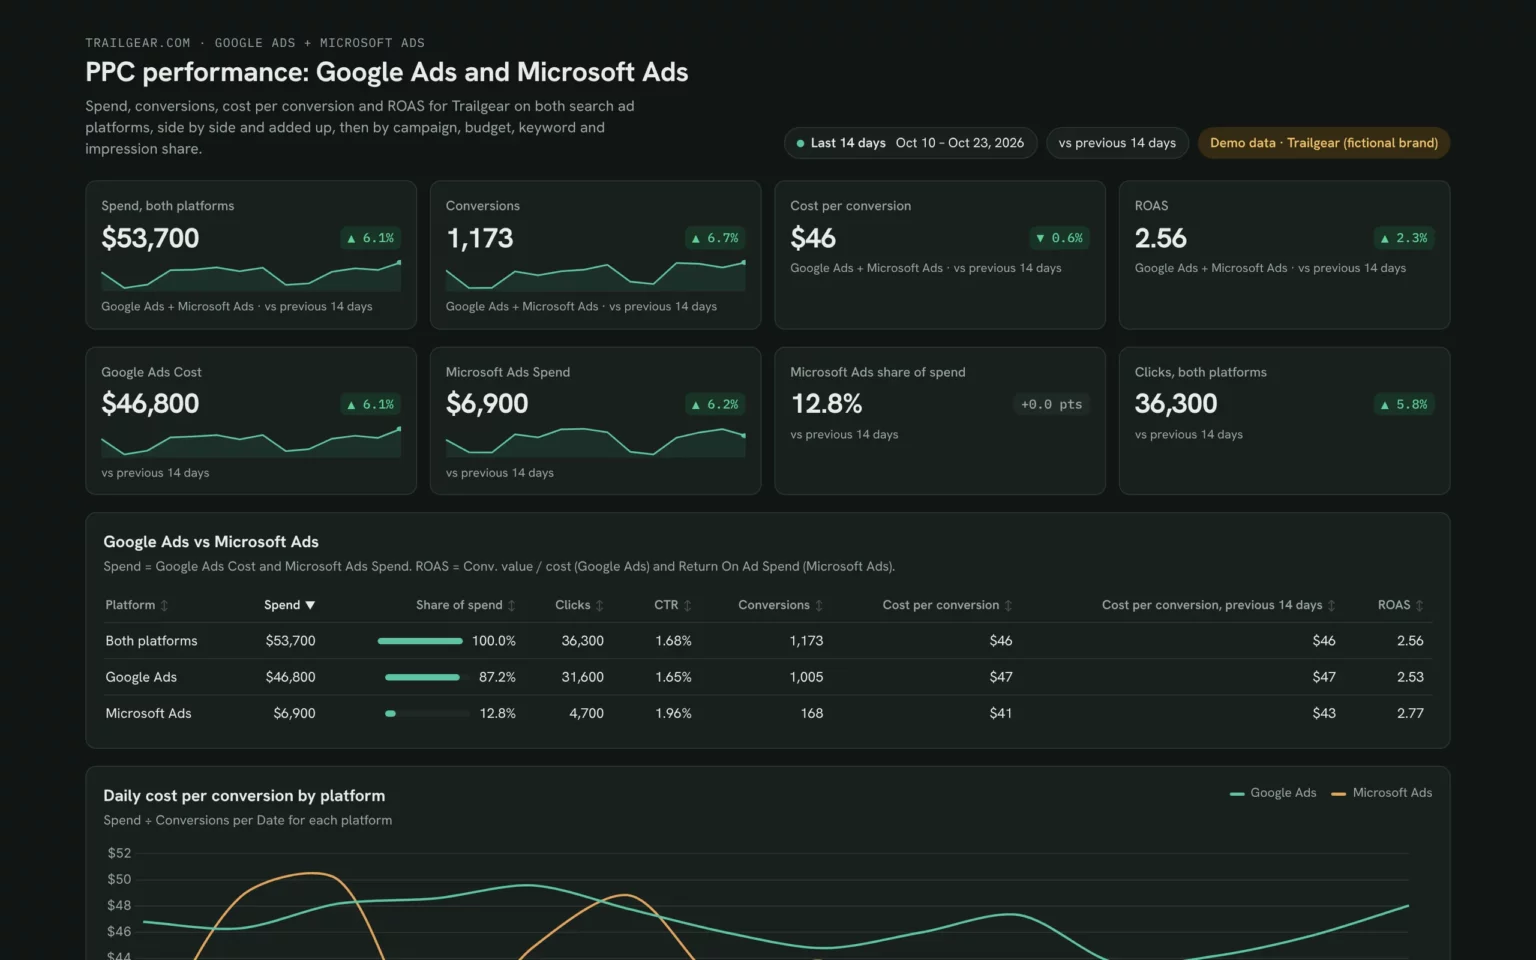
See which platform converts cheaper
Spend, conversions, cost per conversion and ROAS per platform, so you know where the next dollar should go.
- Does Microsoft Ads convert cheaper than Google Ads?
- What share of spend goes to each platform?
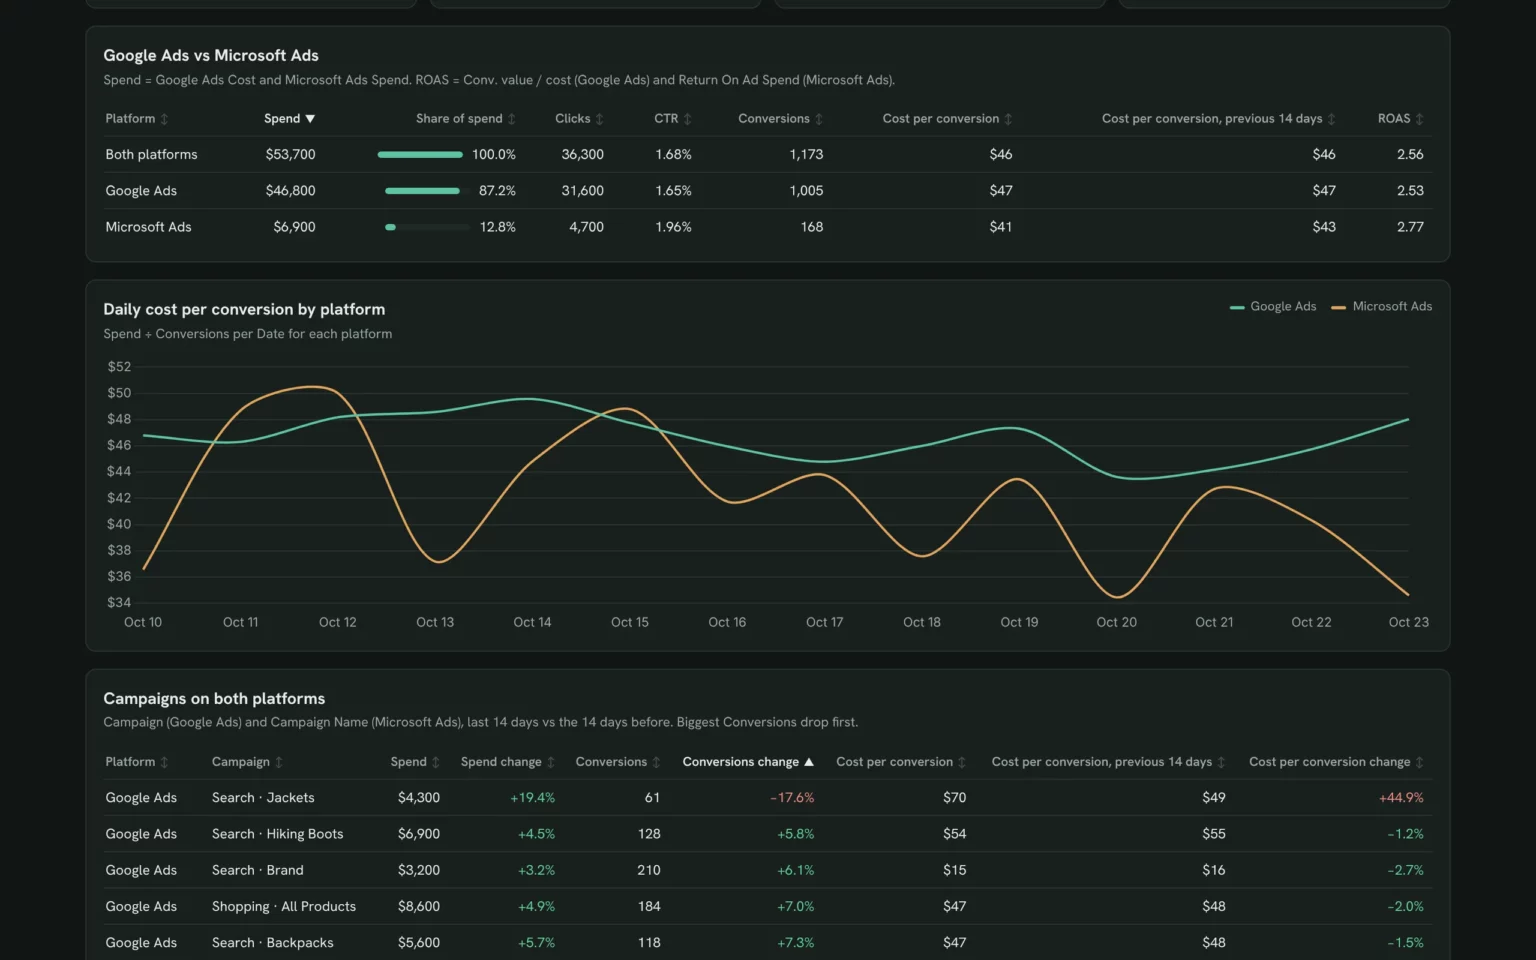
Compare Google Ads and Microsoft Ads for the last 14 days: spend, share of spend, conversions, cost per conversion and ROAS.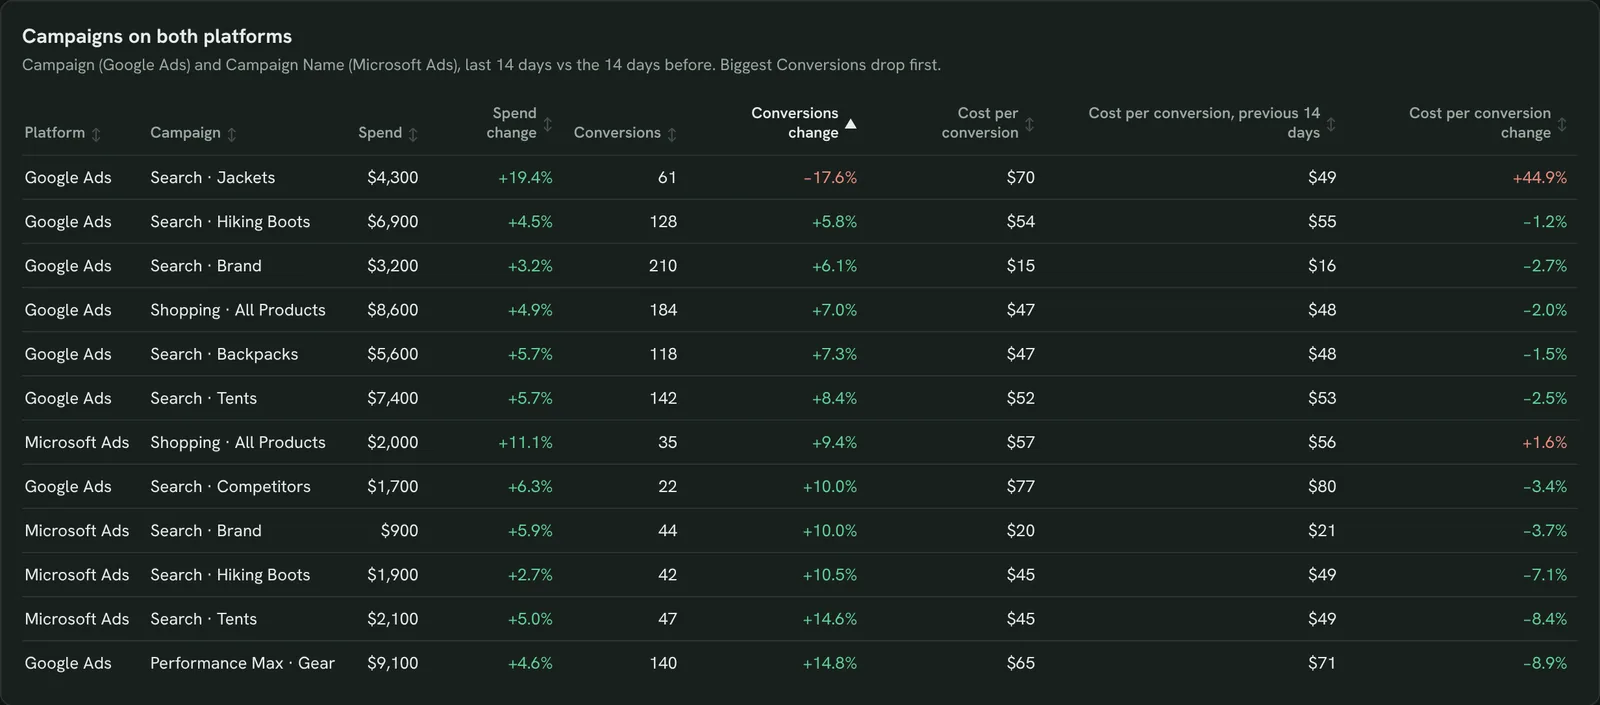
Spot campaigns going off track on either platform
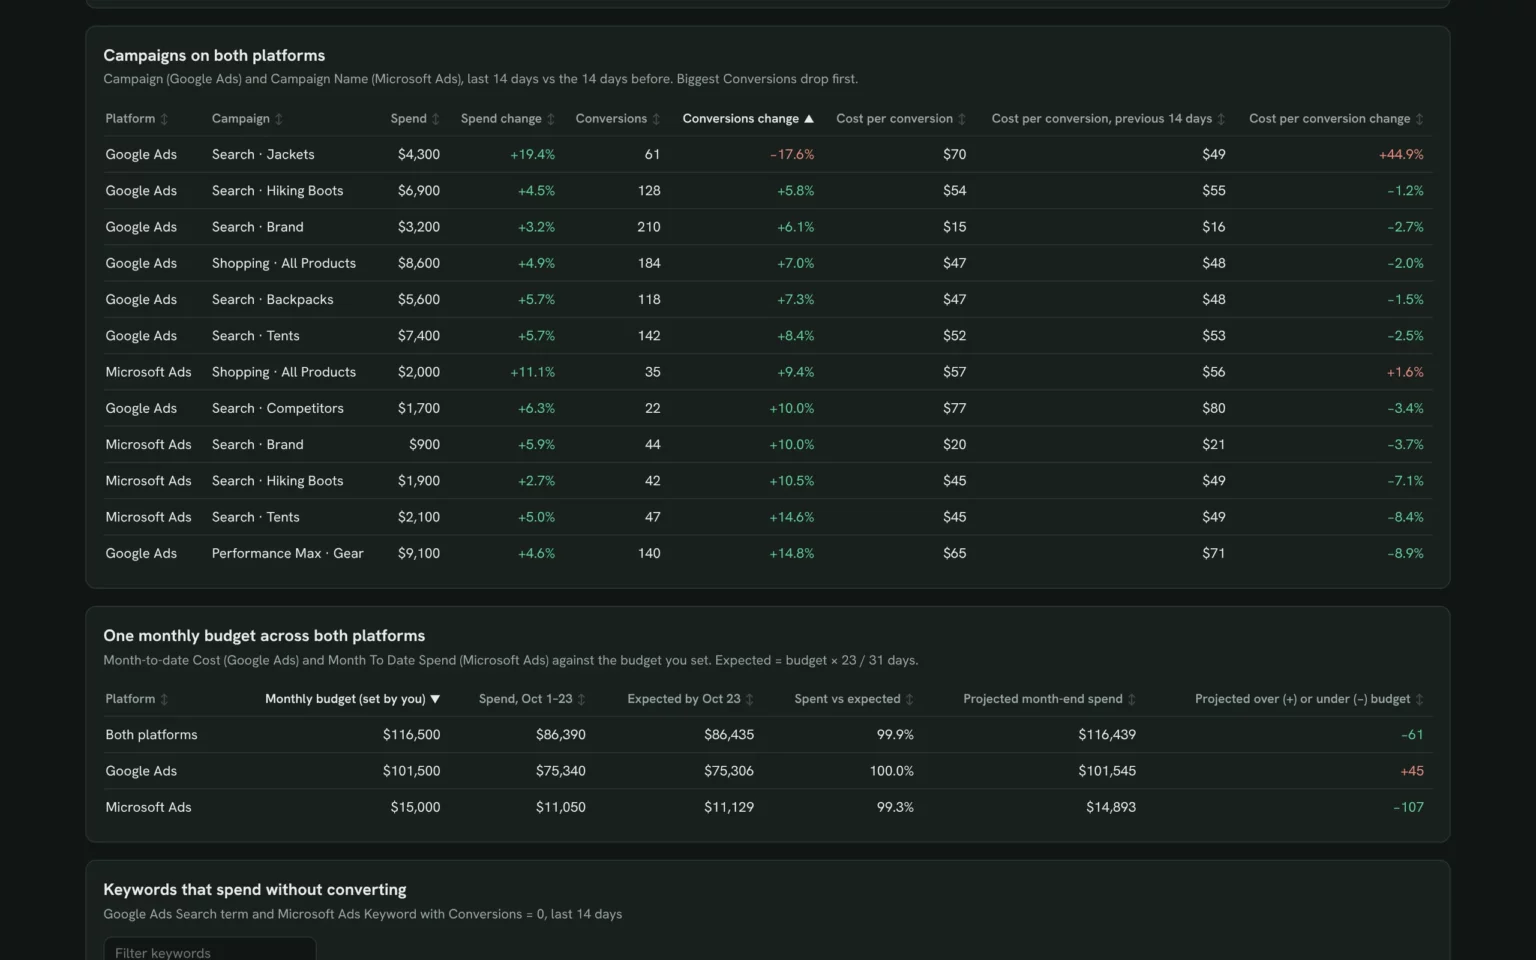
Every campaign from both accounts against the 14 days before, so a slipping one shows up on either platform.
- Which campaigns lost conversions this period?
- Where did cost per conversion jump?
List campaigns from both platforms with spend, conversions and cost per conversion for the last 14 days vs the 14 before.
Pace one budget across both platforms
Spend this month per platform against your budget, so the combined budget lands where you planned.
- Are we on pace across both platforms?
- Which platform will go over its budget?
My monthly budgets are [Google Ads budget] and [Microsoft Ads budget]. Show spend month to date and projected month-end spend per platform.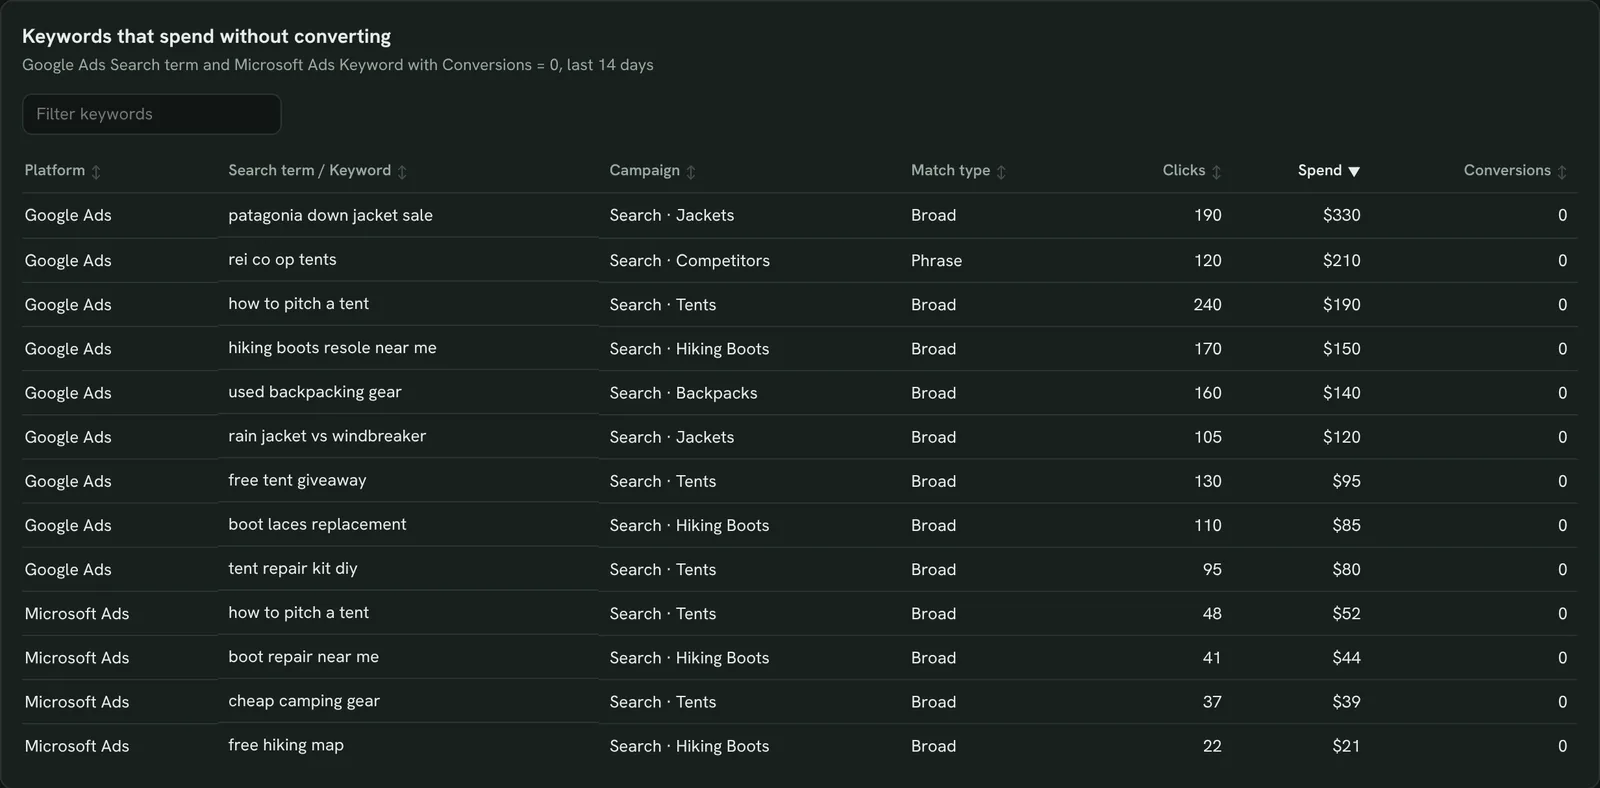
Find keywords that spend without converting
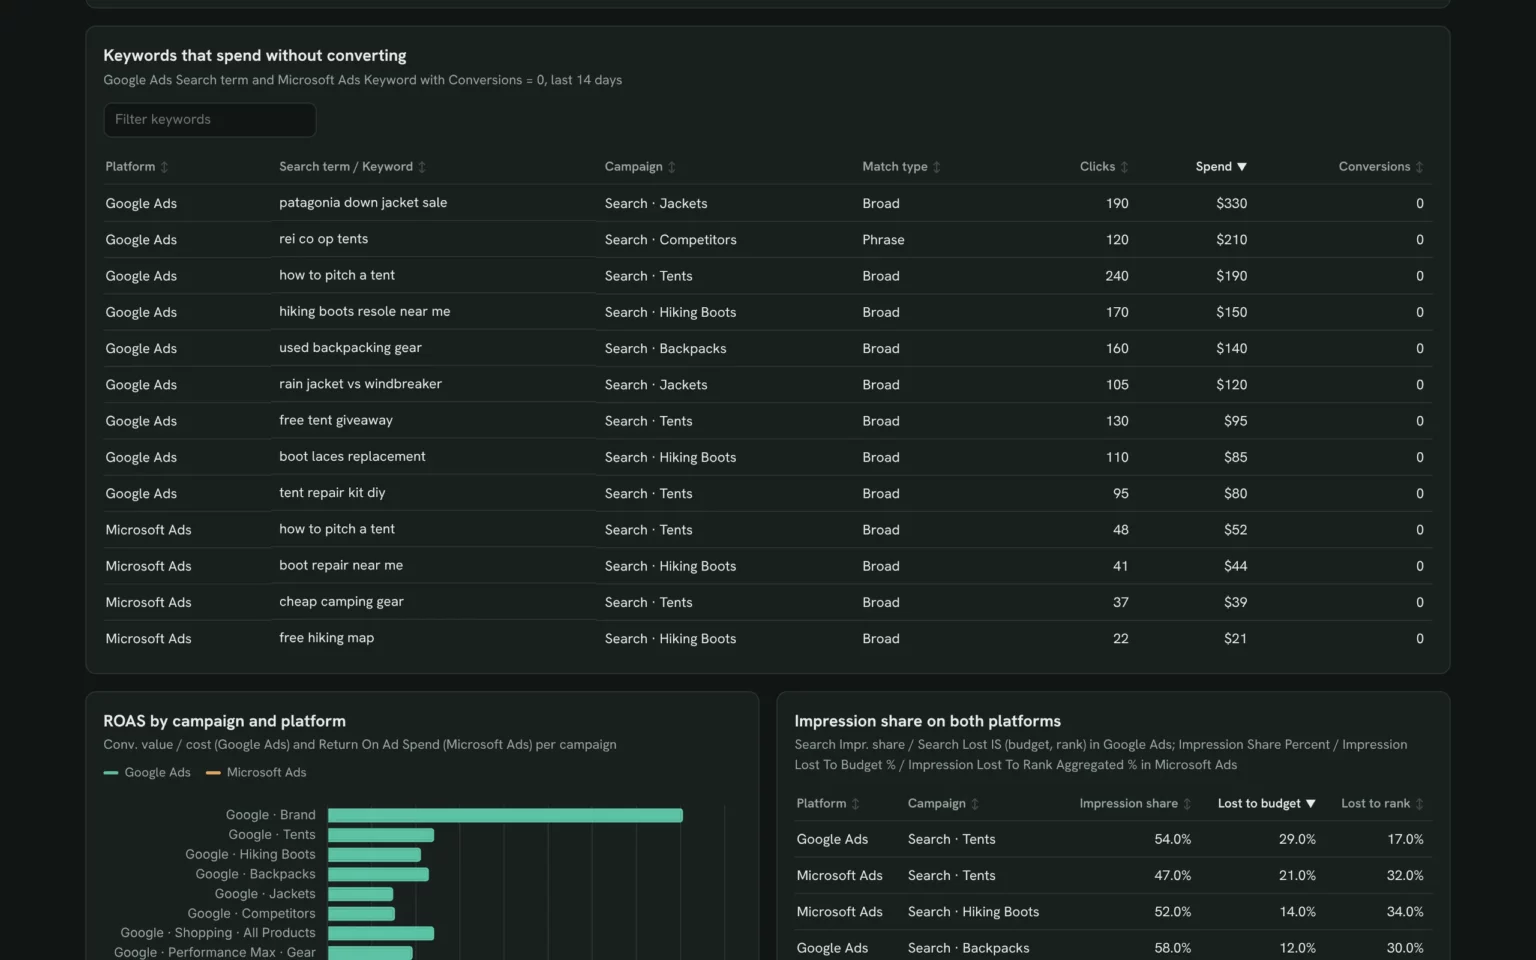
Google search terms and Microsoft keywords with spend and no conversions, so you add negatives on both.
- Which keywords cost money and brought nothing?
- Does the same waste show up on both platforms?
List Google Ads search terms and Microsoft Ads keywords with clicks and 0 conversions in the last 14 days, by spend.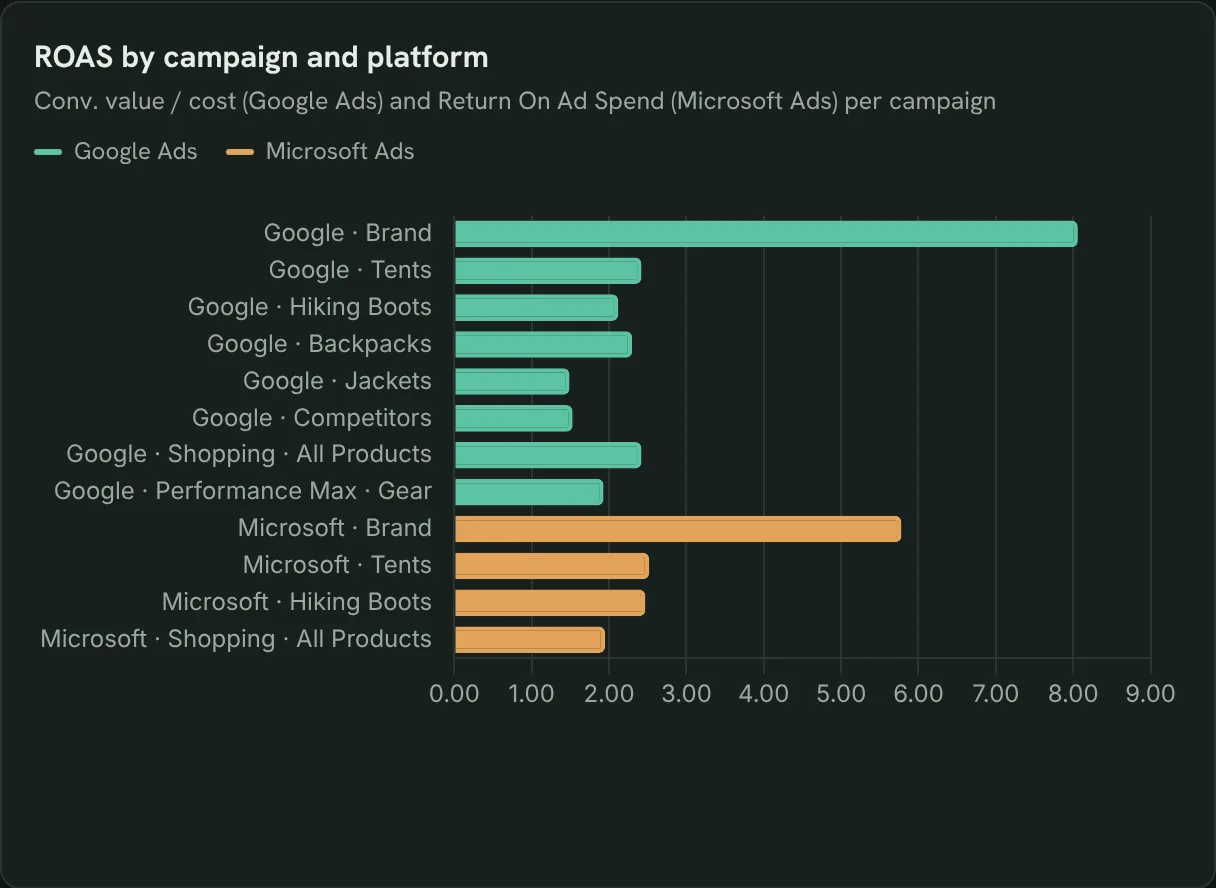
Compare ROAS by campaign and platform
Return on ad spend for every campaign on both platforms, so you see which pay back.
- Which campaigns pay back on each platform?
- Does the same campaign earn more on Microsoft Ads?
Chart ROAS per campaign and platform for the last 14 days.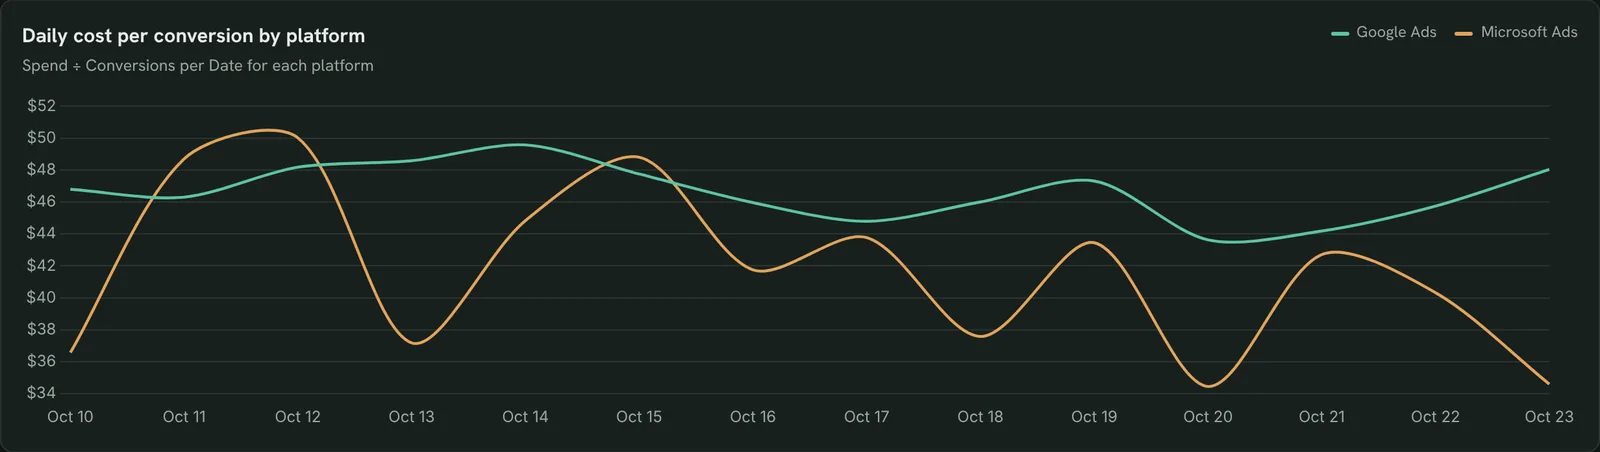
Catch cost per conversion jumps early
Daily cost per conversion per platform, so a sudden jump stands out the next day.
- On which days did cost per conversion spike?
- Was it one platform or both?
Chart daily cost per conversion for Google Ads and Microsoft Ads over the last 14 days.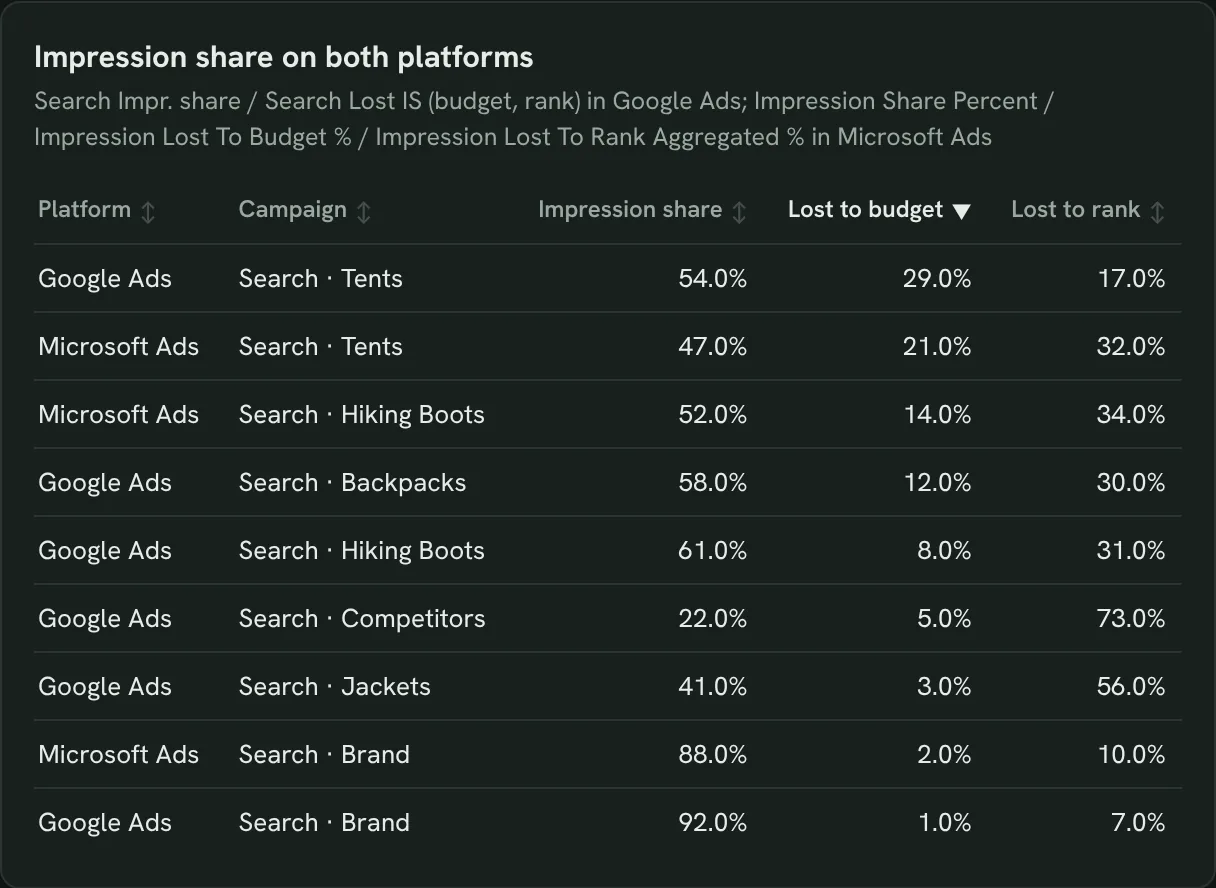
Check impression share on both accounts
Impression share lost to budget or rank on both platforms, so you know where budget buys reach.
- Which campaigns are capped by budget?
- Where do we lose on ad rank?
Show impression share and share lost to budget and rank for Search campaigns on both platforms, last 14 days.How to set up the PPC dashboard in Claude
You need a Google Ads and a Microsoft Ads account you can sign in to, a free Porter account and Claude Pro, Max, Team or Enterprise for Claude Dashboards. The whole setup takes about 10 minutes.
Connect Google Ads and Microsoft Ads in Porter
Sign up free at Porter, open Data sources and connect Google Ads, then Microsoft Ads, and select your ad accounts. The Microsoft Ads to Claude tutorial shows each click.
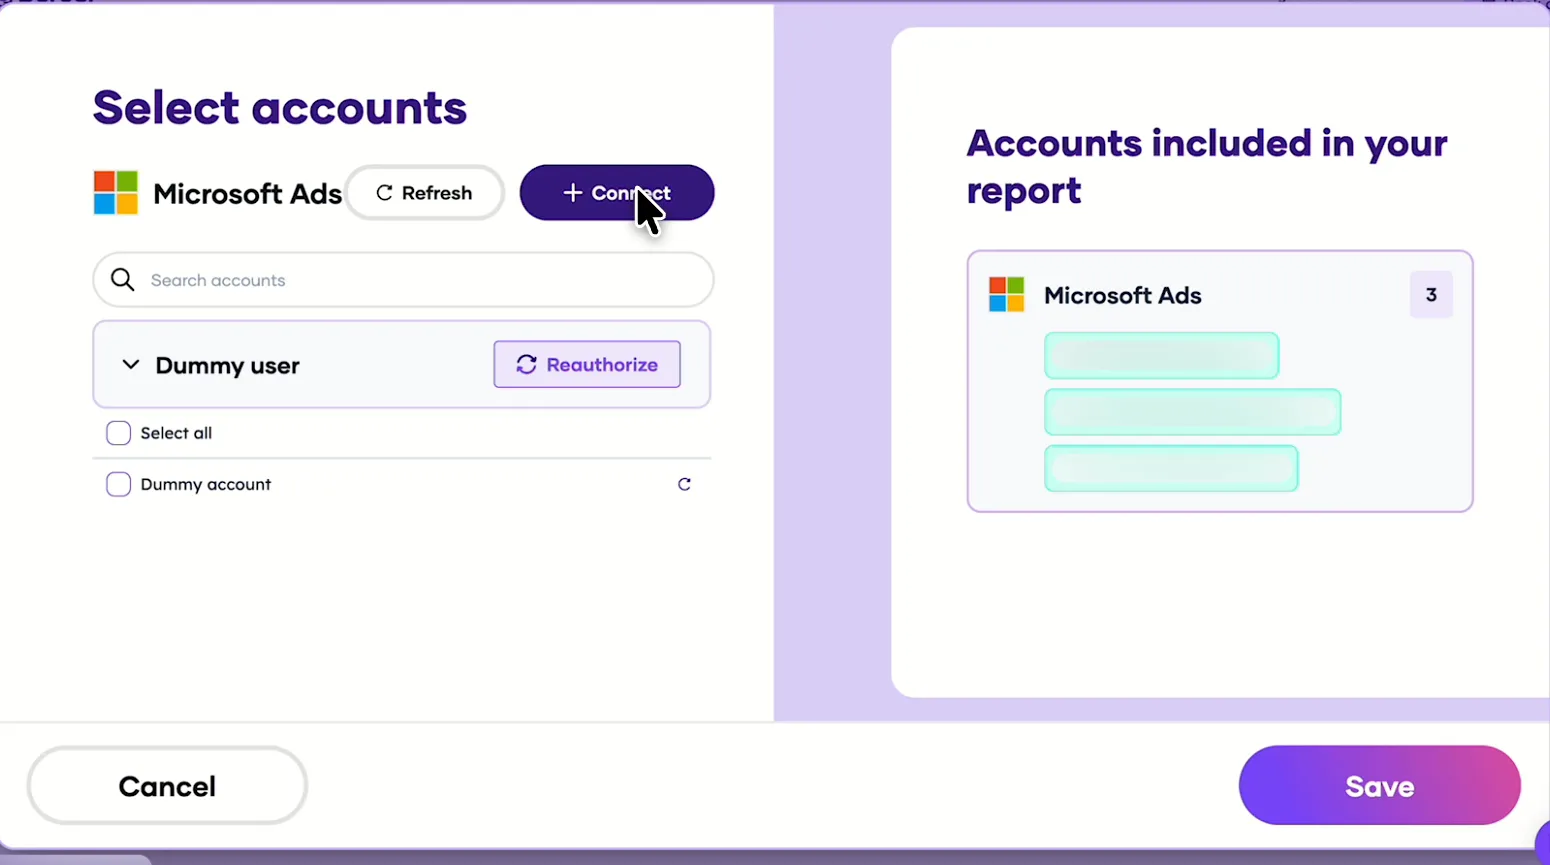
Pick the Microsoft Ads accounts Claude can read, after connecting Google Ads the same way. Add Porter to Claude
In Claude, go to Customize → Connectors → Add custom connector, paste https://mcp.portermetrics.com/mcp and name it Porter Metrics. Click Continue, then sign in to Porter and allow access.
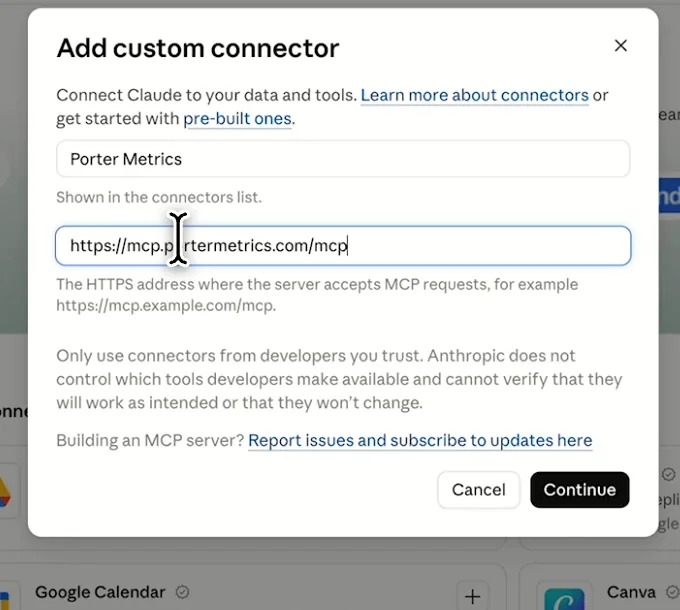
In Claude: Customize, Connectors, Add custom connector, then paste Porter’s MCP URL Paste the install prompt
Open a new chat in Claude, paste this prompt and replace the accounts in brackets with your own. Claude queries both platforms through Porter and builds the dashboard.
Install promptDuplicate this Claude dashboard template and keep its layout, views and styling: https://claude.ai/artifact/UNZUpmGsGDDitVMuj4JftX Then rebuild it with my own data through Porter: a PPC dashboard for [Google Ads account] and [Microsoft Ads account] for the last 14 days, with Google Ads Cost and Microsoft Ads Spend as one spend column: KPI cards for spend, conversions, cost per conversion and ROAS; a platform comparison; daily cost per conversion per platform; campaigns from both; keywords with spend and no conversions; ROAS by campaign; and impression share lost to budget and rank. Open in Claude with this prompt
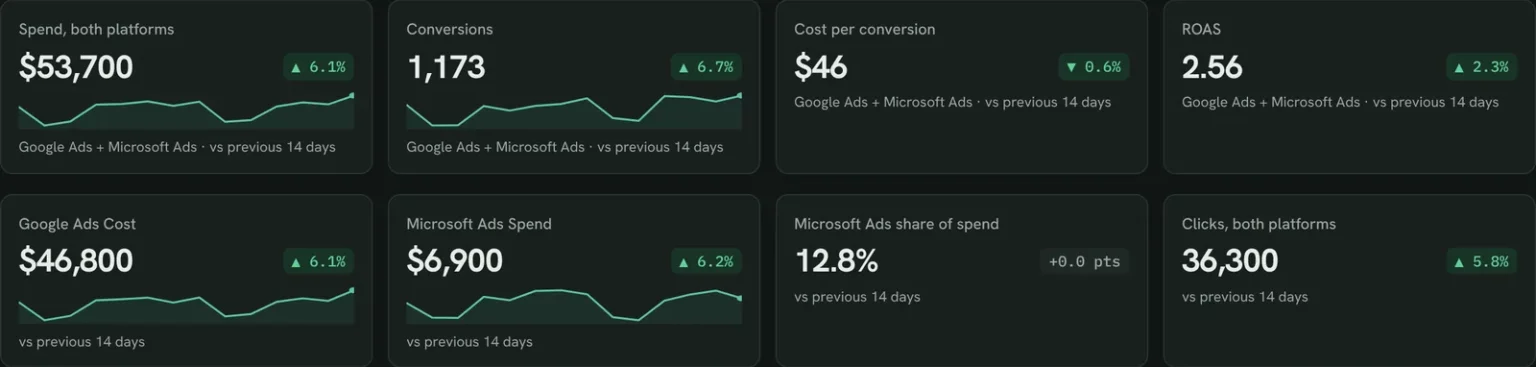
The first thing Claude builds: KPI cards for both platforms together. Demo data shown.
How to use the Google Ads MCP in Claude (no code)
PPC dashboard fields and data
Google Ads calls spend Cost and Microsoft Ads calls it Spend; the template puts both in one column. Porter reads 1,042 Google Ads and 412 Microsoft Ads fields.
Top 5 PPC KPIs to watch
Trailgear demo data · last 14 days vs the 14 before
- Spend, both platforms$53,700+6.1%
Check that it moves with conversions, not ahead of them.
- Conversions1,173+6.7%
Open the campaigns table to see which platform moved it.
- Cost per conversion$45.78-0.6%
A gap between platforms that lasts weeks says where to shift budget.
- ROAS2.56+2.3%
Below 1, a campaign earns less than it costs.
- Spend vs budget99.9%of expected by Oct 23
Above 100% you will overspend the month; below, you have room.
How the numbers are calculated
- Spend
- Google Ads Cost + Microsoft Ads Spend.
- Cost per conversion
- Spend ÷ conversions.
- ROAS
- Conversion value ÷ spend.
- Spend vs budget
- Spend to date ÷ (budget × days passed ÷ days in month).
- Change
- (This period − previous) ÷ previous.
Data sources
Metrics
 Cost
- Clicks
- Impressions
- Conversions
- Conv. value / cost
- Search Impr. share
- Search Lost IS (budget)
- Search Lost IS (rank)
 Spend
- Clicks
- Impressions
- Conversions
- Return On Ad Spend
- Impression Share Percent
- Impression Lost To Budget %
- Impression Lost To Rank Aggregated %
Dimensions
- Date
- Campaign
- Search term
- Query match type
- Date
- Campaign Name
- Keyword
- Match Type
See all fields:Google Ads · 1,042 fieldsMicrosoft Ads · 412 fields
What makes this PPC dashboard different
What you get that switching between the Google Ads and Microsoft Advertising interfaces can’t give you.
See both platforms in one table
Spend and cost per conversion add up across both, with no spreadsheet.
Ask the next question in the same chat
See Microsoft Ads convert cheaper, then ask Claude why.
Act on both accounts after you approve
Pause a campaign or change a budget on either platform. Porter asks first.
Compare any two periods
Put the last 14 days next to the 14 before or last year.
Send clients a report on your logo
Publish it in Porter and email it on the day you choose.
Share it without ad account access
Anyone with the Porter link sees both platforms.
What the dashboard includes
- KPI cards across both platforms and per platform
- Platform comparison, daily cost per conversion and campaign tables
- Budget pacing, wasted keywords, ROAS and impression share
Related dashboard templates
 Claude
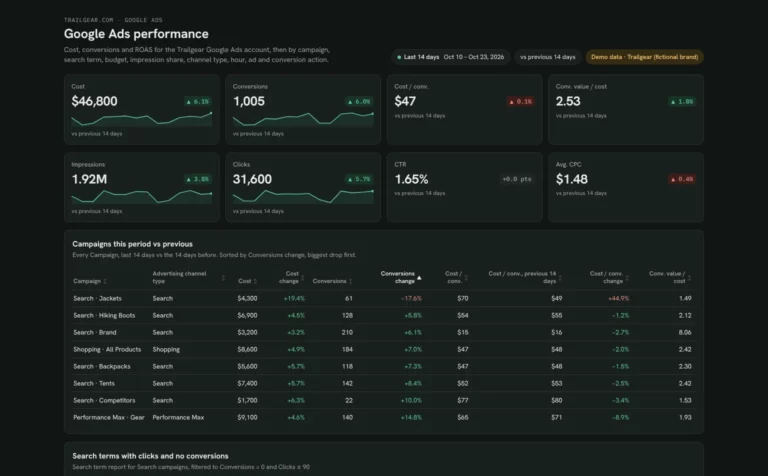
Google Ads dashboard template
Find search terms that waste spend and see which campaigns are limited by budget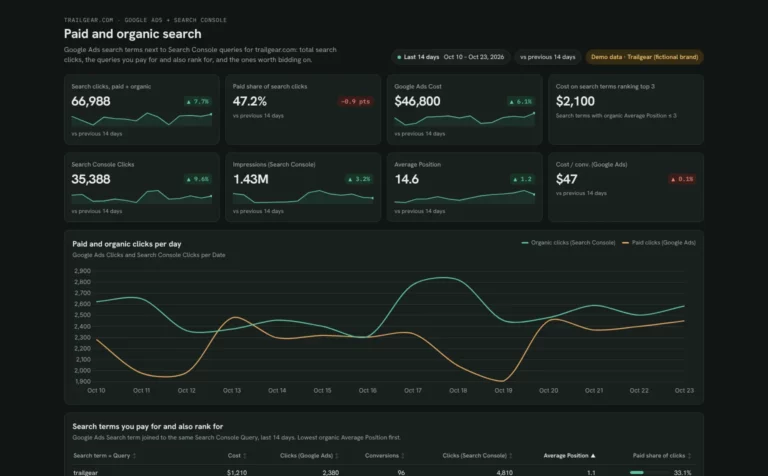 Claude

SEM dashboard template
Find search terms you pay for but already rank for, and queries worth bidding on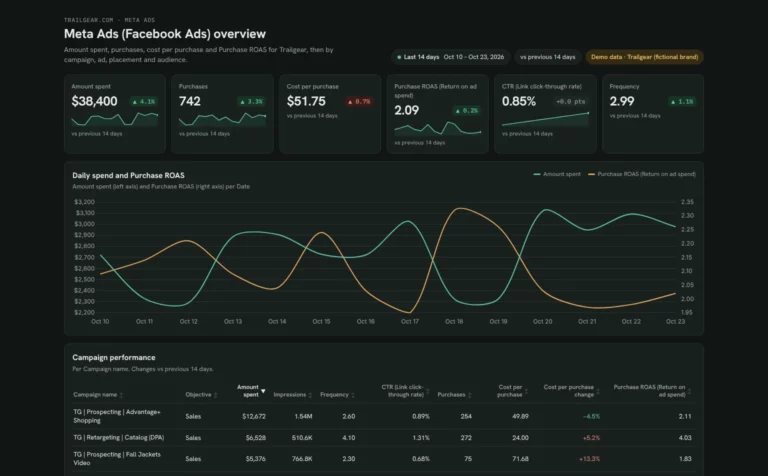 Claude

Meta Ads dashboard template
Track Meta Ads spend, ROAS and cost per purchase by campaign, ad and placement, and catch ad fatigue early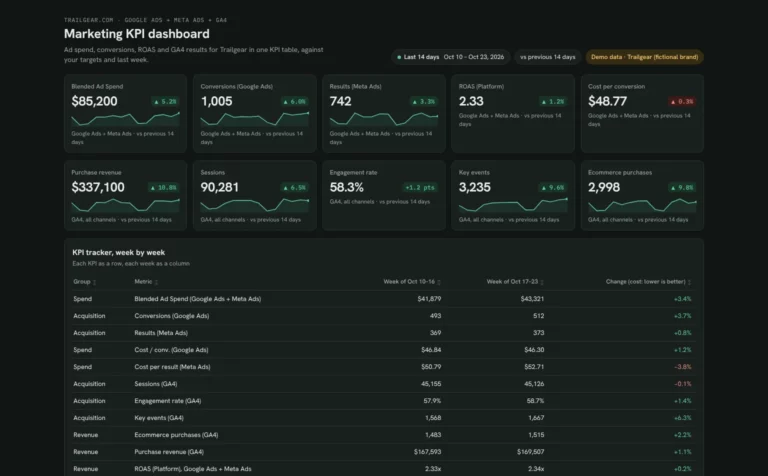 Claude

Marketing KPI dashboard template
Track ad spend, conversions and revenue week by week against your targetsBrowse more Claude dashboard templates
 Data Studio
 Google Sheets
 ChatGPT
Get your free PPC dashboard
Sign up free, connect Google Ads and Microsoft Ads and paste the prompt. Your own data fills the same layout as the demo.
Free plan · 14-day trial · No card needed