





Trusted by 1,600+ marketing teams and agencies


What you can do with this Facebook Page dashboard
Click a job to see it on demo data, then paste its prompt into Claude.
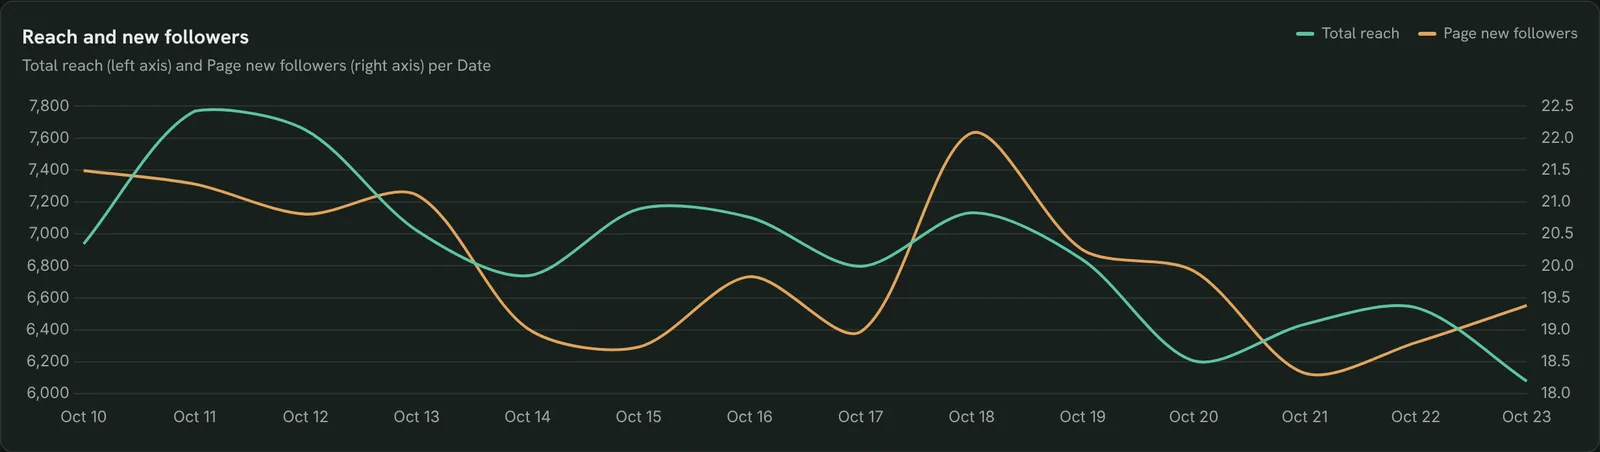
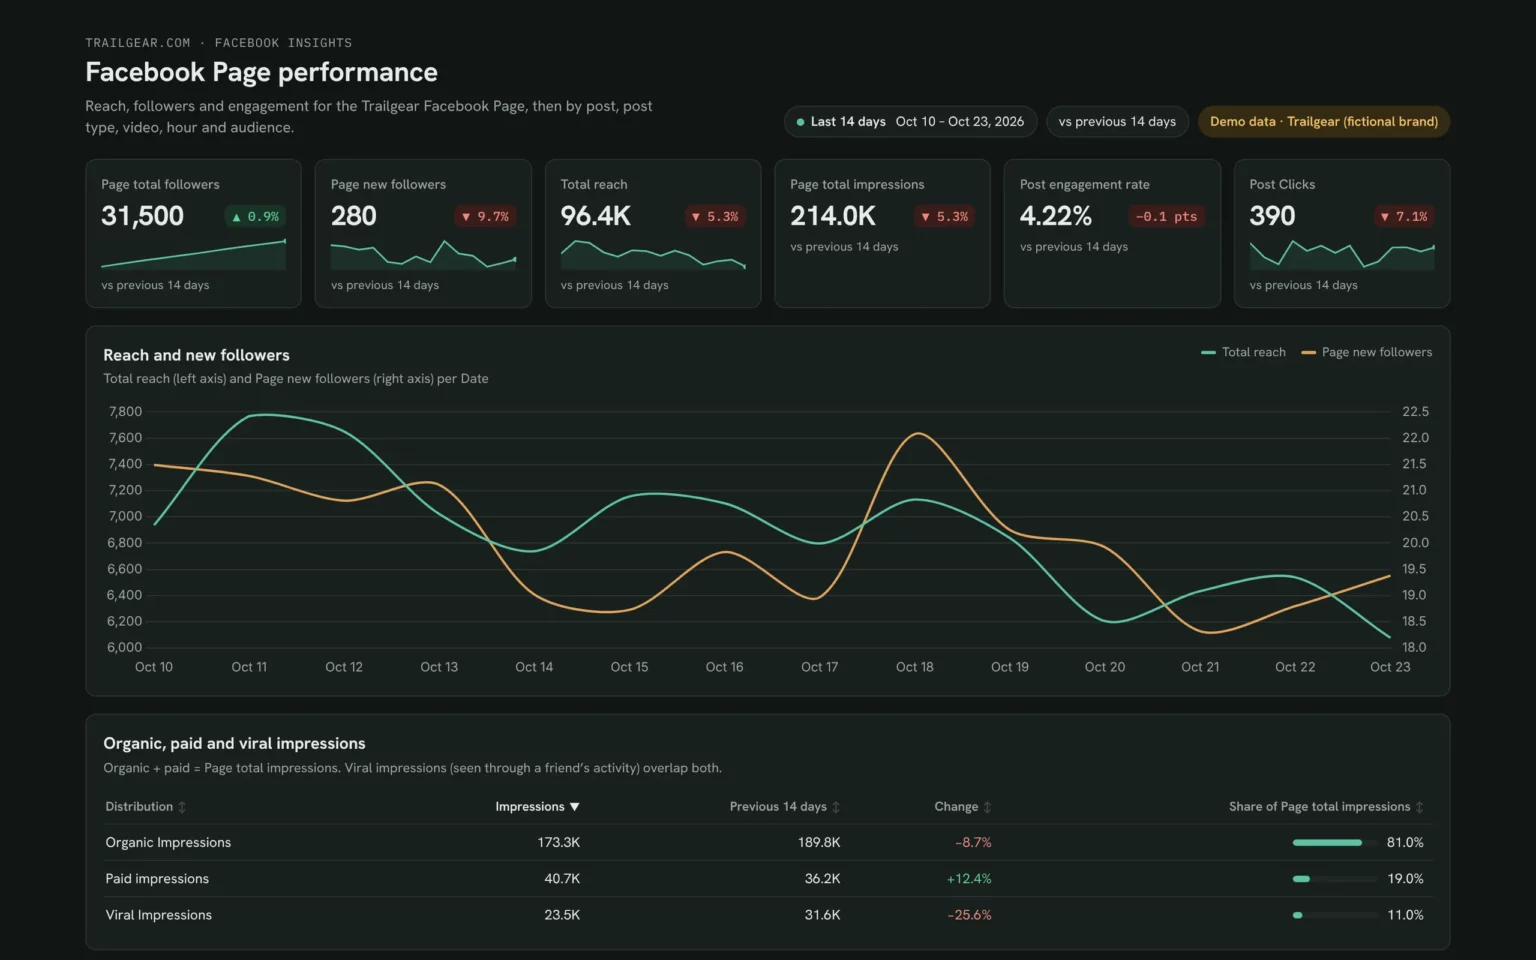
Track reach and new followers
Reach and new followers by day, so a slow week shows up before the month ends.
- Is reach falling or holding?
- Which days brought the most followers?
Chart Total reach and Page new followers per day for the last 14 days.
Find out why reach dropped
Organic, paid and viral impressions against the 14 days before, so you know which source fell.
- Did organic or paid impressions drop?
- Are fewer people sharing our posts?
Show Organic Impressions, Paid impressions and Viral Impressions for the last 14 days next to the 14 days before.Also built for this: Meta Ads dashboard template
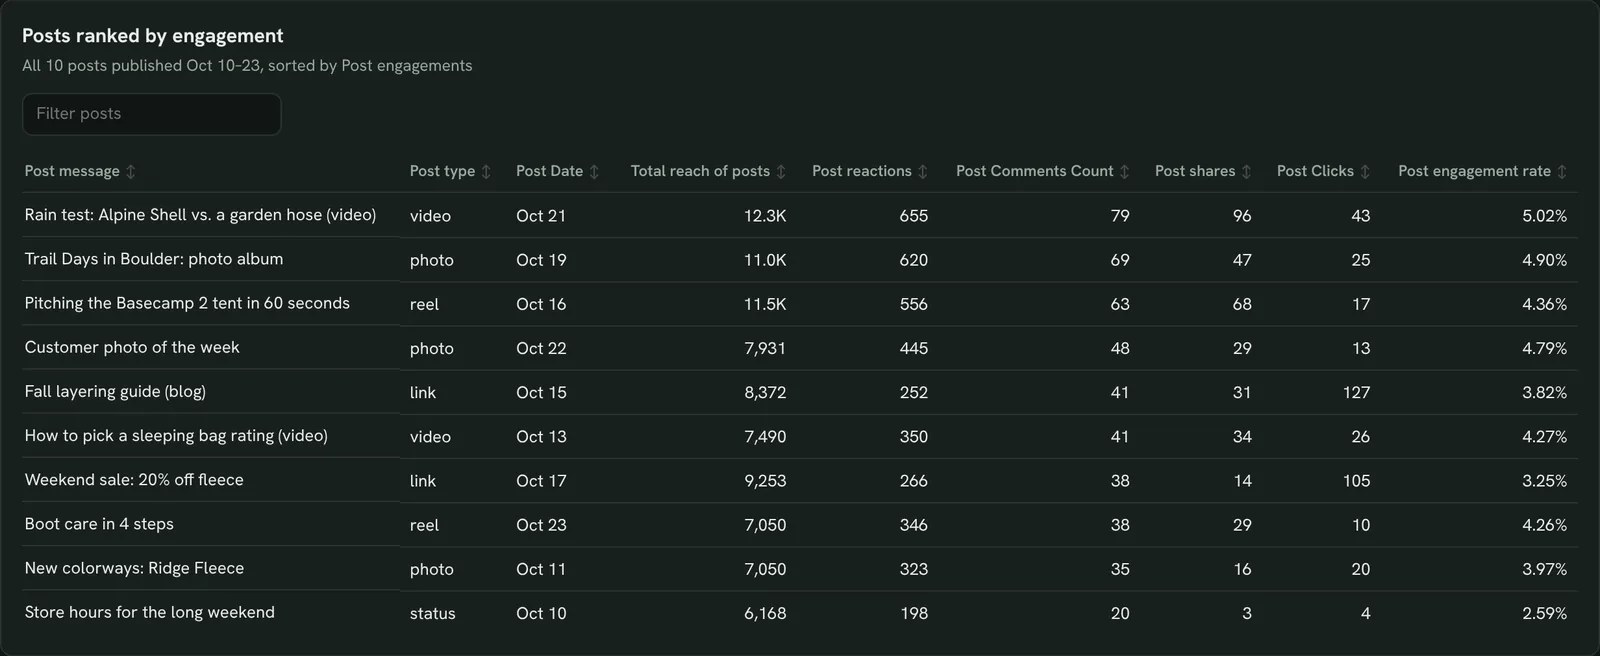
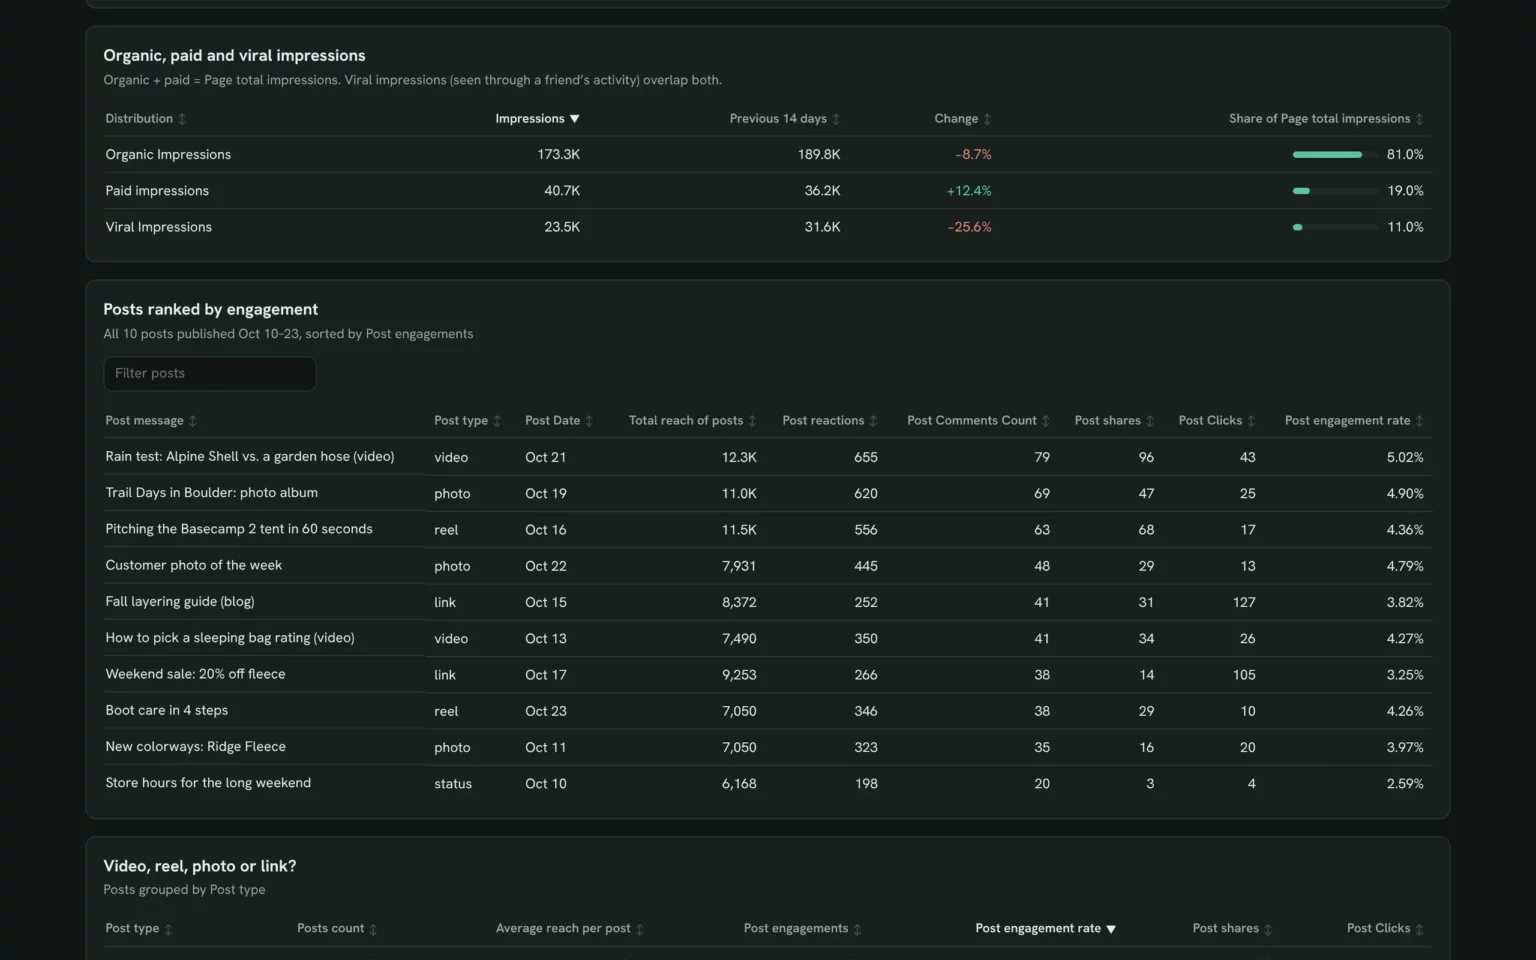
Rank posts by engagement
Every post with reactions, comments, shares and clicks, so you know what to post again.
- Which post got the most shares?
- Which posts sent the most clicks?
List my Facebook posts from the last 14 days with Post type, Total reach of posts, Post reactions, Post Comments Count, Post shares, Post Clicks and Post engagement rate.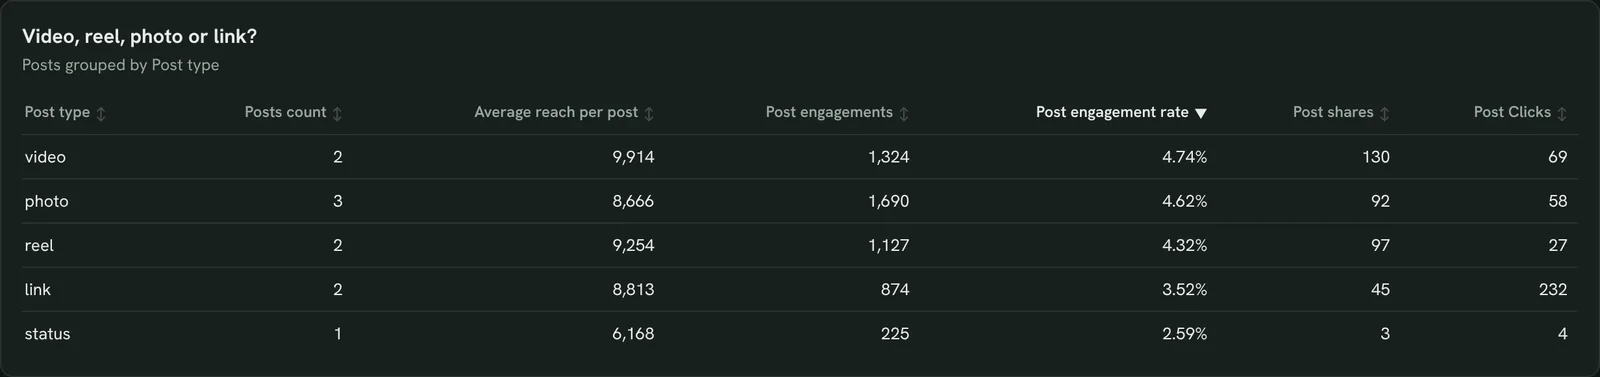
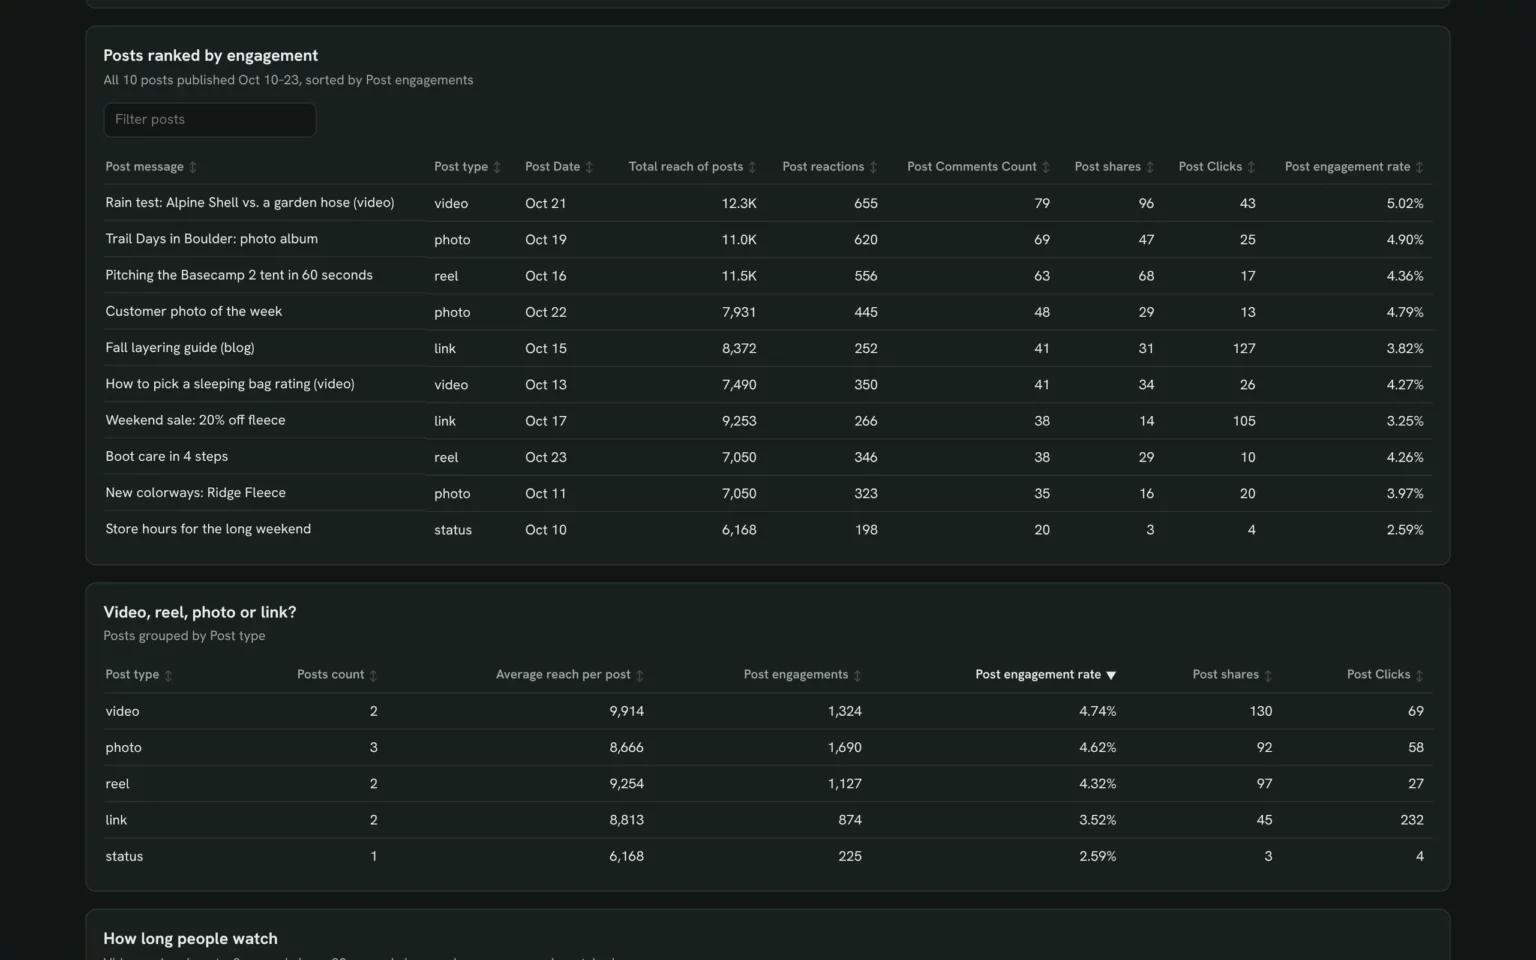
Pick the post type that works
Video, reel, photo and link posts side by side, so your time goes to the format your followers answer.
- Do videos beat photos on engagement rate?
- Which type sends the most clicks?
Group my Facebook posts from the last 14 days by Post type with Posts count, Post engagements, Post engagement rate, Post shares and Post Clicks.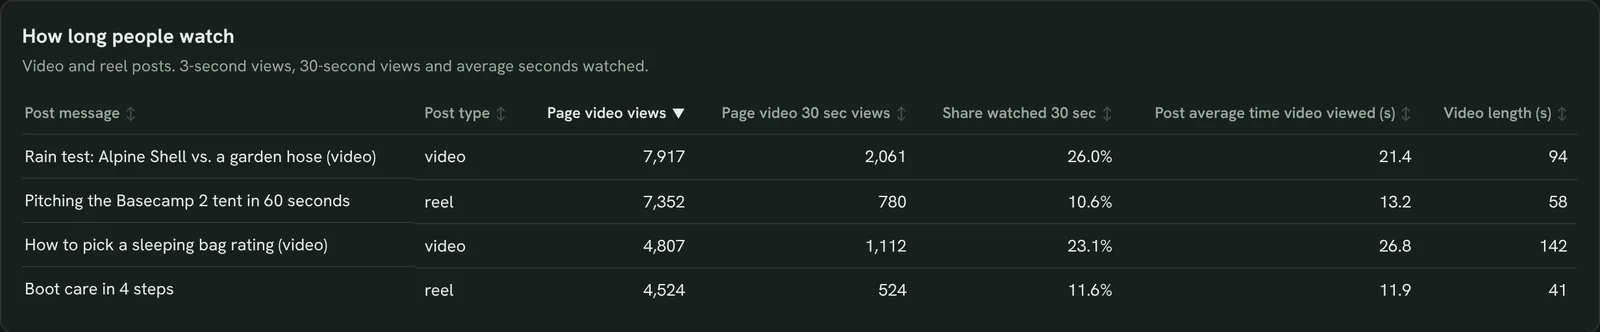
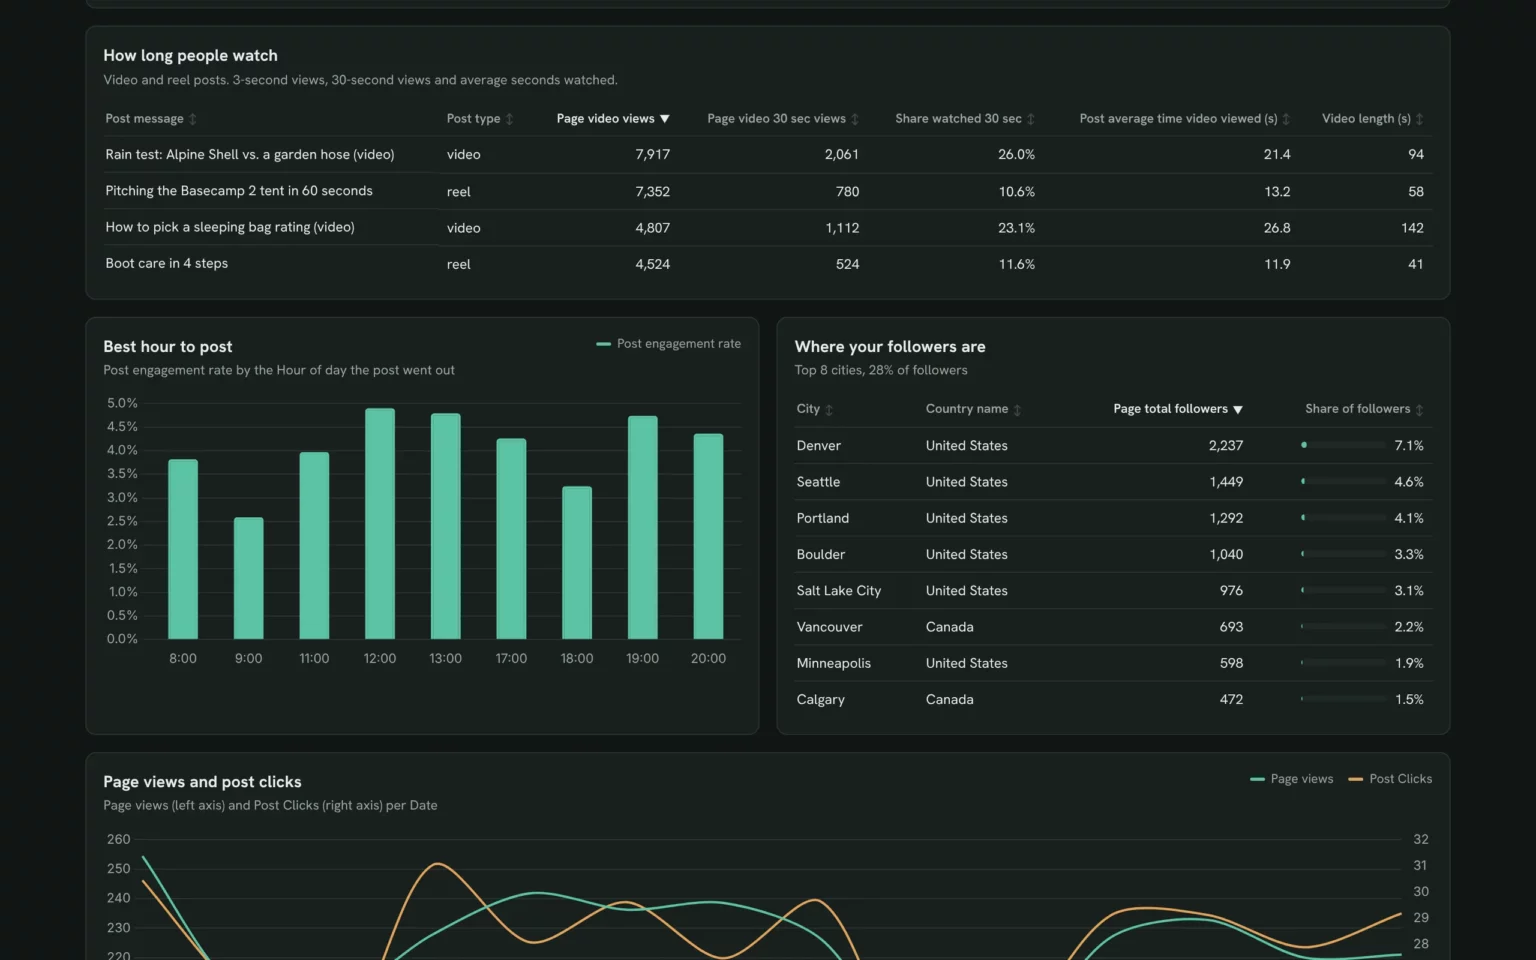
See how long people watch your videos
3-second views next to 30-second views and average watch time, so you see whether the hook or the length loses people.
- Which video keeps people 30 seconds?
- Do short reels hold viewers better?
List my video and reel posts from the last 14 days with Page video views, Page video 30 sec views and Post average time video viewed.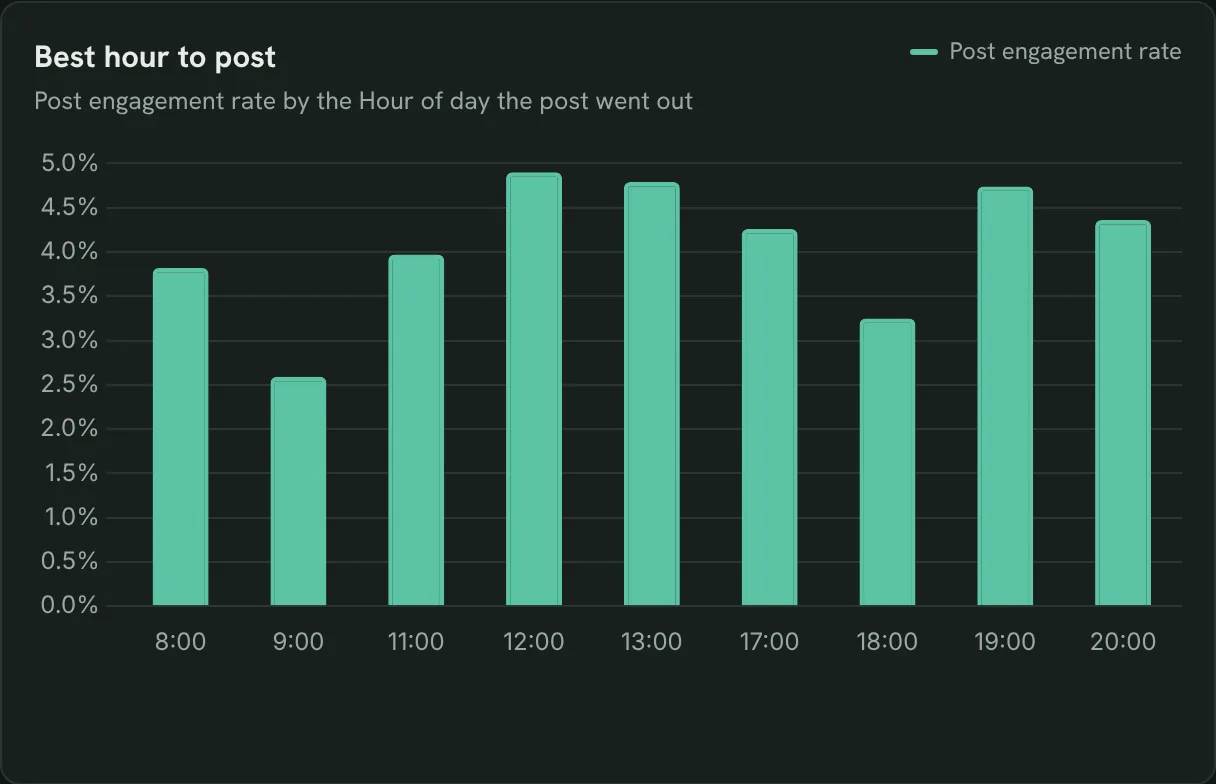
Find your best hour to post
Engagement rate by the hour each post went out, so you schedule the next one when it lands best.
- Which posting hour gets the best engagement rate?
- Do morning posts lag behind?
Show Post engagement rate by Hour of day for posts published in the last 14 days.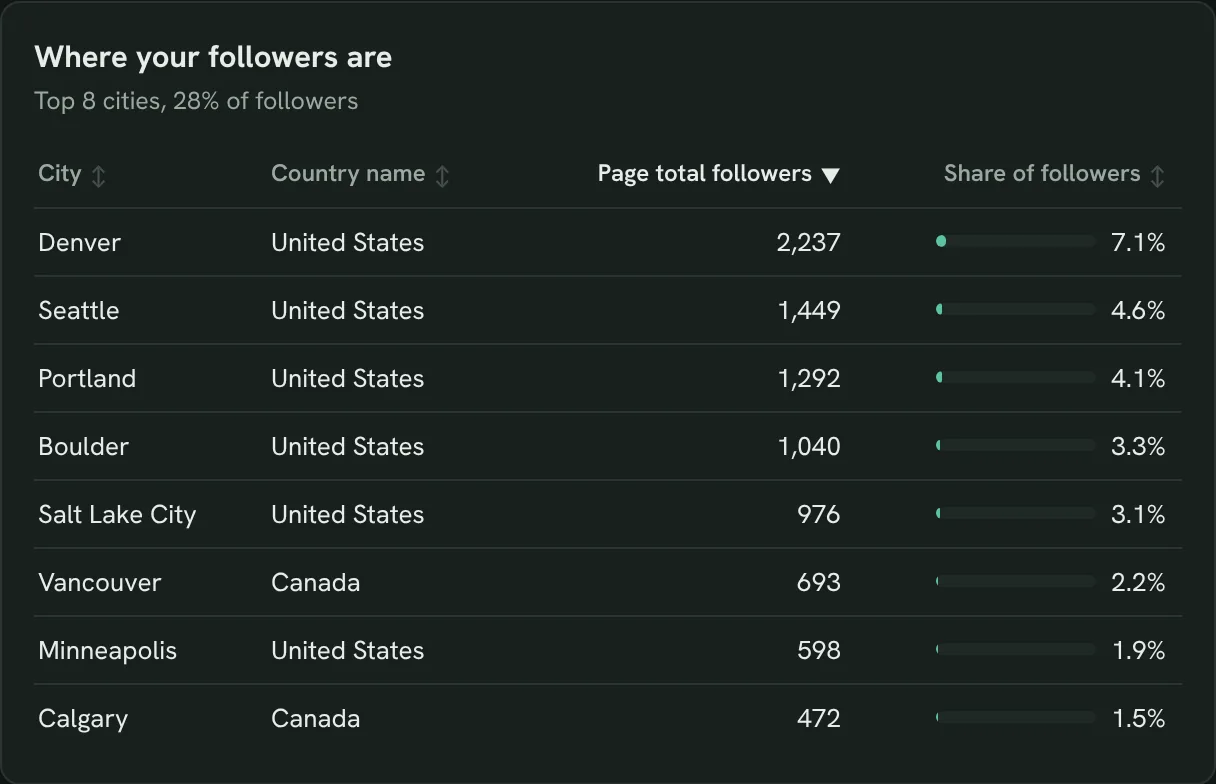
See where your followers live
Followers by city and country, so local posts and events go where your audience is.
- Which cities have the most followers?
- How many follow from outside the US?
Show Page total followers by City and Country name, top 10.Also built for this: Instagram dashboard template
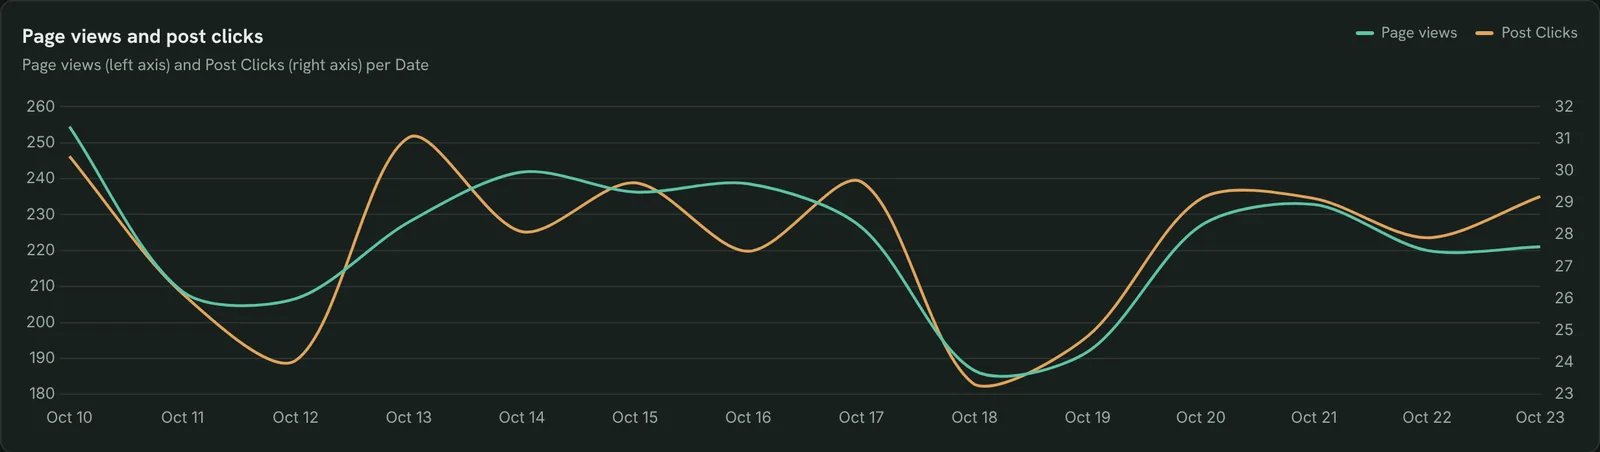
Track Page views and clicks
Page views and post clicks by day, so you see whether the Page sends people on to your site.
- Did clicks drop with reach?
- Which days had the most Page views?
Chart Page views and Post Clicks per day for the last 14 days.Also built for this: Google Analytics dashboard template
How to set up the Facebook Page dashboard in Claude
You need admin access to a Facebook Page, a free Porter account and a paid Claude plan. Setup takes about 10 minutes.
Connect Facebook Insights in Porter
Sign up free at Porter, pick Facebook Insights, sign in with Facebook, select your Pages and pick Claude as the destination. The Facebook Insights to Claude tutorial shows each click.
Add Porter to Claude
In Claude, go to Customize → Connectors → Add custom connector, paste https://mcp.portermetrics.com/mcp and name it Porter Metrics. Then sign in to Porter and allow access.
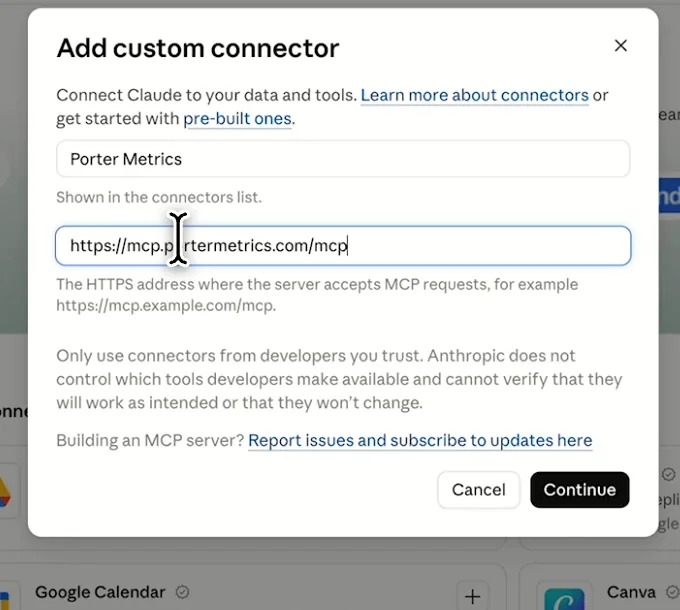
In Claude: Customize, Connectors, Add custom connector, then paste Porter’s MCP URL Paste the install prompt
Paste this prompt into a new chat and swap in your Page. The Free plan covers 14 days; the trial adds comparisons.
Install promptDuplicate this Claude dashboard template and keep its layout, views and styling: https://claude.ai/artifact/WXf9YD5GA2Q5CqzqUr5VUG Then rebuild it with my own data through Porter: a Facebook Page dashboard for [Page] for the last 14 days: KPI cards for Page total followers, Page new followers, Total reach, Page total impressions, Post engagement rate and Post Clicks; daily Total reach and Page new followers; Organic Impressions, Paid impressions and Viral Impressions; every post by Post message with Post type, Post Date, Total reach of posts, Post reactions, Post Comments Count, Post shares, Post Clicks and Post engagement rate; the same totals by Post type; video and reel posts with Page video views, Page video 30 sec views and Post average time video viewed; Post engagement rate by Hour of day; Page total followers by City and Country name; and daily Page views and Post Clicks. Open in Claude with this prompt

The first thing Claude builds: KPI cards for your own Page. Demo data shown.
How to connect Facebook Insights to Claude
Facebook Page fields and data
The template uses 25 of the 277 Facebook Insights fields Porter reads, such as Page unlikes or Reel views.
Top 5 Facebook Page KPIs to watch
Trailgear demo data · last 14 days vs the 14 before
- Total reach96.4K−5.3%
A drop with steady posting points to fewer shares or less paid support, not fewer posts.
- Organic Impressions173.3K−8.7%
Falling organic with rising paid means the Page leans on ads to be seen.
- Post engagement rate4.22%−0.1 pts
Compare it by post type before you change what you post.
- Page new followers280−9.7%
Fewer new followers on falling reach means fewer people find the Page at all.
- Post Clicks390−7.1%
Link posts should carry most clicks; if they don’t, test the post text.
How the numbers are calculated
- Post engagement rate
- Post engagements ÷ Total impressions of posts.
- Post engagements
- Reactions + comments + shares + clicks on your posts.
- Share watched 30 sec
- Page video 30 sec views ÷ Page video views.
- Page total impressions
- Organic Impressions + Paid impressions.
- Change
- (This period − previous) ÷ previous.
Data sources
Metrics
 Page total followers
- Page new followers
- Total reach
- Page total impressions
- Organic Impressions
- Paid impressions
- Viral Impressions
- Total reach of posts
- Post reactions
- Post Comments Count
- Post shares
- Post Clicks
- Post engagements
- Post engagement rate
- Page video views
- Page video 30 sec views
- Post average time video viewed
- Page views
Dimensions
- Date
- Post message
- Post type
- Post Date
- Hour of day
- City
- Country name
See all fields:Facebook Insights · 277 fields
What makes this Facebook Page dashboard different
Meta Business Suite shows each number on its own screen. This puts reach sources, posts and video on one link you can act on from the chat.
Ask why reach dropped in the same chat
Ask Claude which post or source caused it.
Reply to comments without opening Facebook
Claude drafts replies and posts them once you approve.
Put your Page next to your Meta ads
Add Meta Ads to see organic and paid results together.
See the visits your Page sends to your site
Add GA4 to see the sessions and sales it brings.
Send clients a report on your logo
Email it with your logo on a schedule.
Share it without Page access
Anyone with the link sees it, no admin role needed.
What the dashboard includes
- Six KPI cards
- Daily reach and new followers
- Organic, paid and viral impressions
- Every post ranked by engagement
- Results by post type
- Video views and watch time
- Engagement rate by hour posted
- Followers by city
- Share by link, PDF or email
Related dashboard templates
 Claude

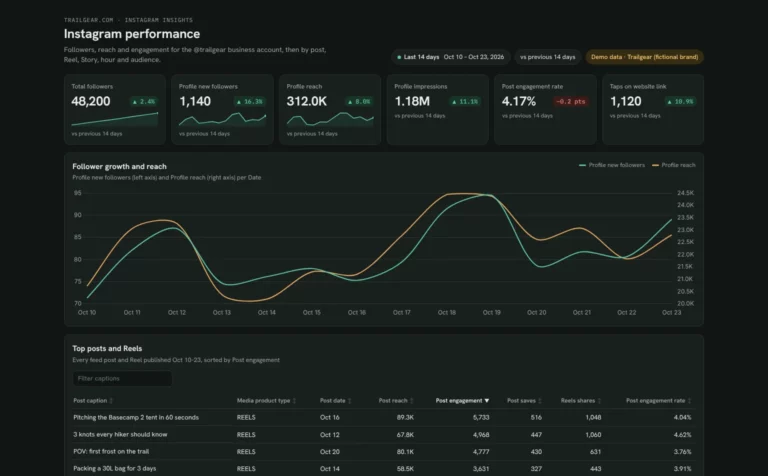
Instagram dashboard template
See which posts, Reels and Stories grow your account and when your followers are online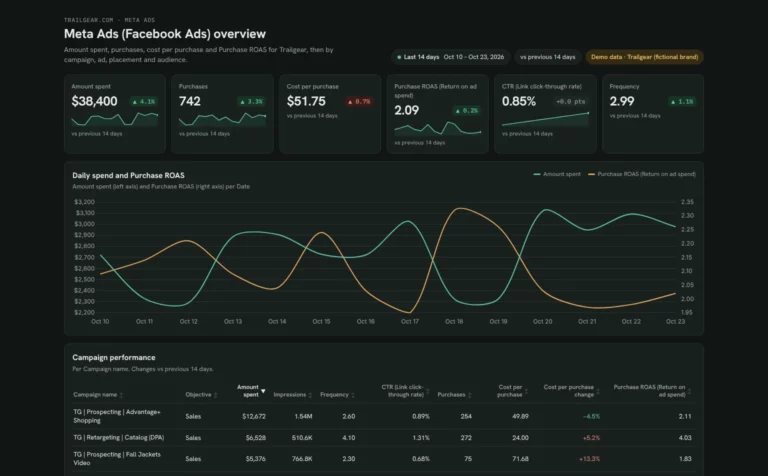 Claude

Meta Ads dashboard template
Track Meta Ads spend, ROAS and cost per purchase by campaign, ad and placement, and catch ad fatigue early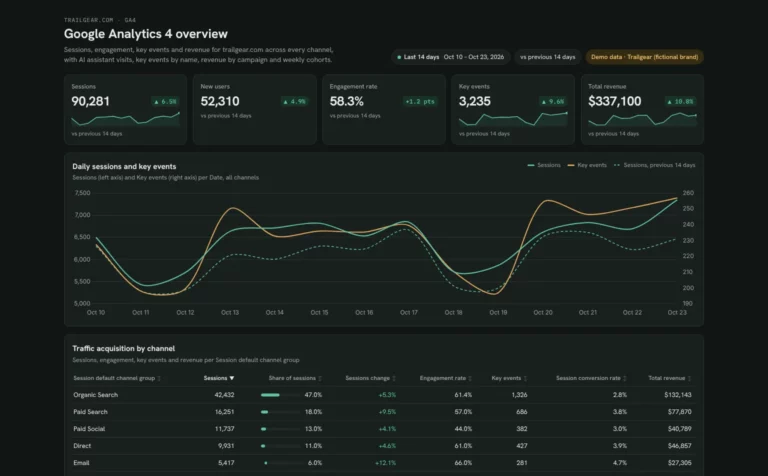 Claude

Google Analytics dashboard template
See which channels and AI assistants bring visitors, key events and revenue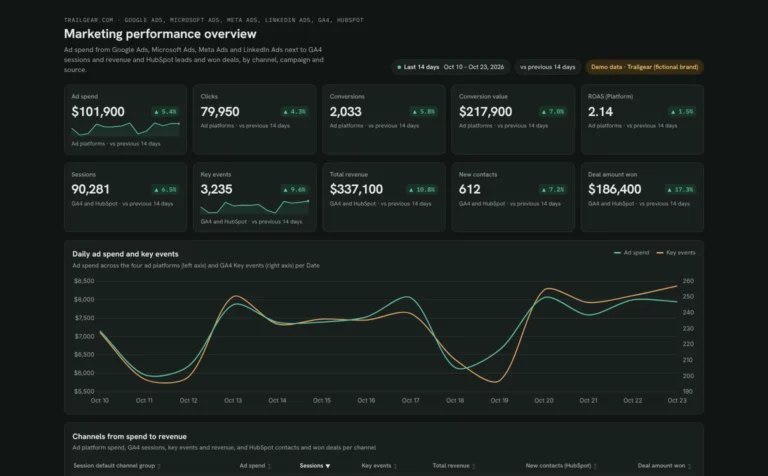 Claude


Marketing dashboard template
See which channels turn ad spend into leads, won deals and revenueBrowse more Claude dashboard templates
 Data Studio
 Google Sheets
 ChatGPT
Get your free Facebook Page dashboard
Connect your Page and paste the prompt. Your posts and videos fill the same layout.
Free plan · 14-day trial · No card needed