





Trusted by 1,600+ marketing teams and agencies


What you can do with this TikTok dashboard
Click a job to see it on demo data, then paste its prompt into Claude.
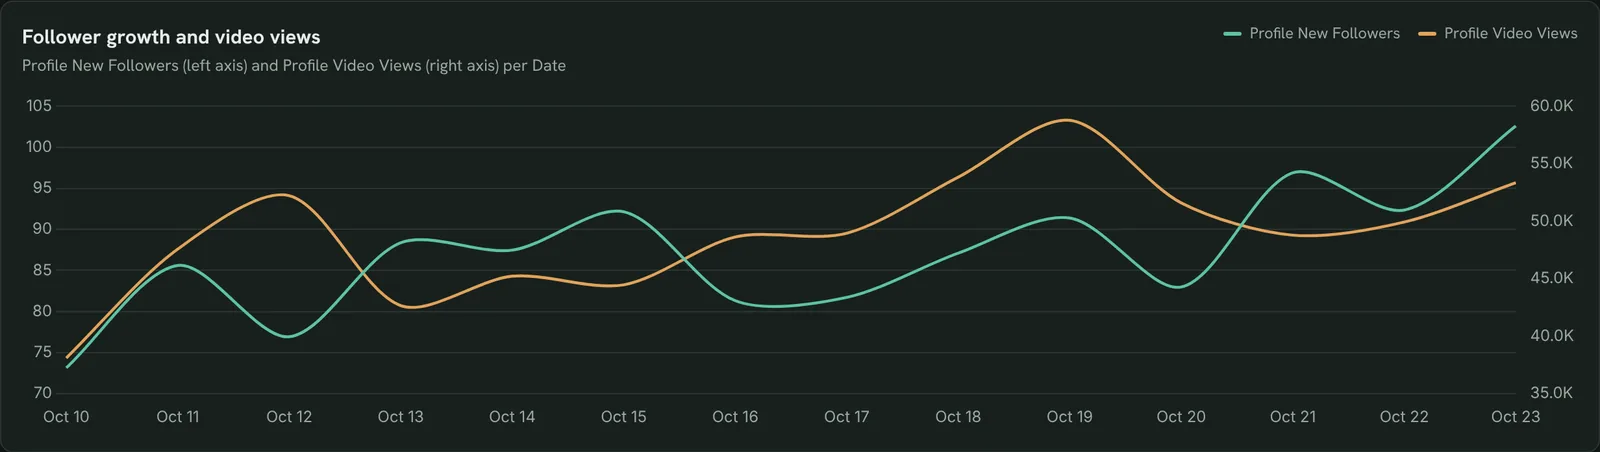
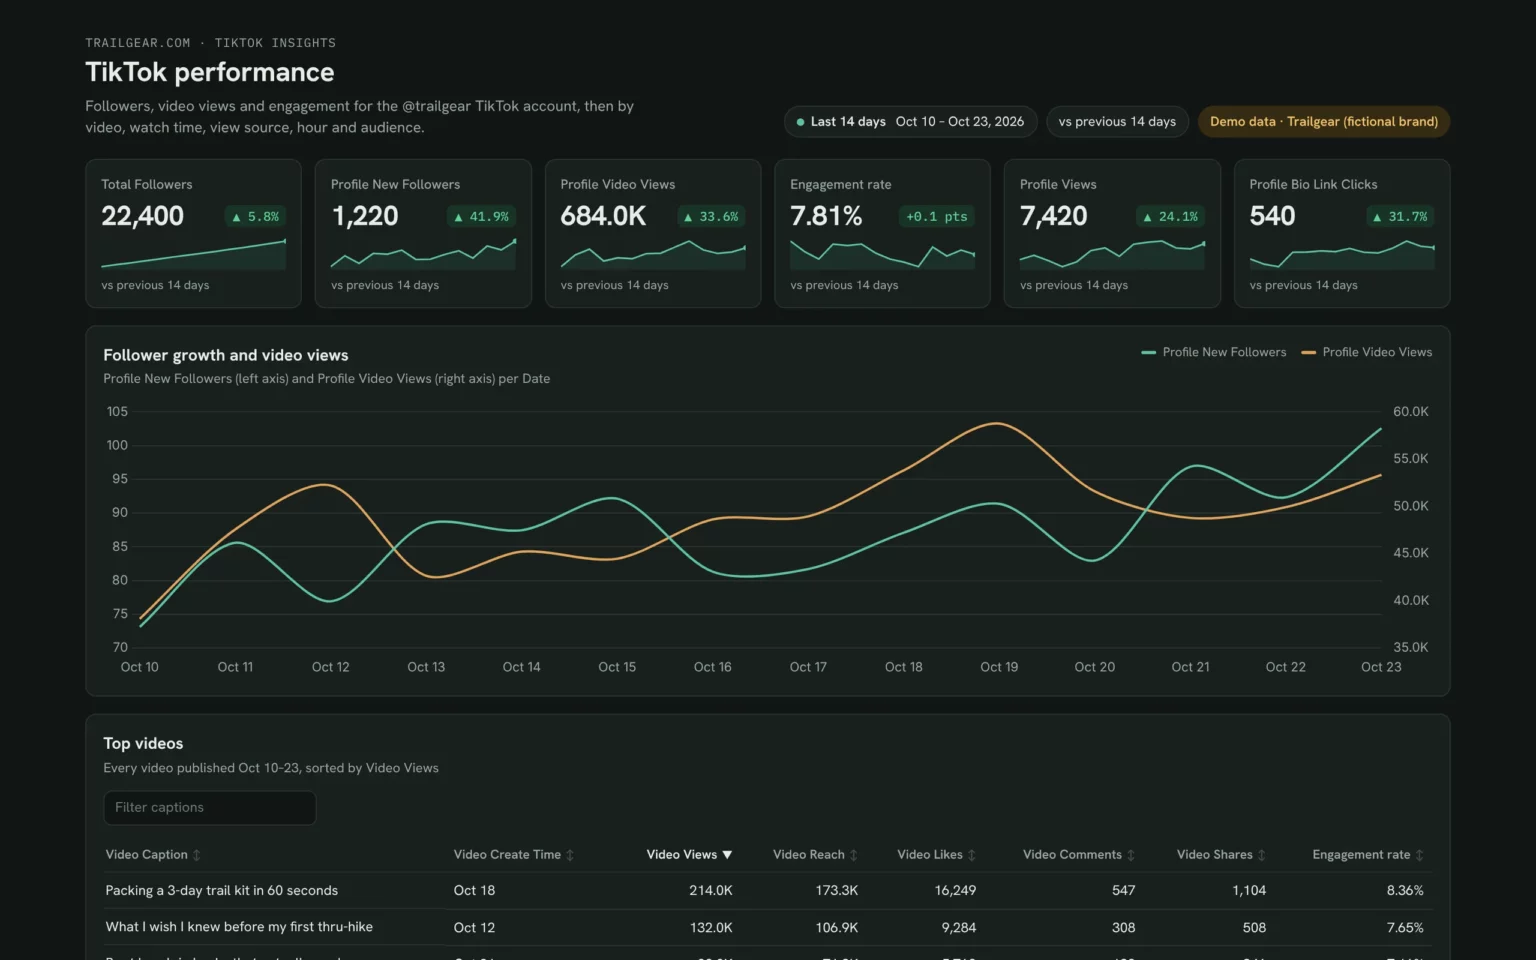
Track follower growth and views
New followers and video views by day, so you see which days and videos brought people in.
- Did one video bring a jump in followers?
- Are views growing week over week?
Chart Profile New Followers and Profile Video Views per day for the last 14 days.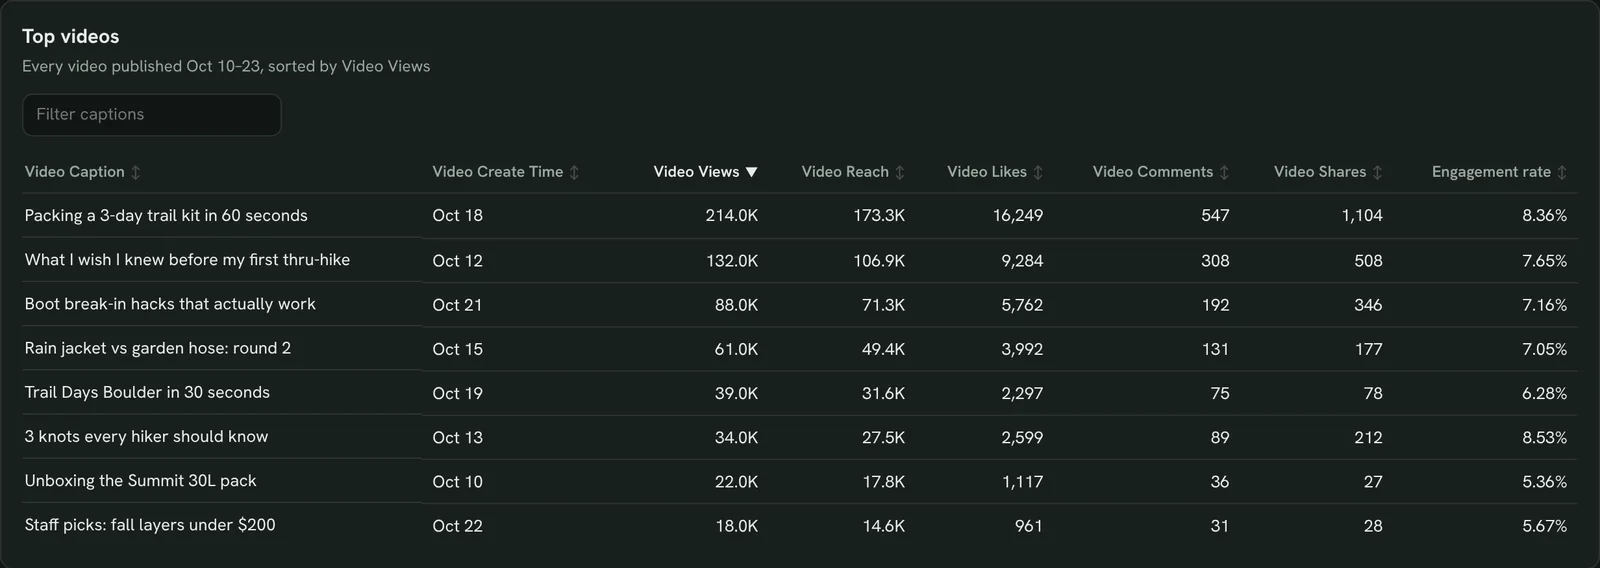
Find the videos that work
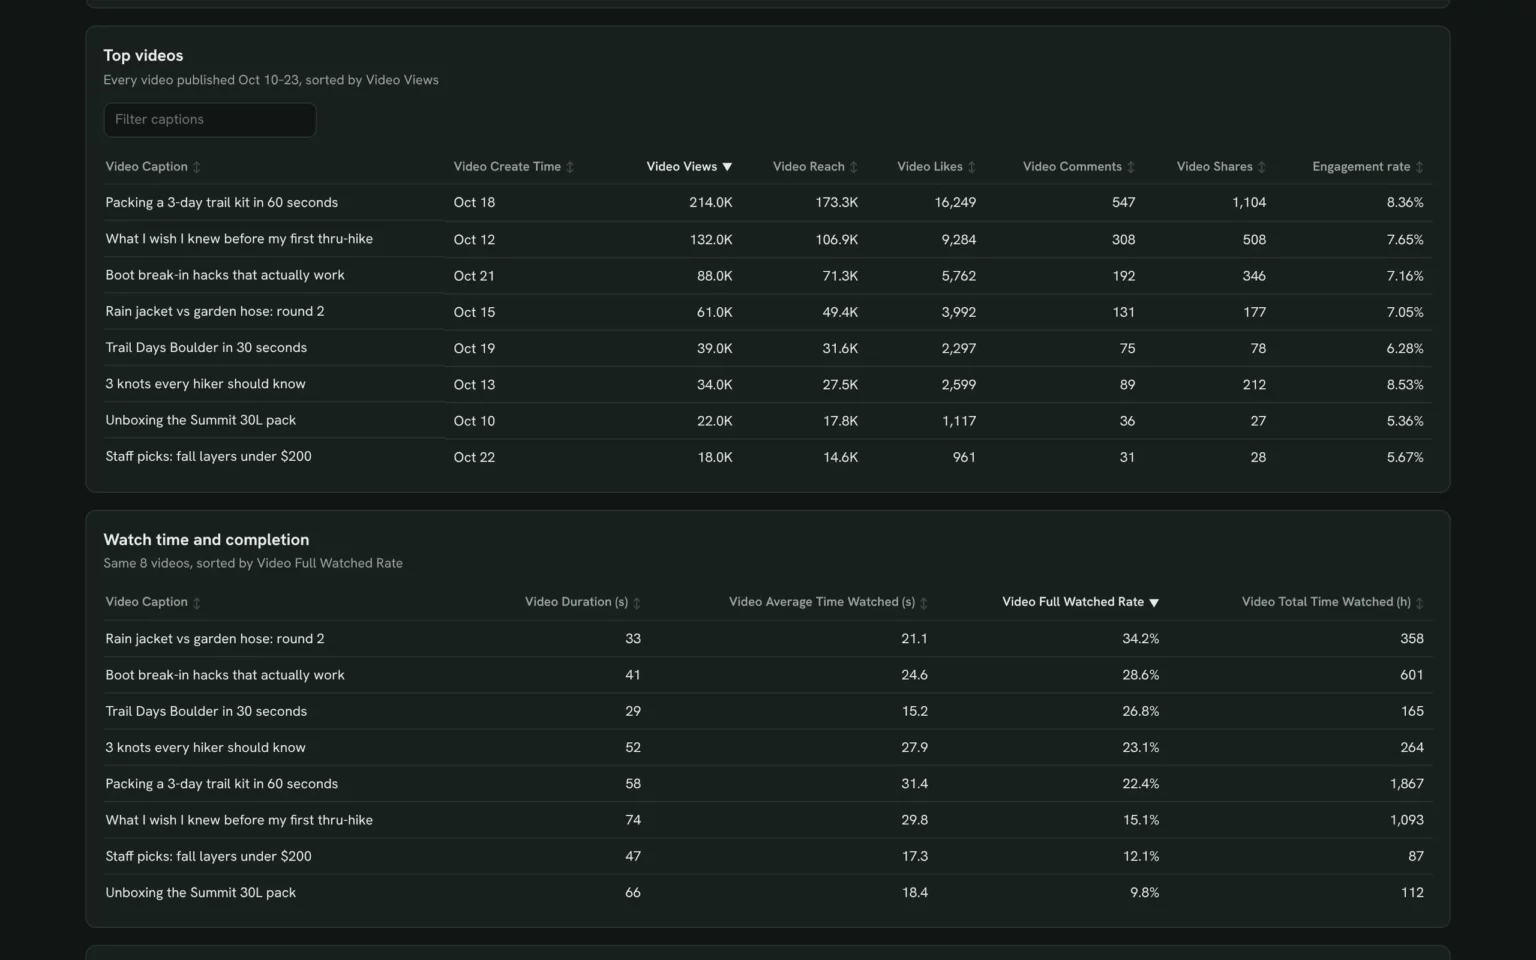
Every video ranked by views with likes, comments and shares, so you know what to make again.
- Which videos get shared the most?
- Which ones beat my average engagement rate?
List my TikTok videos from the last 14 days with Video Views, Video Reach, Video Likes, Video Comments and Video Shares, sorted by Video Views.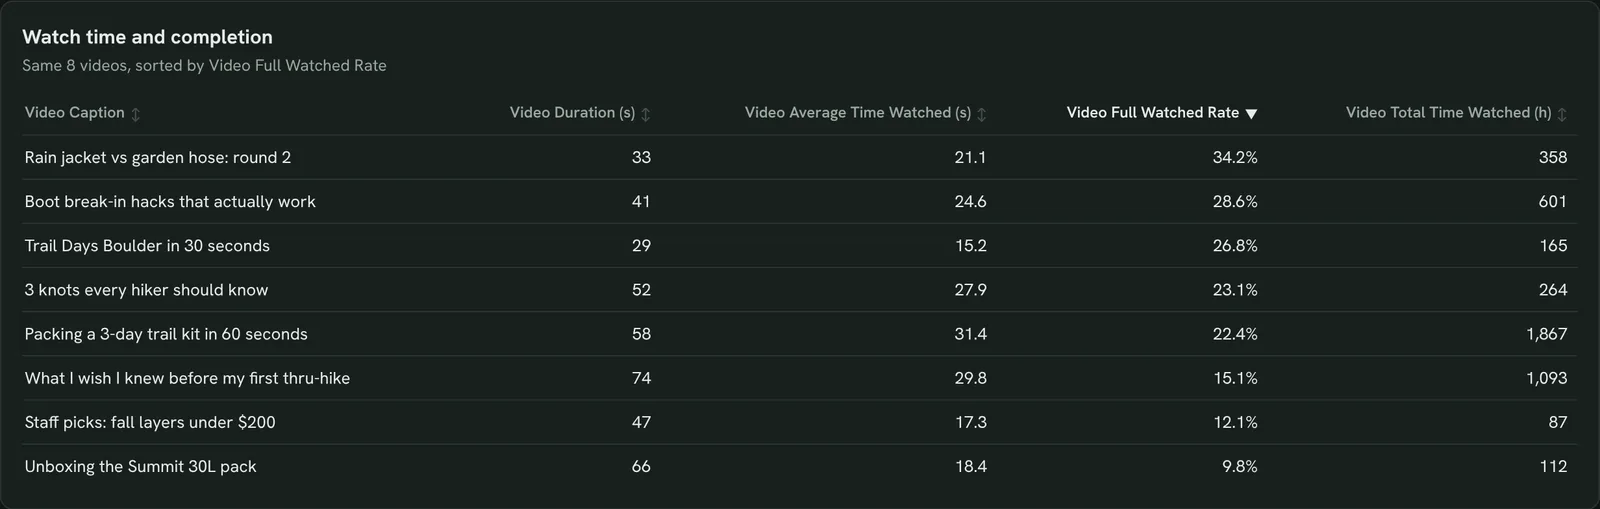
See which videos people finish
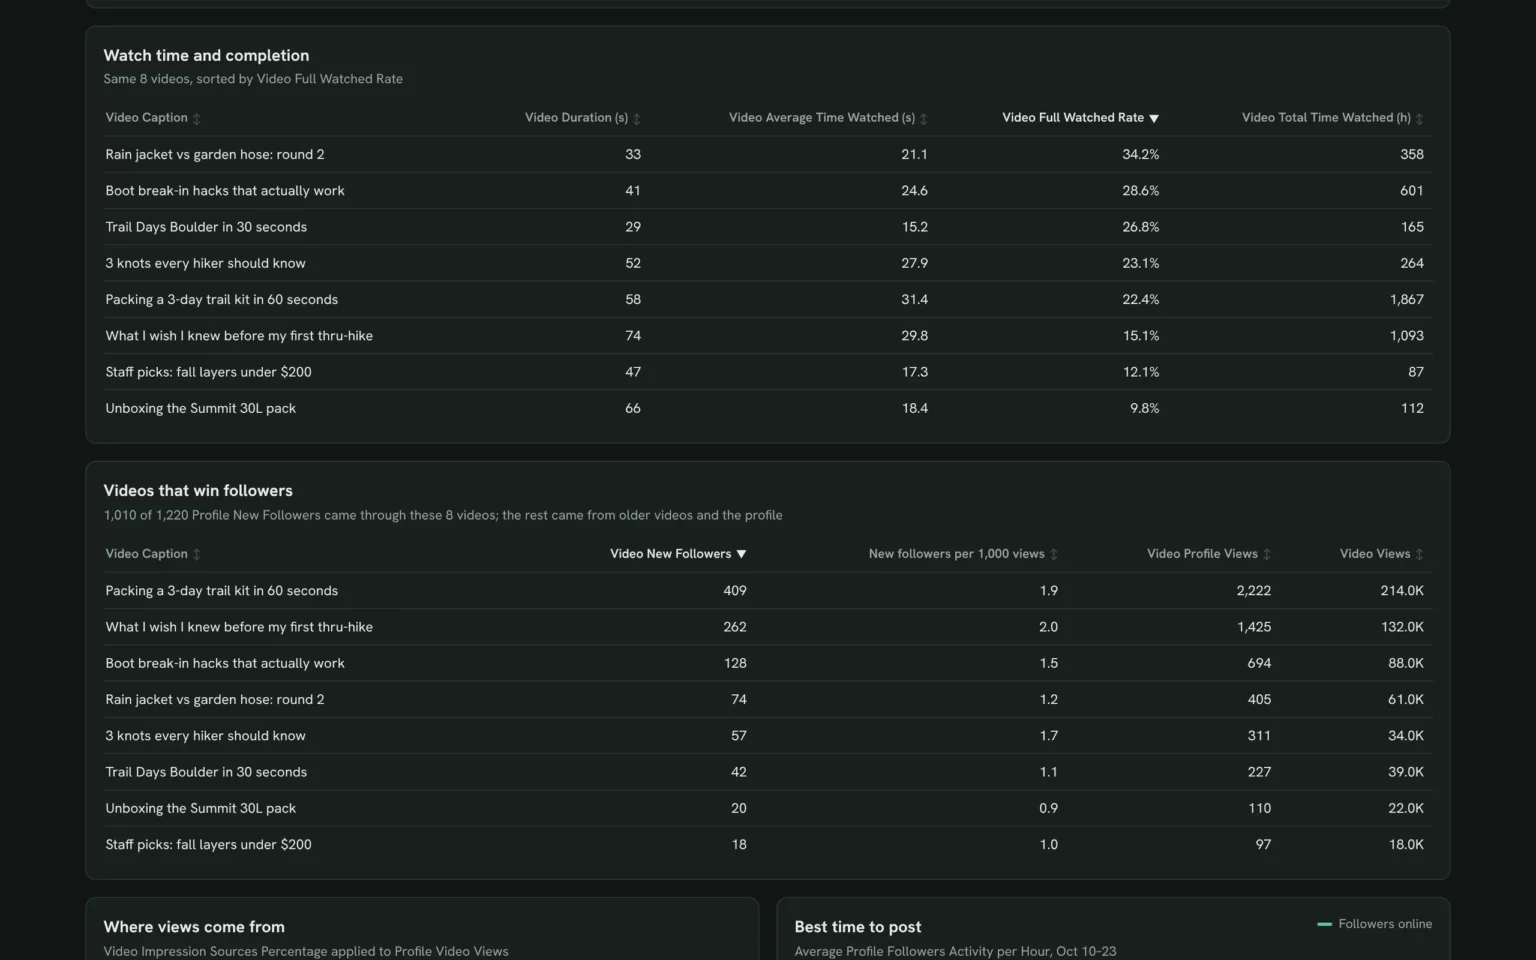
Average time watched and full-watch rate per video, so you learn which hooks and lengths hold people.
- Which videos do people watch to the end?
- Do shorter videos hold viewers better?
Show Video Duration, Video Average Time Watched and Video Full Watched Rate for each video from the last 14 days, sorted by Video Full Watched Rate.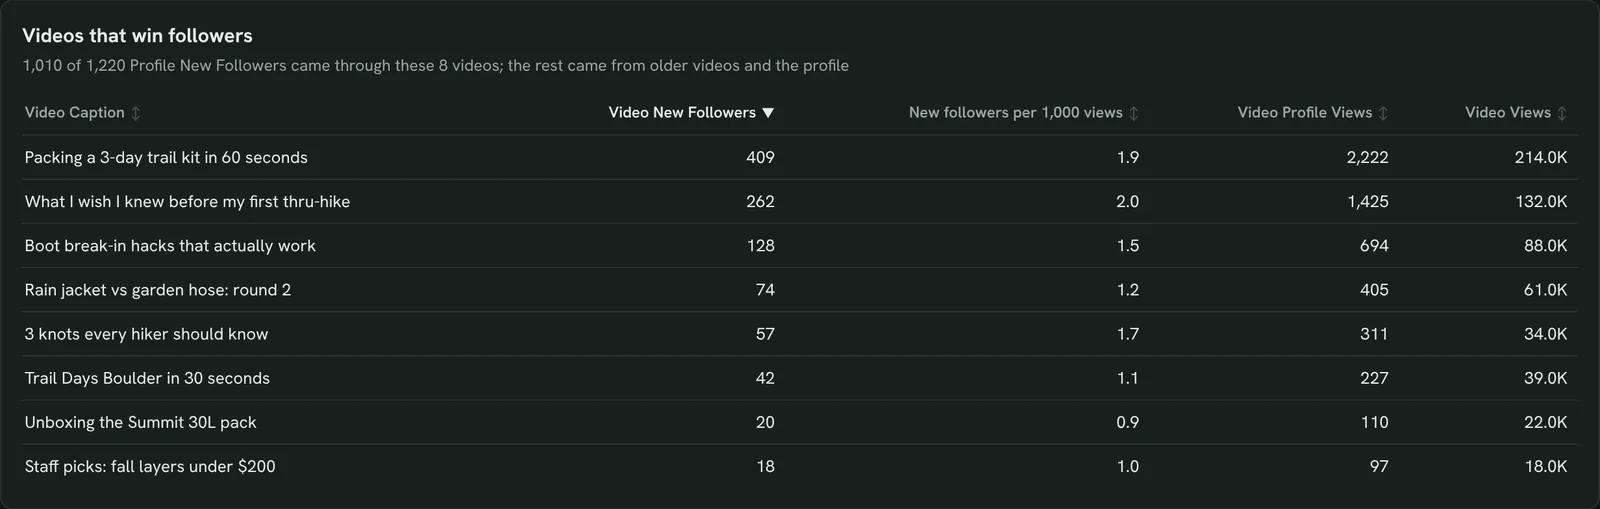
See which videos win followers
New followers and profile views per video, so you can tell videos that grow the account from ones that only get views.
- Which video won the most followers per 1,000 views?
- Do my most viewed videos also win followers?
List Video New Followers, Video Profile Views and Video Views for each video from the last 14 days, sorted by Video New Followers.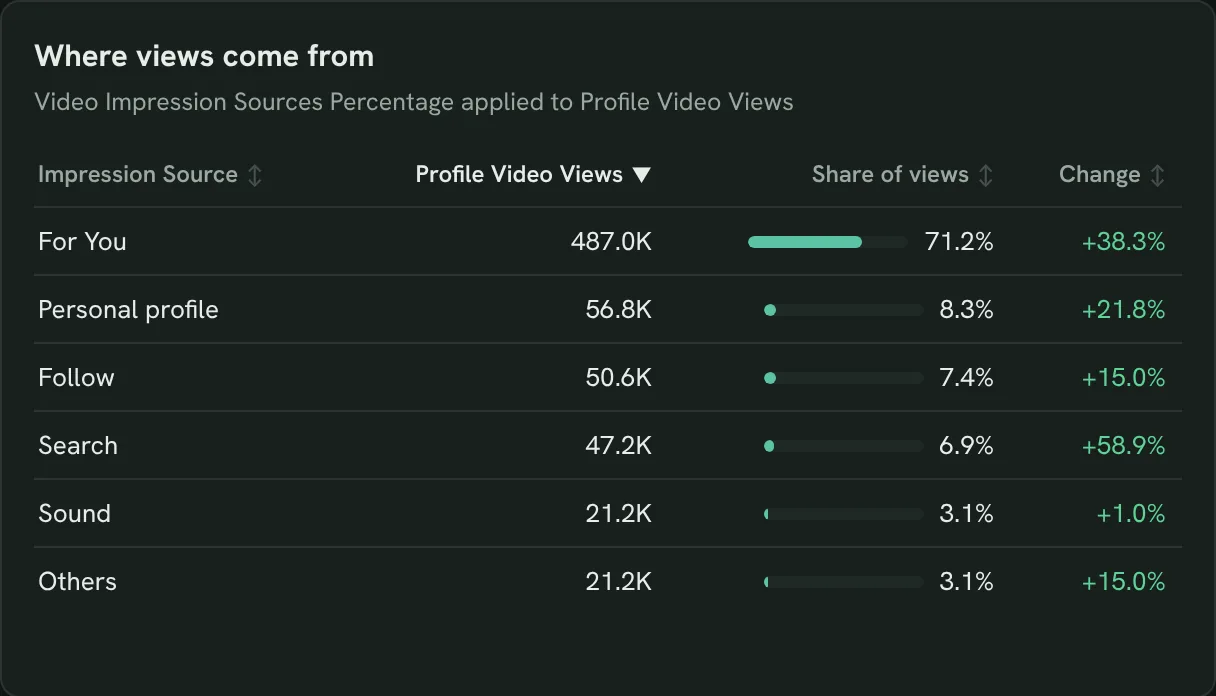
Find where your views come from
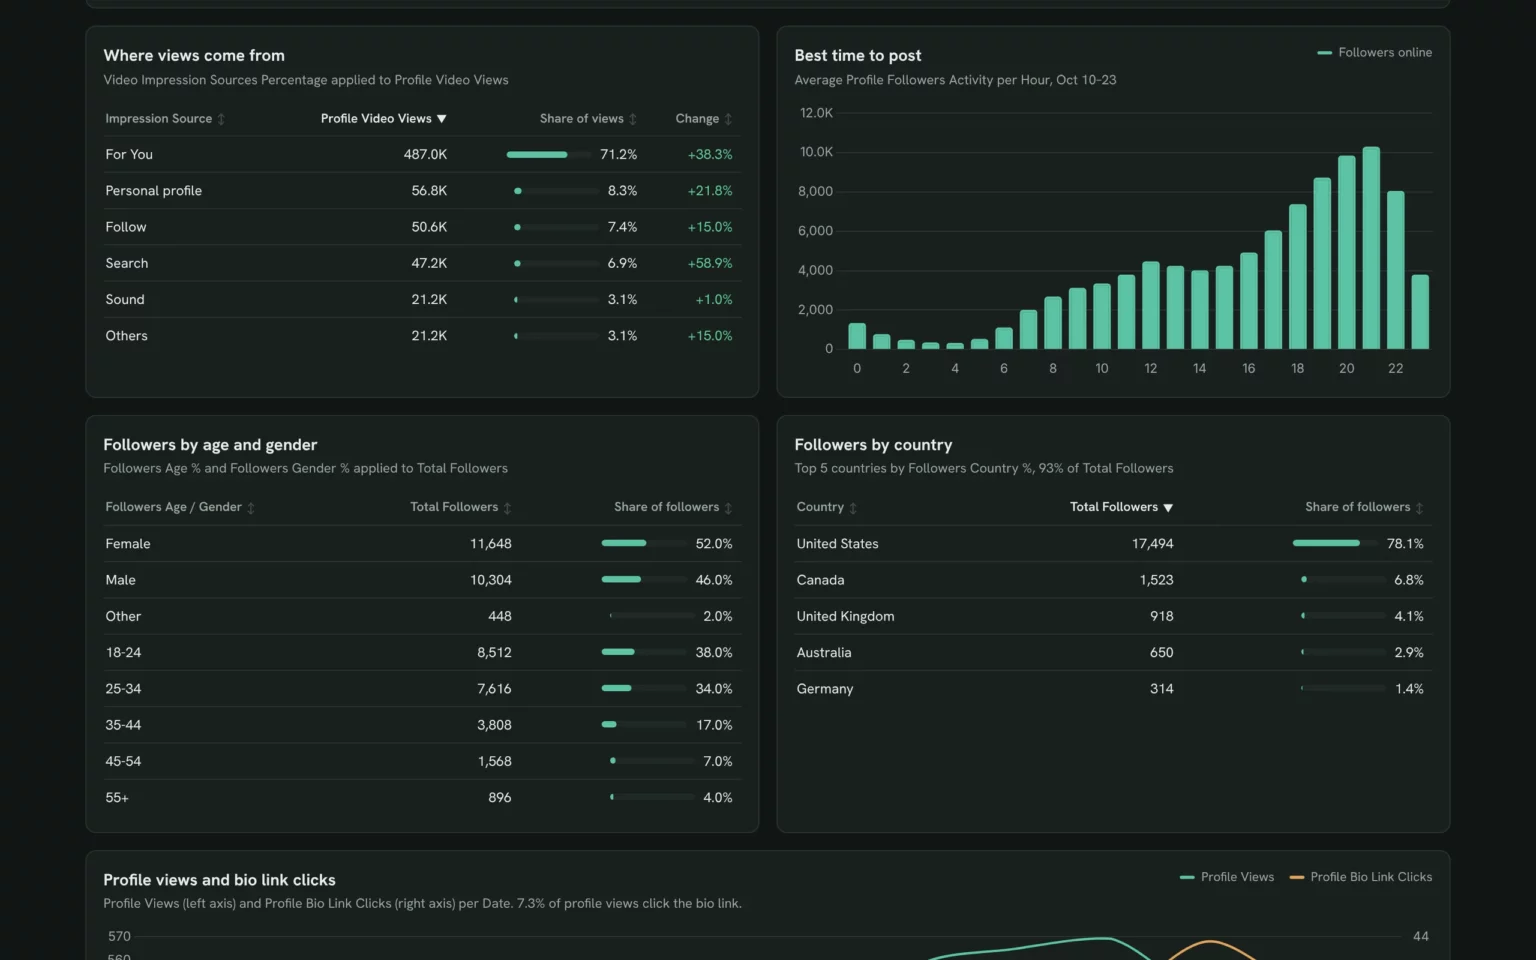
Views split by For You, Search, your profile and the Following feed, so you know whether new people or fans are watching.
- How much comes from the For You feed?
- Is Search growing as a source?
Show Video Impression Sources Percentage by Impression Source for my videos from the last 14 days.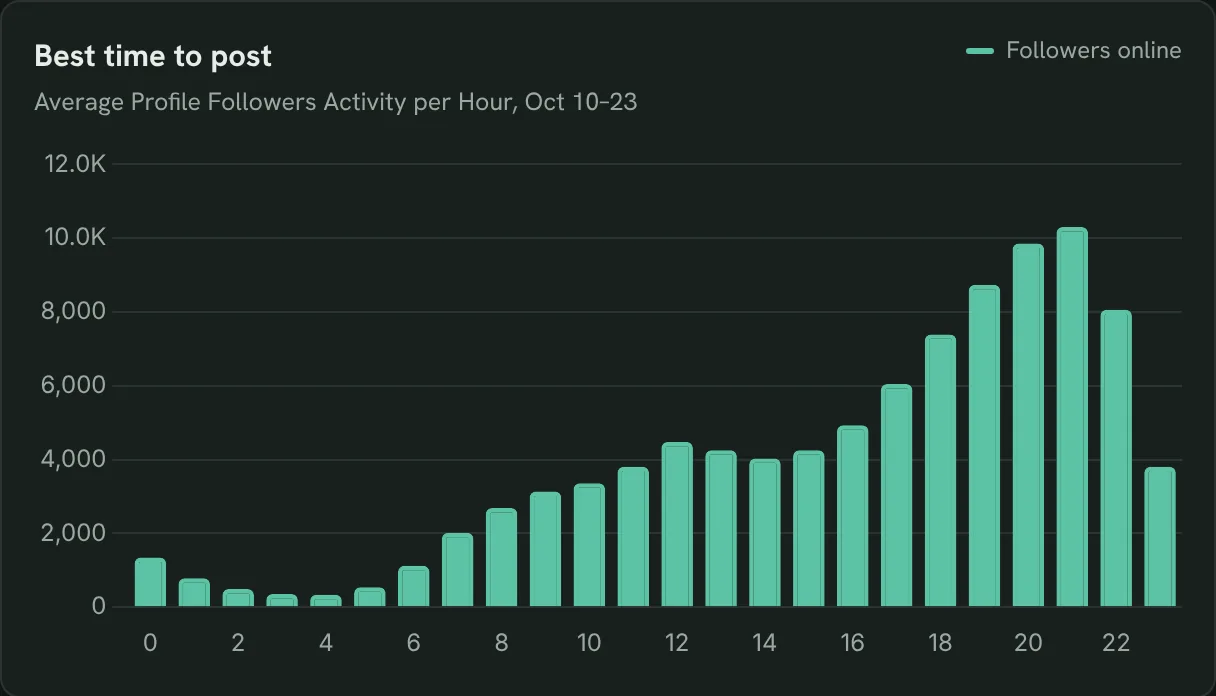
Find your best time to post
When your followers are online by hour, so you post when they scroll.
- Which hour has the most followers online?
- Is my usual posting time a good one?
Chart average Profile Followers Activity by Hour for the last 14 days.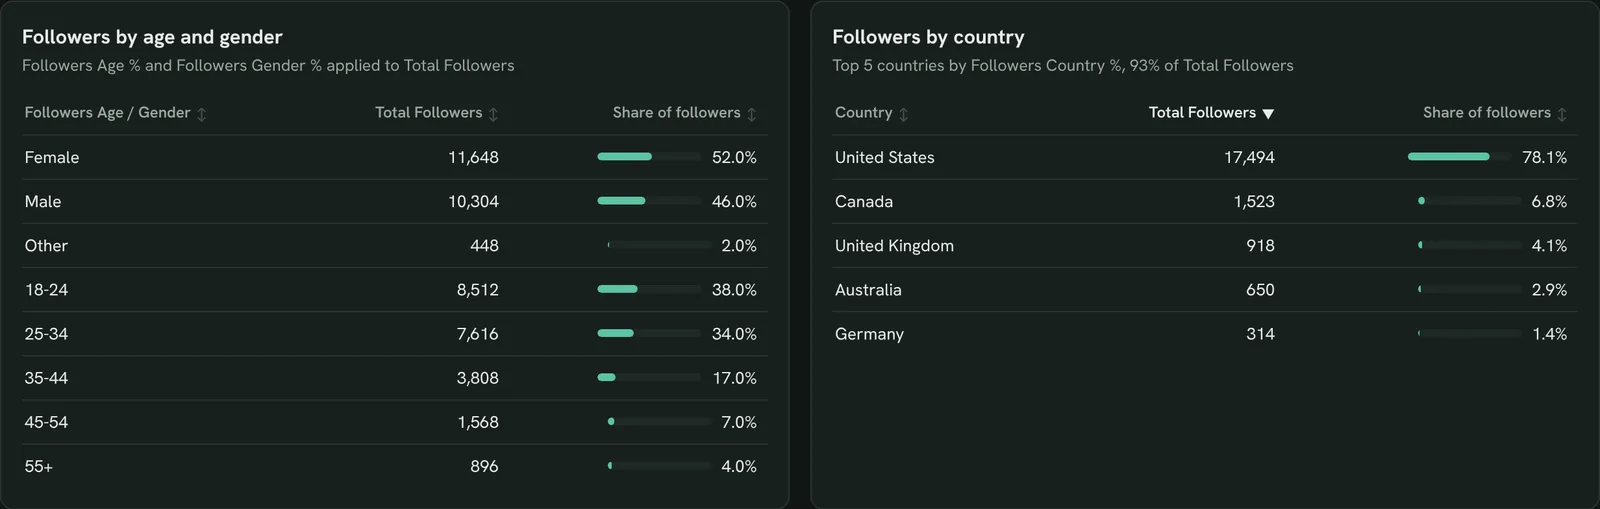
Know who follows you
Followers by age, gender and country, so your videos and offers fit the people you reach.
- Which age group is the largest?
- Which countries should a promo cover?
Show Followers Age %, Followers Gender % and Followers Country % for my account.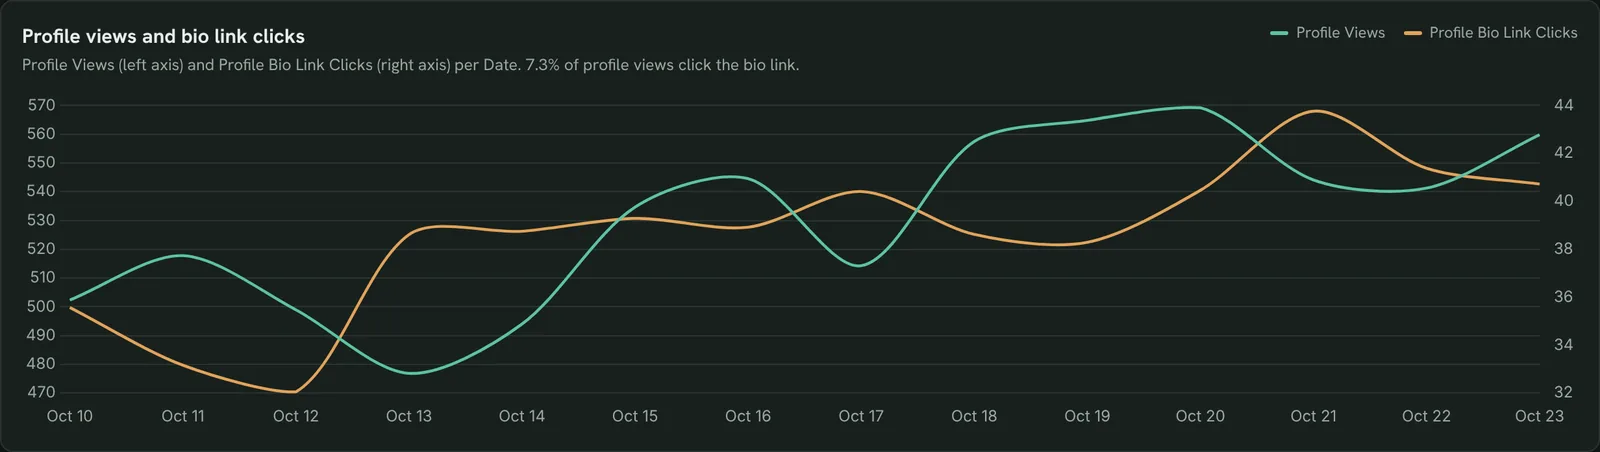
Turn profile views into site visits
Profile views next to bio link clicks, so you see whether your bio earns the click.
- What share of profile visitors click the link?
- Did a bio change move clicks?
Chart Profile Views and Profile Bio Link Clicks per day for the last 14 days.Also built for this: Google Analytics dashboard template
How to set up the TikTok dashboard in Claude
You need a TikTok account with Analytics on, a free Porter account and a paid Claude plan. Setup takes about 10 minutes.
Connect TikTok in Porter
Sign up free at Porter, choose Claude, pick TikTok Insights and sign in with your TikTok account. The TikTok to Claude tutorial shows each click.
Add Porter to Claude
In Claude, go to Customize → Connectors → Add custom connector, paste https://mcp.portermetrics.com/mcp and name it Porter Metrics. Then sign in to Porter and allow access.
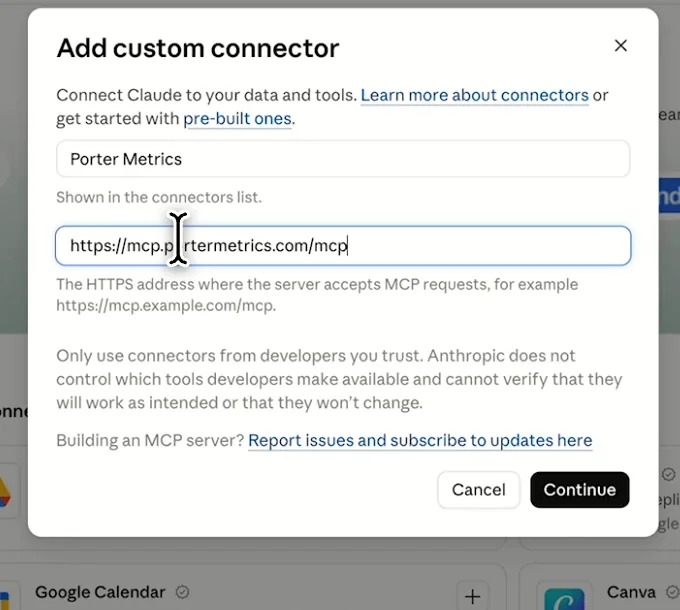
In Claude: Customize, Connectors, Add custom connector, then paste Porter’s MCP URL Paste the install prompt
Paste this prompt into a new chat and swap in your account. The Free plan covers 14 days; the trial adds period comparisons.
Install promptDuplicate this Claude dashboard template and keep its layout, views and styling: https://claude.ai/artifact/SMKA8vHJyFYg28zF7EBJu7 Then rebuild it with my own data through Porter: a TikTok dashboard for [account] for the last 14 days: KPI cards for Total Followers, Profile New Followers, Profile Video Views, engagement rate ((Profile Likes + Profile Comments + Profile Shares) ÷ Profile Video Views), Profile Views and Profile Bio Link Clicks; daily Profile New Followers and Profile Video Views; every video by Video Caption with Video Create Time, Video Views, Video Reach, Video Likes, Video Comments and Video Shares; Video Duration, Video Average Time Watched, Video Full Watched Rate and Video Total Time Watched per video; Video New Followers and Video Profile Views per video; Video Impression Sources Percentage by Impression Source; Profile Followers Activity by Hour; Followers Age %, Followers Gender % and Followers Country %; and daily Profile Views and Profile Bio Link Clicks. Open in Claude with this prompt

The first thing Claude builds: KPI cards for your own account. Demo data shown.
How to connect TikTok to Claude
TikTok fields and data
The template uses 29 of the 88 TikTok fields Porter reads, such as Video Favorites or Profile Lead Submissions.
Top 5 TikTok KPIs to watch
Trailgear demo data · last 14 days vs the 14 before
- Profile New Followers1,220+41.9%
A spike the day after a post tells you which video wins followers.
- Profile Video Views684.0K+33.6%
Views rising faster than followers means For You is showing you to new people.
- Video Full Watched Rate22.5%best video 34.2%
Low rates on longer videos point to length; test a shorter cut of the same idea.
- Video New Followers1,0101.7 per 1,000 views
Views with few new followers means the video entertained but didn’t sell the account.
- Profile Bio Link Clicks540+31.7%
Flat clicks on rising profile views points to the bio link, not the videos.
How the numbers are calculated
- Engagement rate
- (Profile Likes + Profile Comments + Profile Shares) ÷ Profile Video Views.
- Full-watch rate (all videos)
- Video Full Watched Rate weighted by Video Views.
- New followers per 1,000 views
- Video New Followers ÷ Video Views × 1,000.
- Bio link click rate
- Profile Bio Link Clicks ÷ Profile Views.
- Change
- (This period − previous) ÷ previous.
Data sources
Metrics
 Total Followers
- Profile New Followers
- Profile Video Views
- Profile Likes
- Profile Comments
- Profile Shares
- Profile Views
- Profile Bio Link Clicks
- Video Views
- Video Reach
- Video Likes
- Video Comments
- Video Shares
- Video Average Time Watched
- Video Full Watched Rate
- Video Total Time Watched
- Video New Followers
- Video Profile Views
- Video Impression Sources Percentage
- Profile Followers Activity
- Followers Age %
- Followers Gender %
- Followers Country %
Dimensions
- Date
- Video Caption
- Video Create Time
- Video Duration
- Impression Source
- Hour
See all fields:TikTok Organic · 88 fields
What makes this TikTok dashboard different
TikTok Studio shows your videos one at a time inside the app. This puts every video, follower and view source on one link you can act on from the chat.
Ask why views dropped in the same chat
Ask Claude which video or view source caused it.
Reply to comments without opening the app
Claude drafts replies and posts them once you approve.
Post to TikTok from the chat
Claude publishes a post or saves a draft once you approve.
See the visits TikTok sends to your site
Add GA4 to see the sessions and sales it brings.
Send clients a report on your logo
Email it with your logo on a schedule.
Share it without TikTok access
Anyone with the link sees it, no login needed.
What the dashboard includes
- Six KPI cards
- Daily new followers and video views
- Every video ranked by views
- Watch time and full-watch rate per video
- New followers per video
- Views by source
- Followers online by hour
- Followers by age, gender and country
- Share by link, PDF or email
Related dashboard templates
 Claude

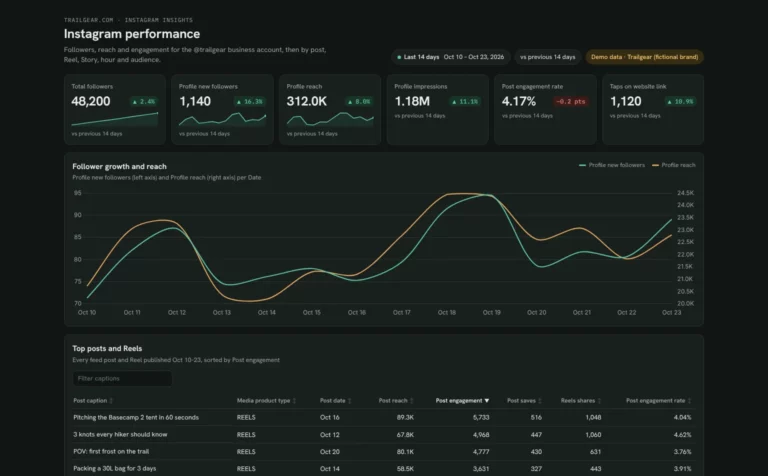
Instagram dashboard template
See which posts, Reels and Stories grow your account and when your followers are online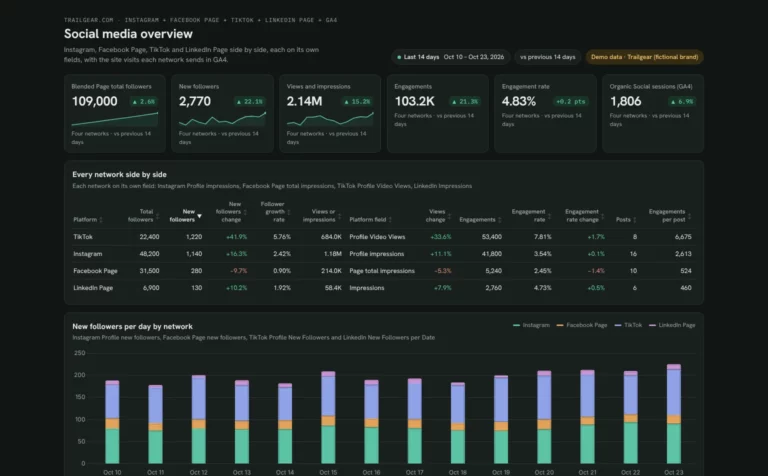 Claude


Social media dashboard template
Compare Instagram, Facebook, TikTok and LinkedIn growth, engagement and top posts, and see which network sends site visits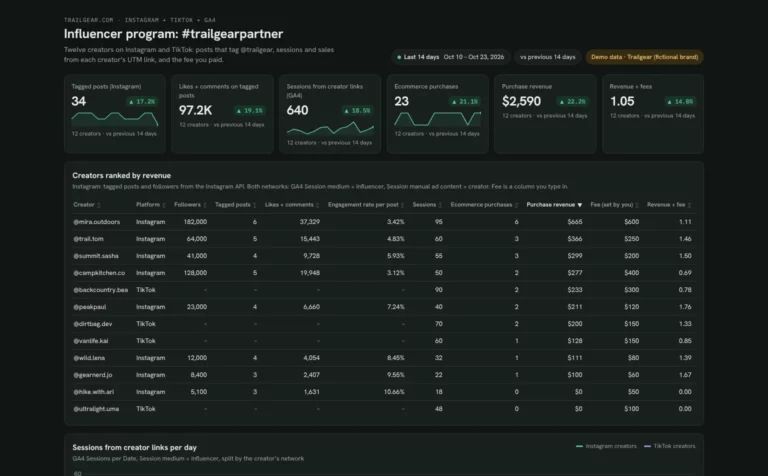 Claude
Influencer dashboard template
See which creators bring sessions and sales, which tagged posts land and what each creator returns on their fee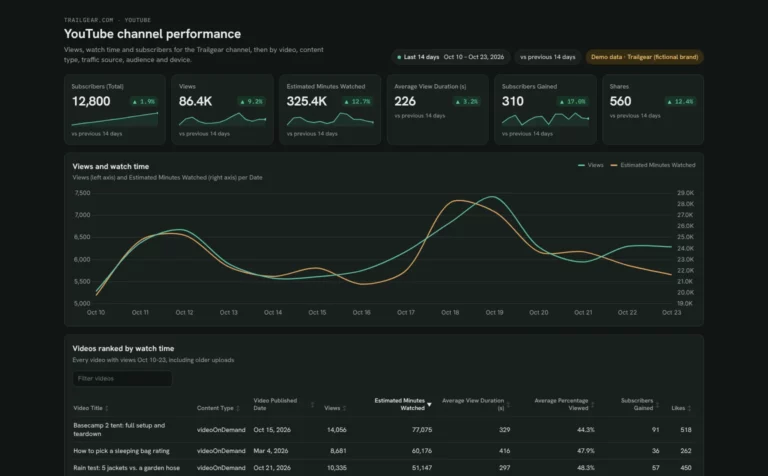 Claude

YouTube dashboard template
See which videos keep people watching, where viewers find you and how Shorts compare to long videosBrowse more Claude dashboard templates
Get the TikTok template in other tools
 Data Studio
 ChatGPT
Get your free TikTok dashboard
Connect your TikTok account and paste the prompt. Your videos, followers and views fill the same layout.
Free plan · 14-day trial · No card needed