





Trusted by 1,600+ marketing teams and agencies


What you can do with this ROAS dashboard
Six jobs this dashboard does. Click one to see its view on demo data, then paste its prompt into the same Claude chat.

Compare platform ROAS with GA4 revenue
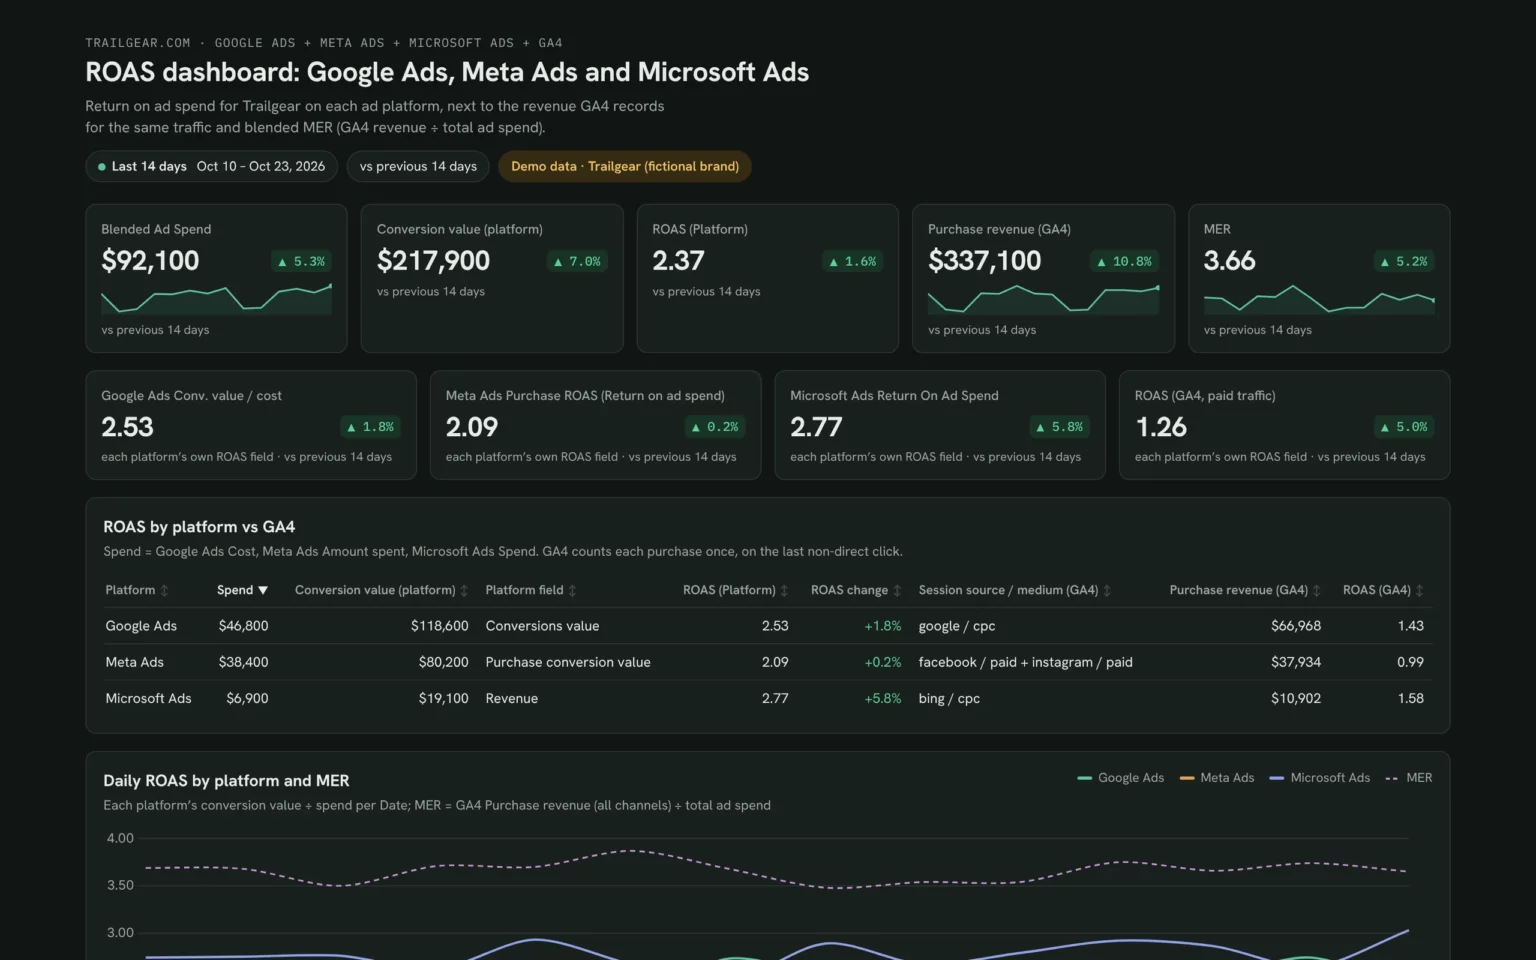
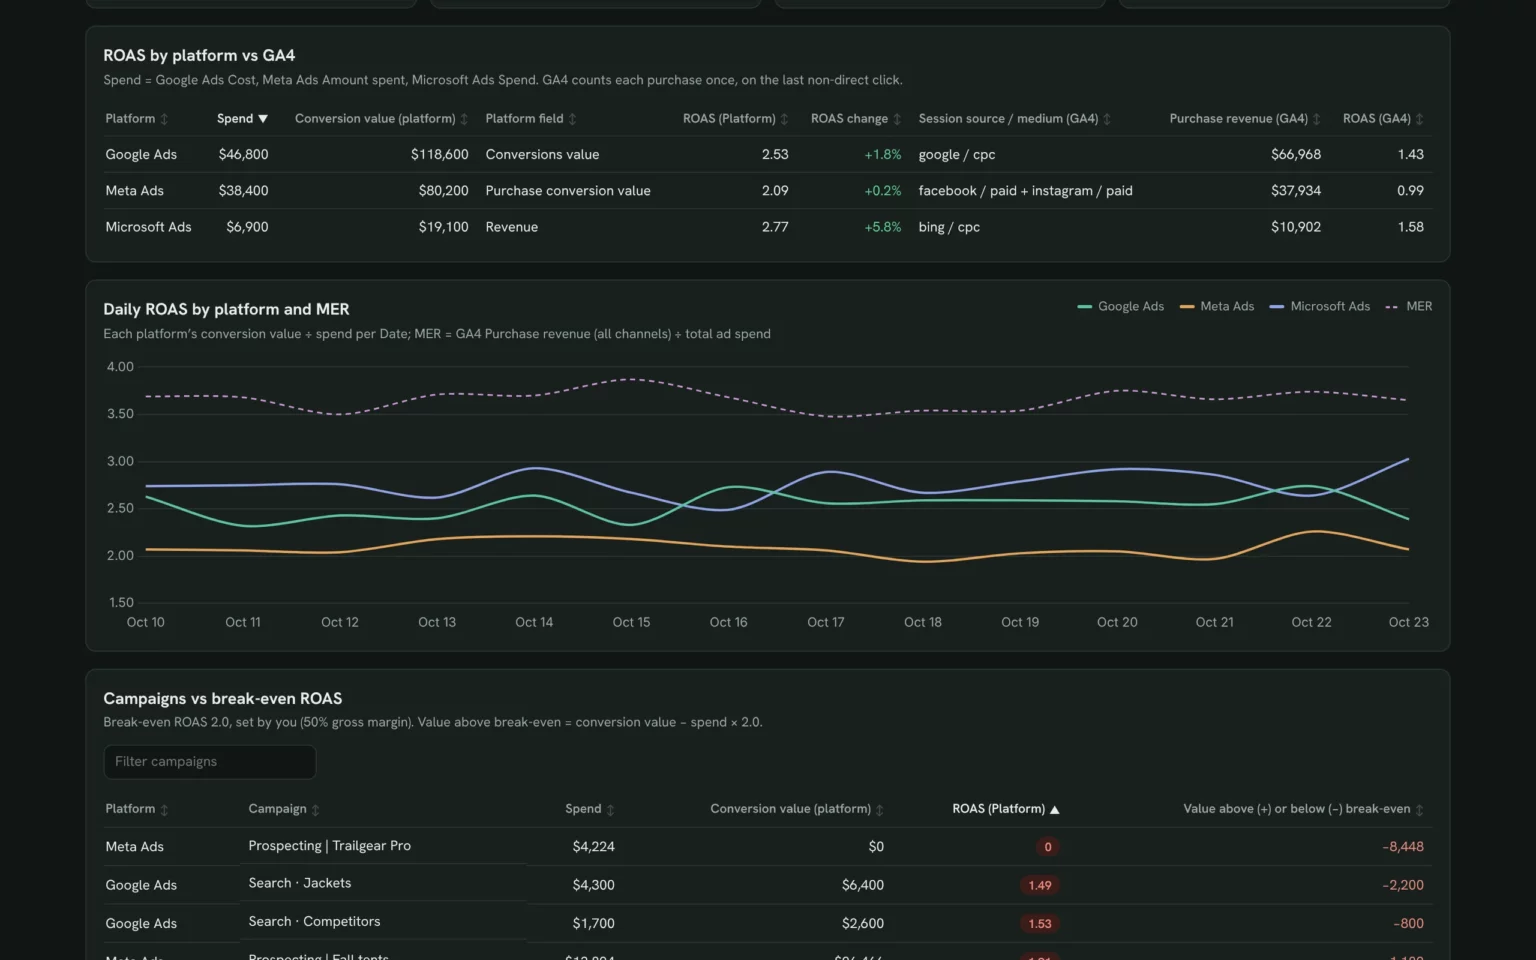
Each platform’s own ROAS next to the revenue GA4 records for its traffic, so you see which platform over-claims.
- Which platform reports the highest ROAS?
- How far is it from what GA4 records?
Show spend, conversion value and ROAS per ad platform for the last 14 days, next to GA4 Purchase revenue by Session source / medium.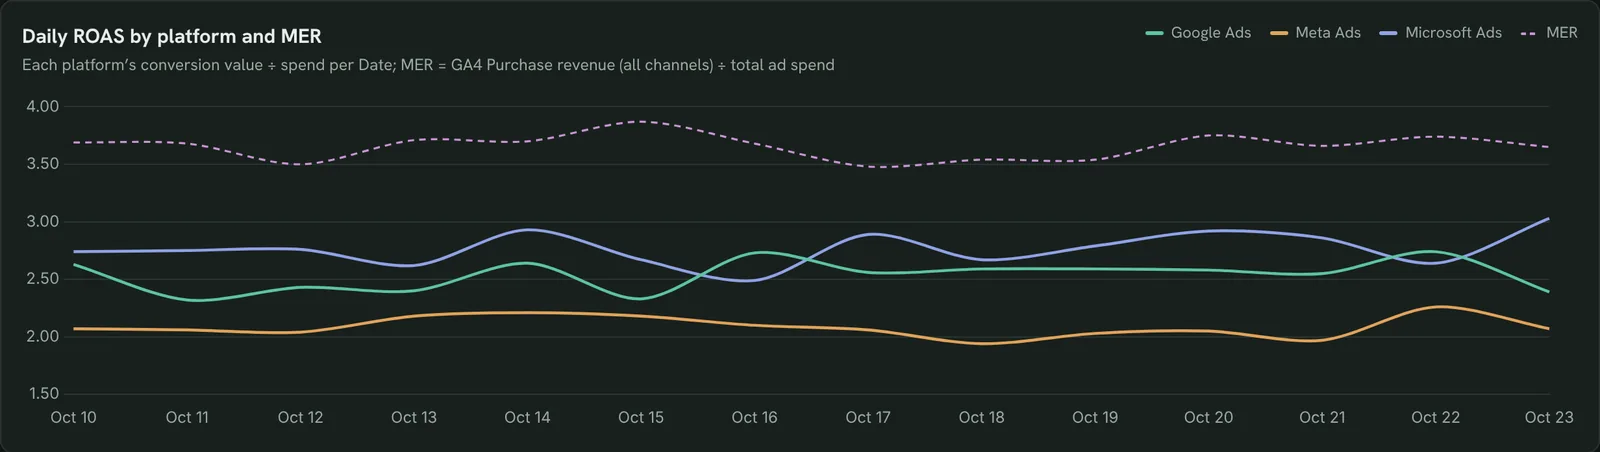
Track MER, not just ROAS
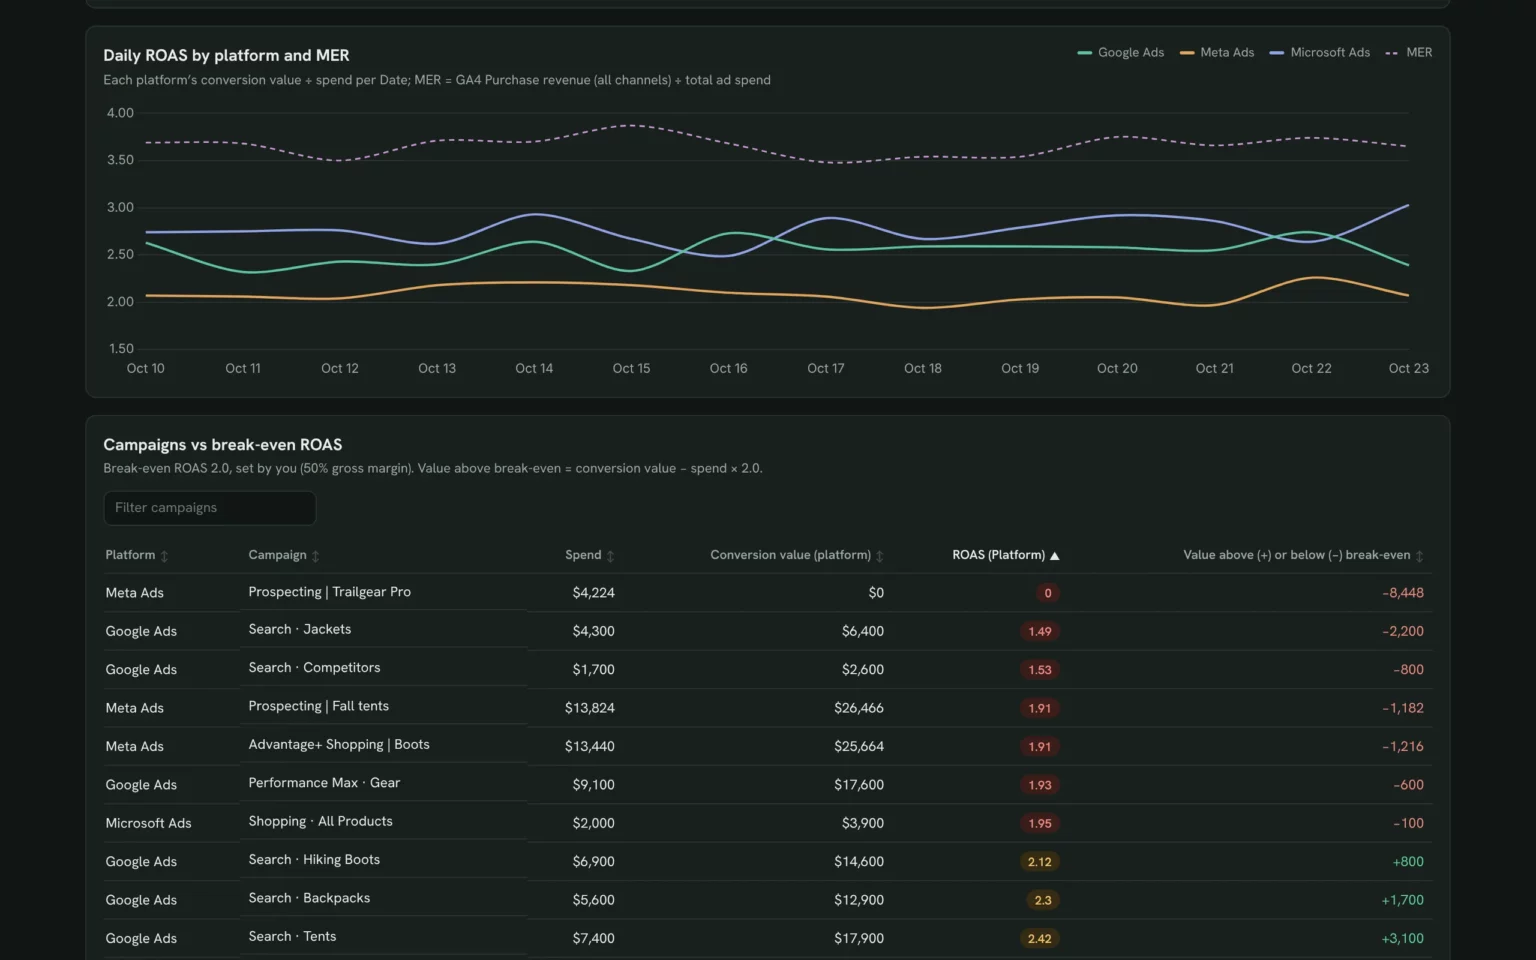
Daily ROAS per platform with blended MER on top, so a dip shows up the day it starts.
- Which platform’s ROAS fell this week?
- Did MER move with it?
Chart daily ROAS per ad platform and MER (GA4 Purchase revenue ÷ total ad spend) for the last 14 days.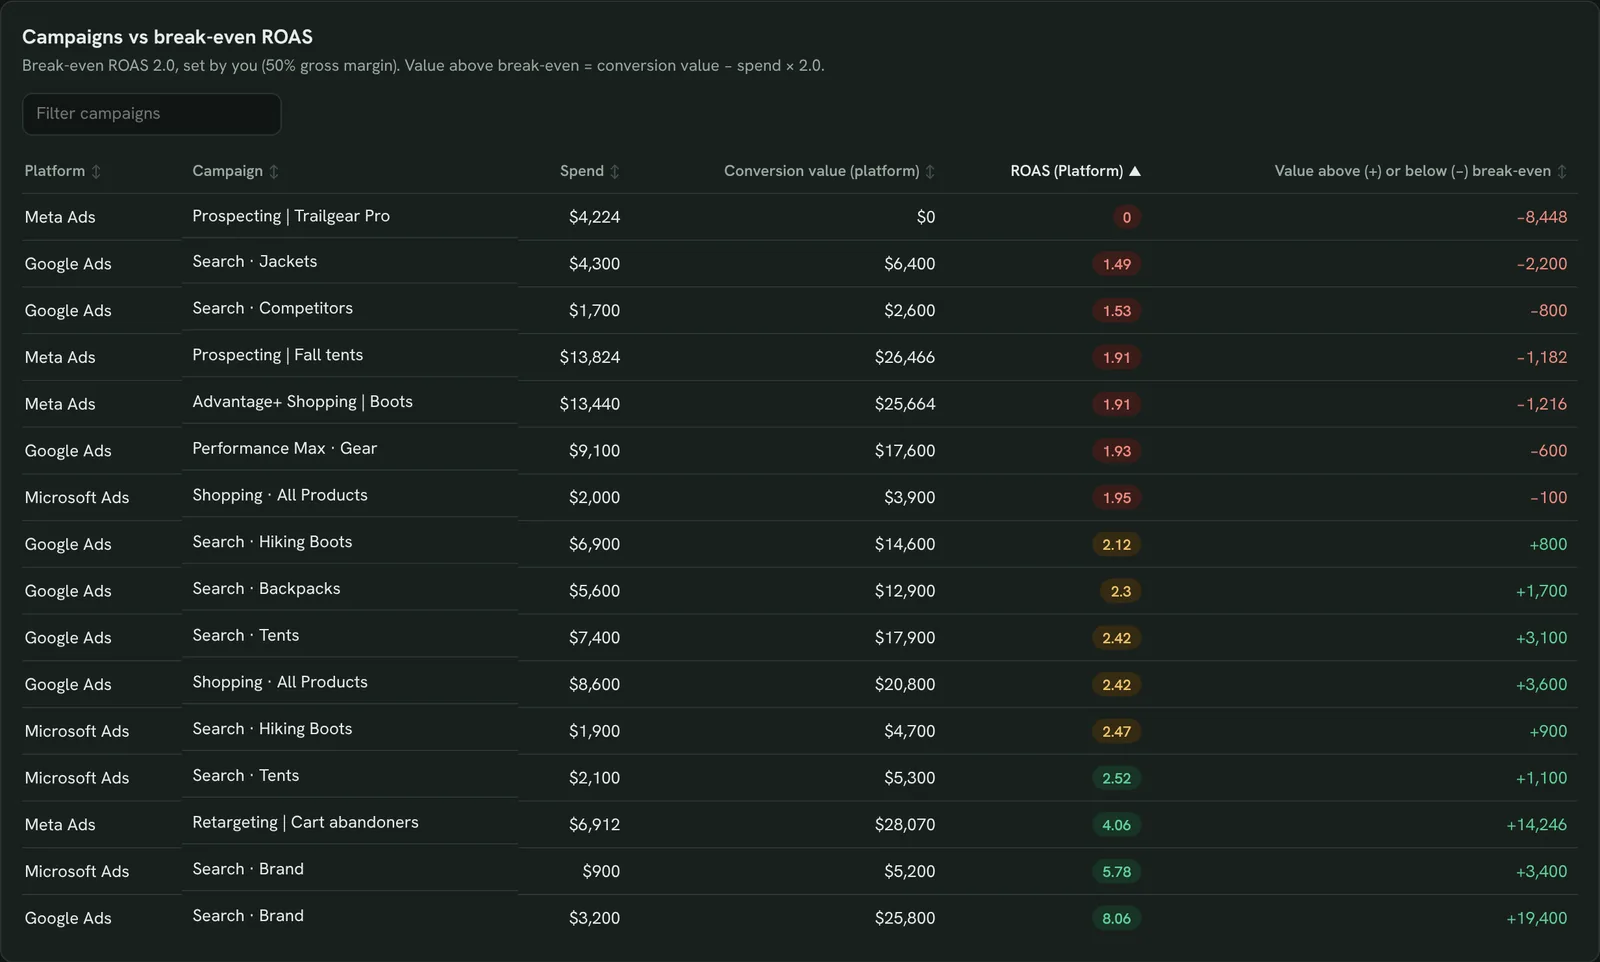
Find campaigns below break-even ROAS
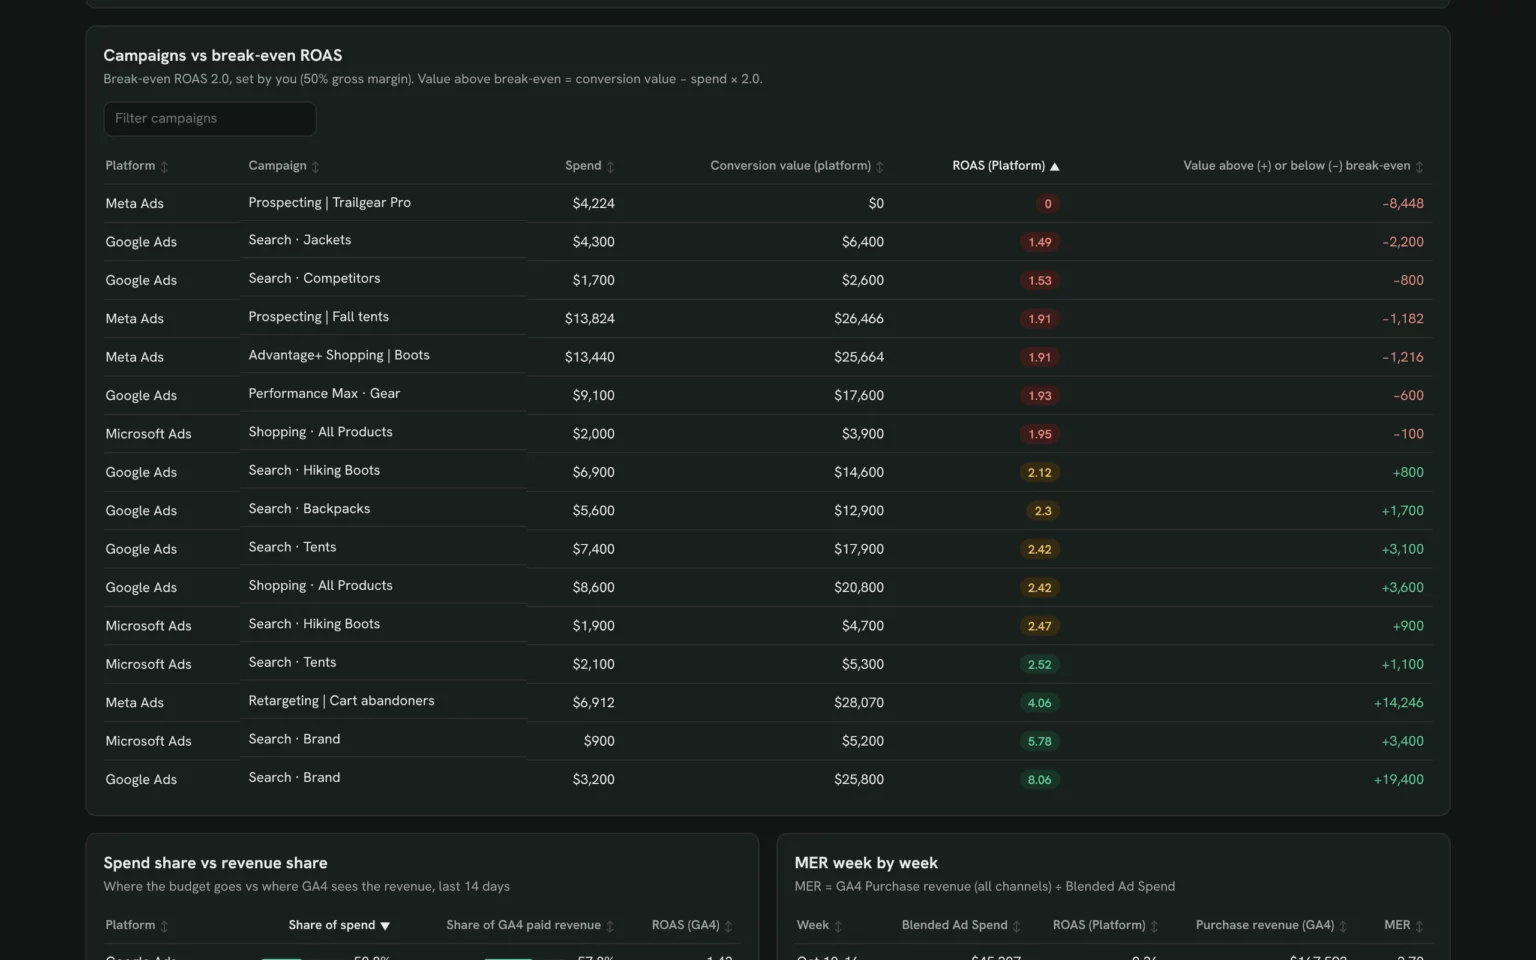
Every campaign’s ROAS against the break-even ROAS you set, so you know which ones lose money.
- Which campaigns sit below break-even?
- How much value do they lose?
My break-even ROAS is [2.0]. List every campaign on all three platforms with spend, conversion value and ROAS, lowest first.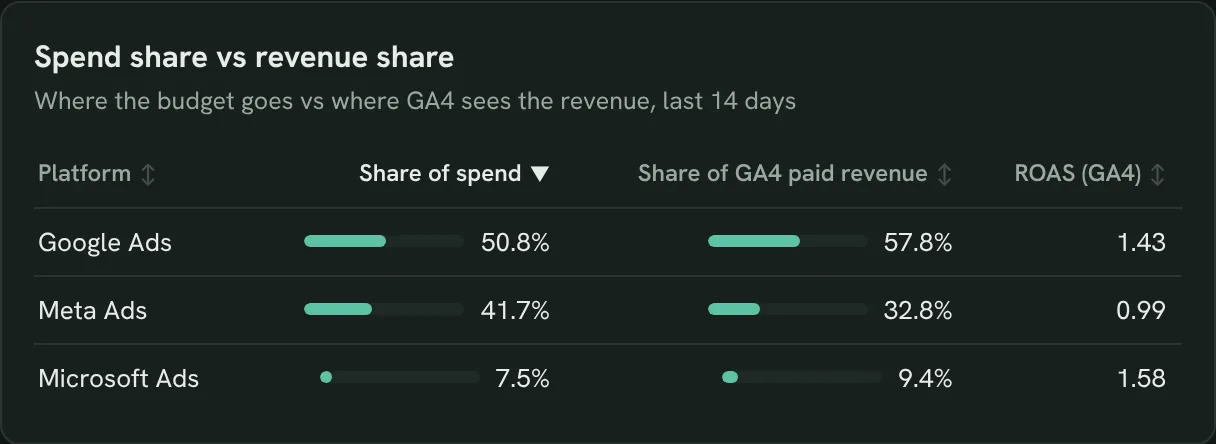
Match budget to revenue share
Each platform’s share of spend against its share of GA4 revenue, so you see where budget is out of line.
- Which platform takes more budget than revenue?
- Where would extra budget pay back?
Show each ad platform's share of total spend and share of GA4 paid Purchase revenue for the last 14 days.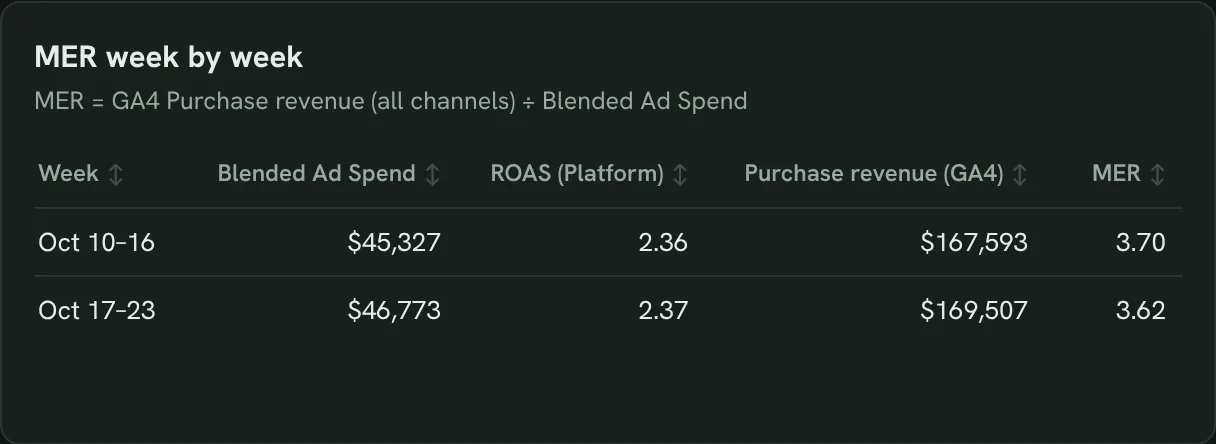
Check MER week by week
Spend, GA4 revenue and MER for each week, so you see if more spend still brings revenue.
- Did MER hold as spend went up?
- Which week paid back best?
Show total ad spend, GA4 Purchase revenue and MER for each of the last two weeks.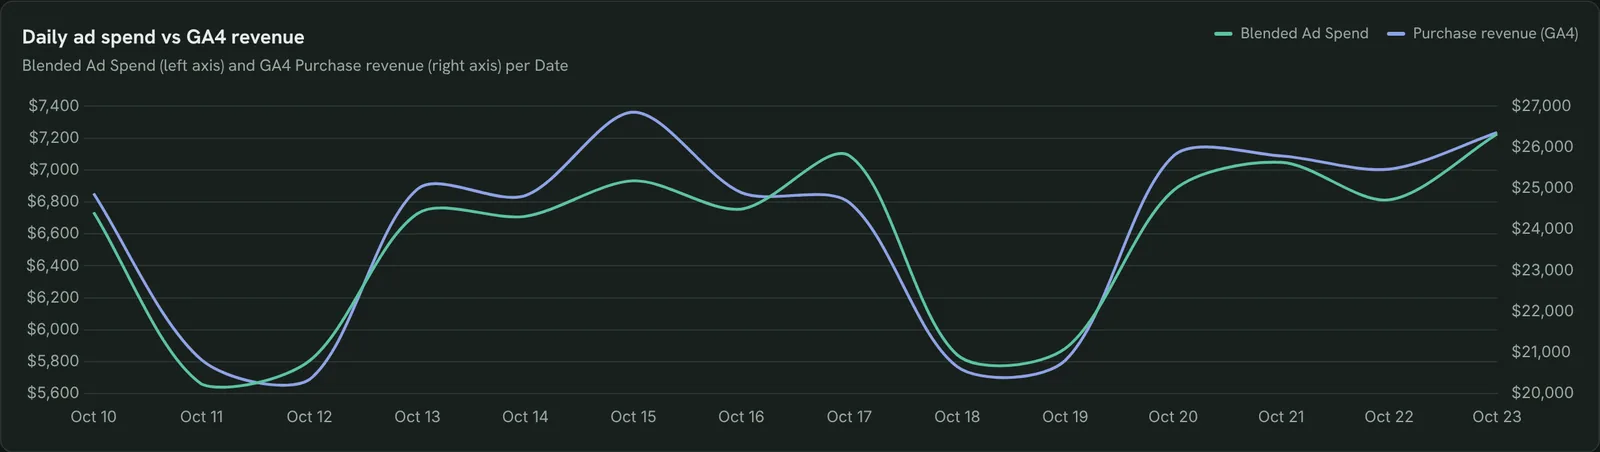
See if revenue follows spend
Daily ad spend against daily GA4 revenue, so you spot days when spend rose and revenue didn’t.
- Do revenue peaks follow spend peaks?
- On which days did spend run ahead?
Chart total ad spend and GA4 Purchase revenue per day for the last 14 days.How to set up the ROAS dashboard in Claude
You need at least one ad platform and GA4, a free Porter account and Claude Pro, Max, Team or Enterprise. Setup takes about 10 minutes.
Connect your ad platforms and GA4 in Porter
Sign up free at Porter, open Data sources and connect Google Ads, Meta Ads, Microsoft Ads and Google Analytics 4. The Google Ads to Claude tutorial and the Meta Ads to Claude tutorial show each click.
Add Porter to Claude
In Claude, go to Customize → Connectors → Add custom connector, paste https://mcp.portermetrics.com/mcp and name it Porter Metrics. Click Continue, then sign in to Porter and allow access.
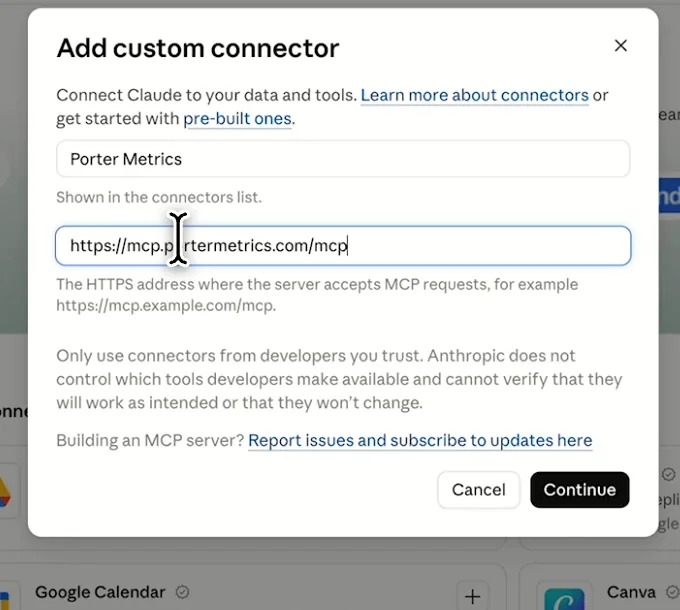
In Claude: Customize, Connectors, Add custom connector, then paste Porter’s MCP URL Paste the install prompt
Open a new chat in Claude, paste this prompt and replace the brand and break-even ROAS in brackets. Comparisons with the previous 14 days need the trial or a paid plan.
Install promptDuplicate this Claude dashboard template and keep its layout, views and styling: https://claude.ai/artifact/SkDeerWRyTXgnPAJ5UNgFT Then rebuild it with my own data through Porter: a ROAS dashboard for [brand] for the last 14 days from Google Ads, Meta Ads, Microsoft Ads and GA4: KPI cards for total ad spend, conversion value, ROAS, GA4 Purchase revenue and MER (GA4 Purchase revenue ÷ total ad spend); each platform's own ROAS (Google Ads Conversions value ÷ Cost, Meta Ads Purchase ROAS, Microsoft Ads Return On Ad Spend) next to GA4 Purchase revenue by Session source / medium; daily ROAS per platform and MER; every campaign's ROAS against a break-even ROAS of [2.0]; share of spend vs share of GA4 revenue; and MER by week. Open in Claude with this prompt
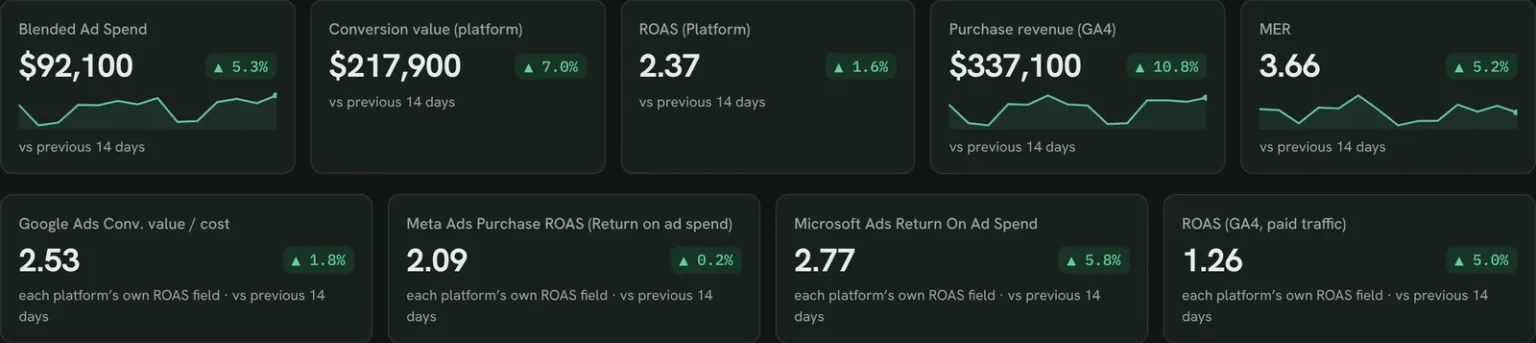
The first thing Claude builds: spend, ROAS, GA4 revenue and MER cards. Demo data shown.
How to use the Google Ads MCP in Claude (no code)
ROAS dashboard fields and data
Each platform keeps its own spend and value field, and GA4 adds Purchase revenue by source, so no platform is left out of the blend.
Top 5 ROAS KPIs to watch
Trailgear demo data · last 14 days vs the 14 before
- ROAS (Platform)2.37+1.6%
Rising while GA4 revenue stays flat means a platform is claiming sales it didn’t drive.
- MER3.66+5.2%
The check no platform can inflate: if it falls, total spend grew faster than revenue.
- ROAS (GA4)1.26+5.0%
Far below platform ROAS on one platform? Look at its attribution window.
- Blended Ad Spend$92,100+5.3%
Read it with MER: more spend only helps if MER holds.
- Purchase revenue (GA4)$337,100+10.8%
Your real sales line. Every other number should explain its moves.
How the numbers are calculated
- ROAS (Platform)
- Conversion value ÷ spend, with each platform’s own fields.
- MER
- GA4 Purchase revenue, all channels ÷ total ad spend.
- ROAS (GA4)
- GA4 Purchase revenue from the platform’s source / medium ÷ its spend.
- Break-even ROAS
- 1 ÷ gross margin (2.0 at a 50% margin).
- Change
- (This period − previous) ÷ previous.
Metrics
 Cost
- Conversions value
- Conv. value / cost
 Amount spent
- Purchase conversion value
- Purchase ROAS (Return on ad spend)
 Spend
- Revenue
- Return On Ad Spend
 Purchase revenue
Dimensions
- Date
- Campaign
- Campaign name
- Campaign Name
- Session source / medium
See all fields:Google Ads · 1,042 fieldsMeta Ads · 1,378 fieldsMicrosoft Ads · 412 fieldsGoogle Analytics 4 · 285 fields
What makes this ROAS dashboard different
Each ad manager grades its own homework. This puts every platform’s ROAS next to GA4 revenue on one screen.
Check every platform against one revenue number
Porter blends the ad platforms with GA4, so MER uses your real sales.
Set your own break-even line
Give Claude your margin and every campaign is judged against it.
Ask why ROAS dropped in the same chat
Spot the dip, then ask Claude which campaign caused it.
Move budget after you approve
Claude changes campaign budgets on Google Ads or Meta once you say yes.
Send clients a report on your logo
Publish it in Porter and email it on the day you choose.
Share it without ad account access
Anyone with the Porter link sees the numbers.
What the dashboard includes
- Spend, ROAS, GA4 revenue and MER cards against the previous period
- Platform ROAS next to GA4 revenue by source / medium
- Daily ROAS per platform, MER and spend vs revenue
- Campaigns against break-even ROAS, spend share and weekly MER
Related dashboard templates
 Claude

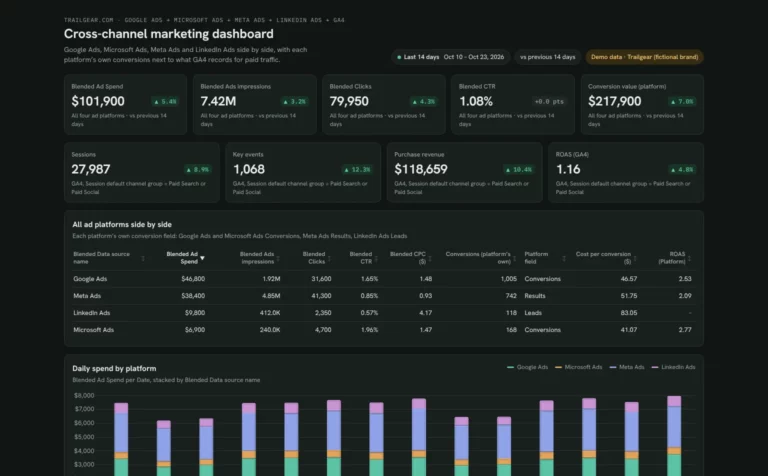
Cross-channel marketing dashboard template
Compare spend, CPA and ROAS across your ad platforms next to GA4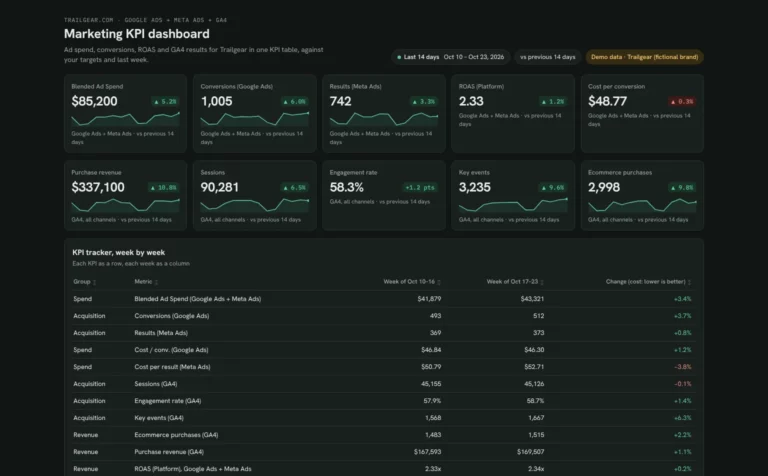 Claude
Marketing KPI dashboard template
Track ad spend, conversions and revenue week by week against your targets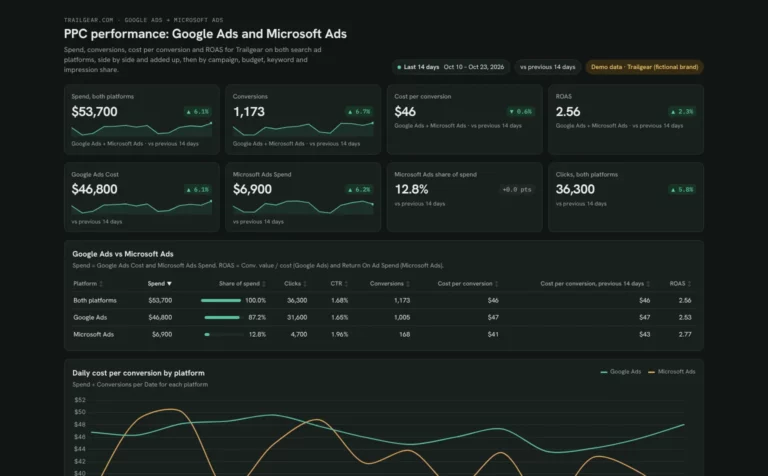 Claude
PPC dashboard template
Compare Google Ads and Microsoft Ads spend and cost per conversion side by side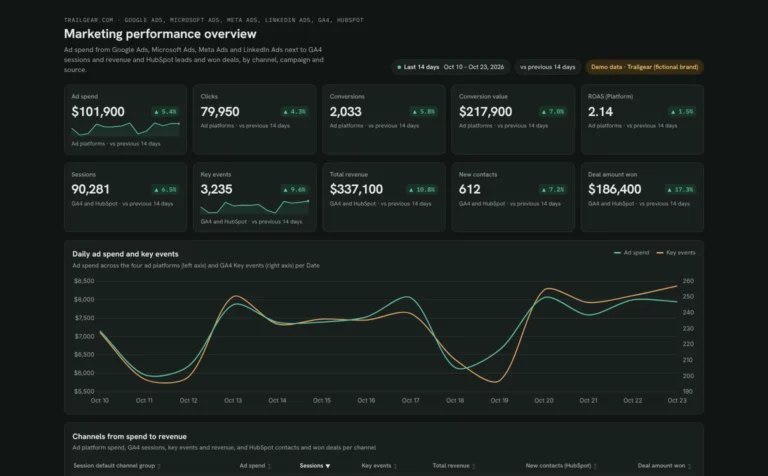 Claude

Marketing dashboard template
See which channels turn ad spend into leads, won deals and revenueBrowse more Claude dashboard templates
 Data Studio
Get your free ROAS dashboard
Sign up free, connect your ad platforms and GA4 and paste the prompt. Your own data fills the same layout as the demo.
Free plan · 14-day trial · No card needed