





Trusted by 1,600+ marketing teams and agencies


What you can do with this SEO dashboard
Five jobs this dashboard does. Click one to see its view on demo data, then paste its prompt into the same Claude chat.
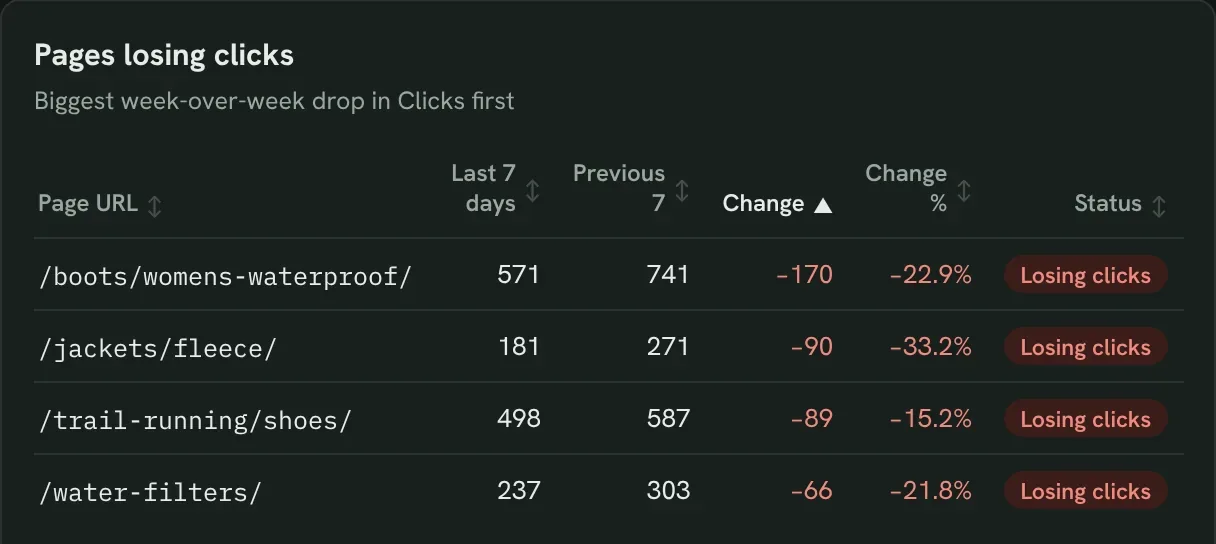
Find pages losing clicks
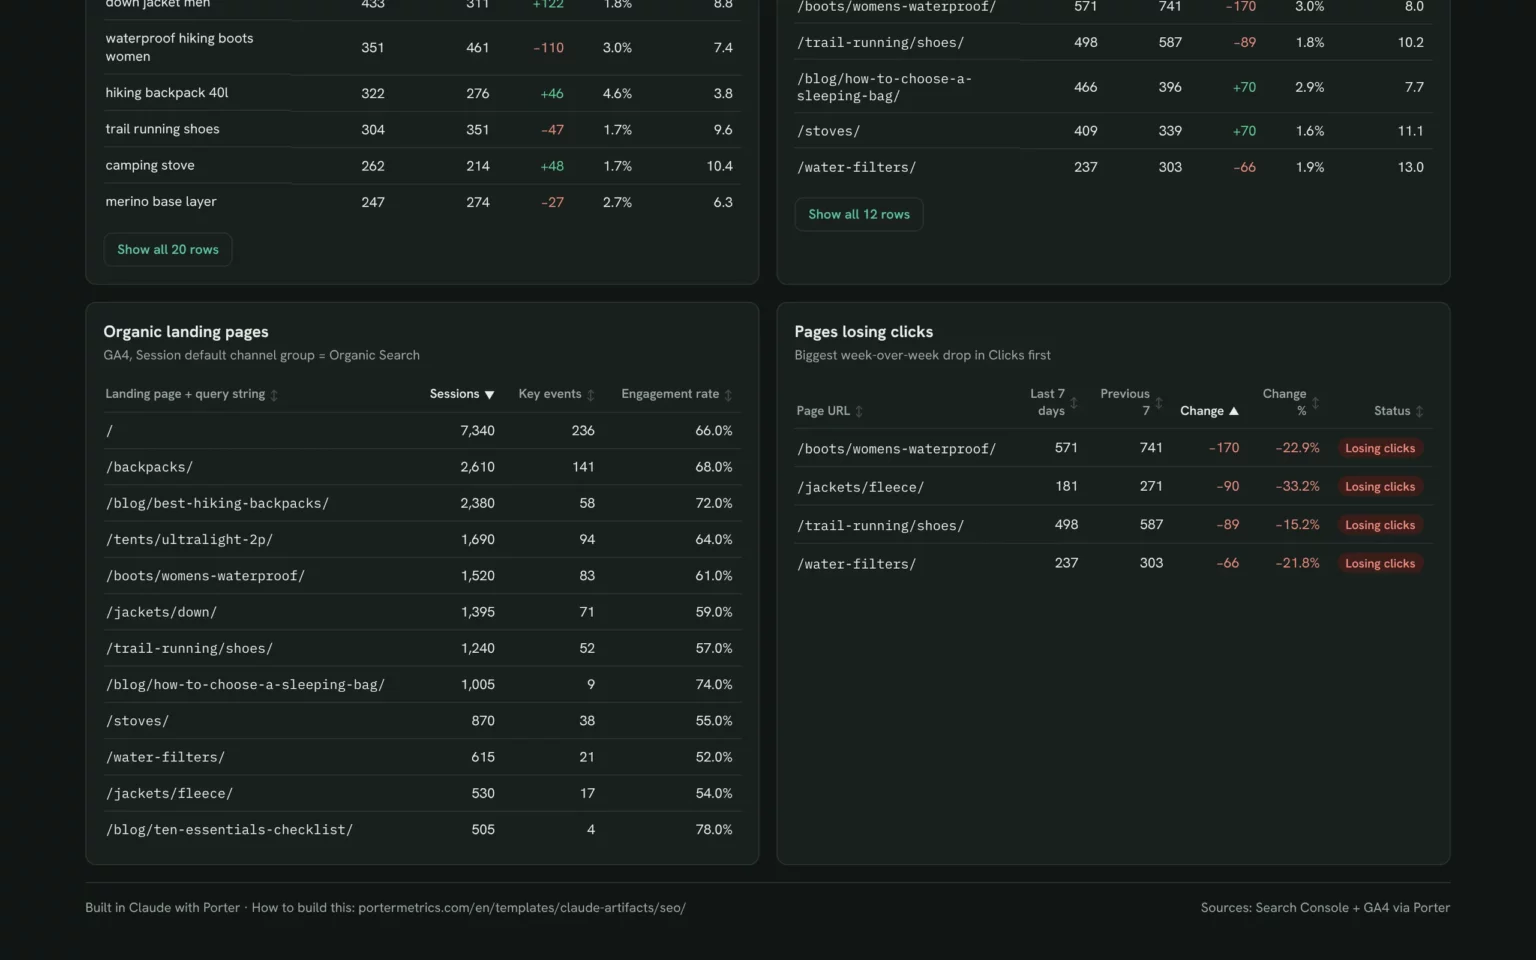
Pages with the biggest drop in clicks this week against last week, so you fix them before the loss grows.
- Which pages lost the most clicks this week?
- How big is the drop on each one?
List the 10 pages with the biggest drop in Search Console clicks for the last 7 days against the 7 days before, with clicks for both weeks and the change.Also built for this: Monthly SEO dashboard template
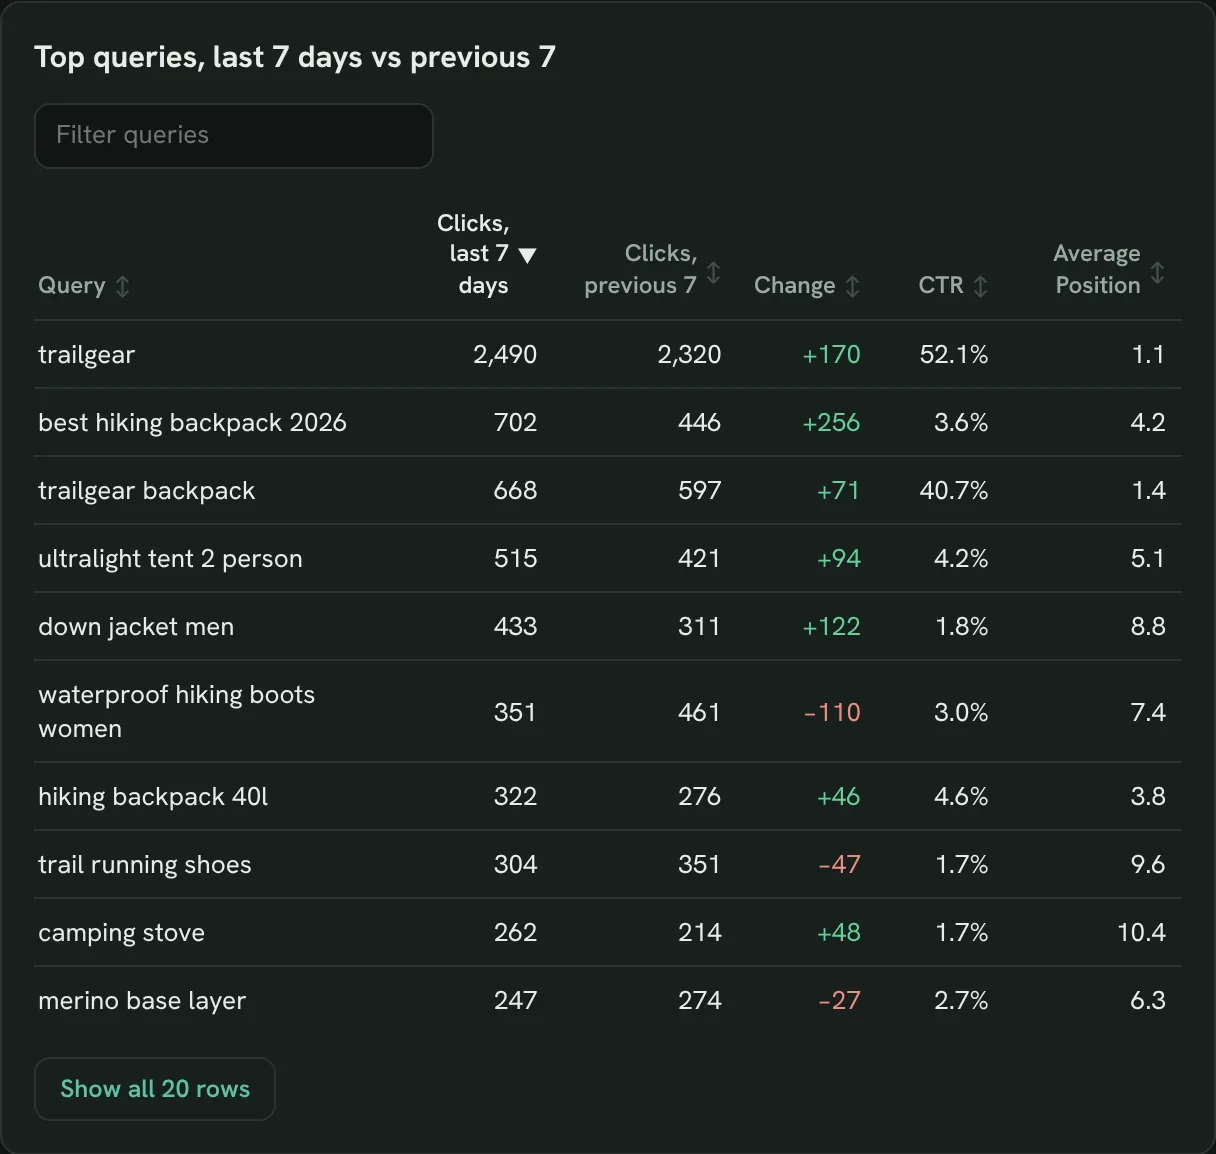
See which queries won or lost clicks
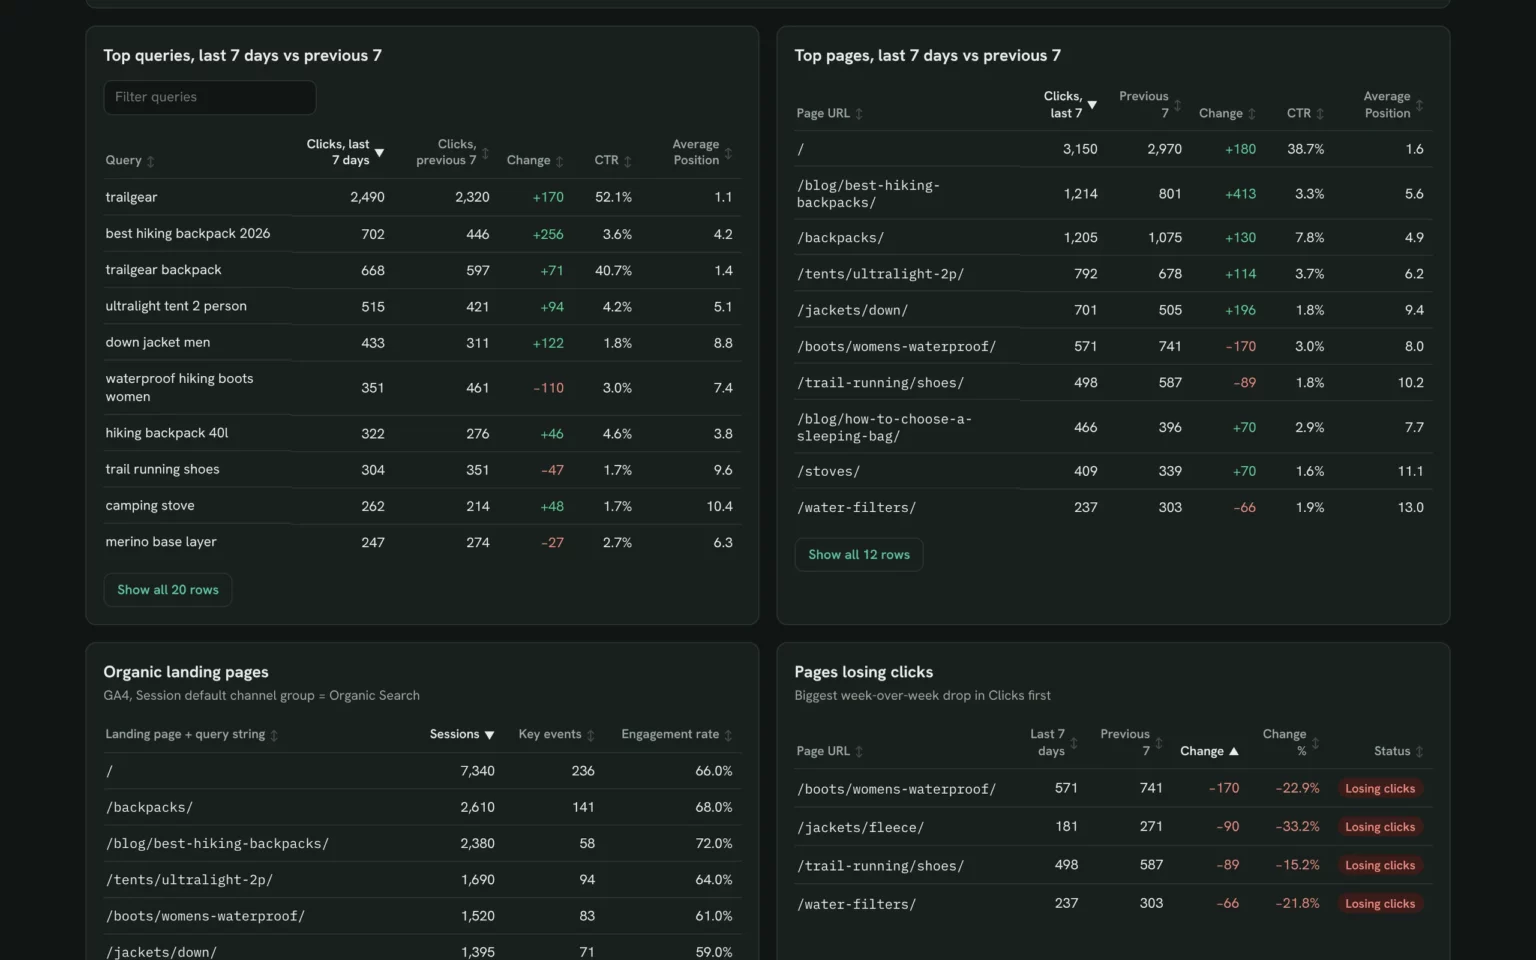
Top queries this week against last week, with CTR and position, so you know which searches moved your traffic.
- Which queries gained the most clicks?
- Did any top query lose position?
Compare clicks per query for the last 7 days with the 7 days before, sorted by clicks, with CTR and average position.Also built for this: Keyword ranking dashboard template
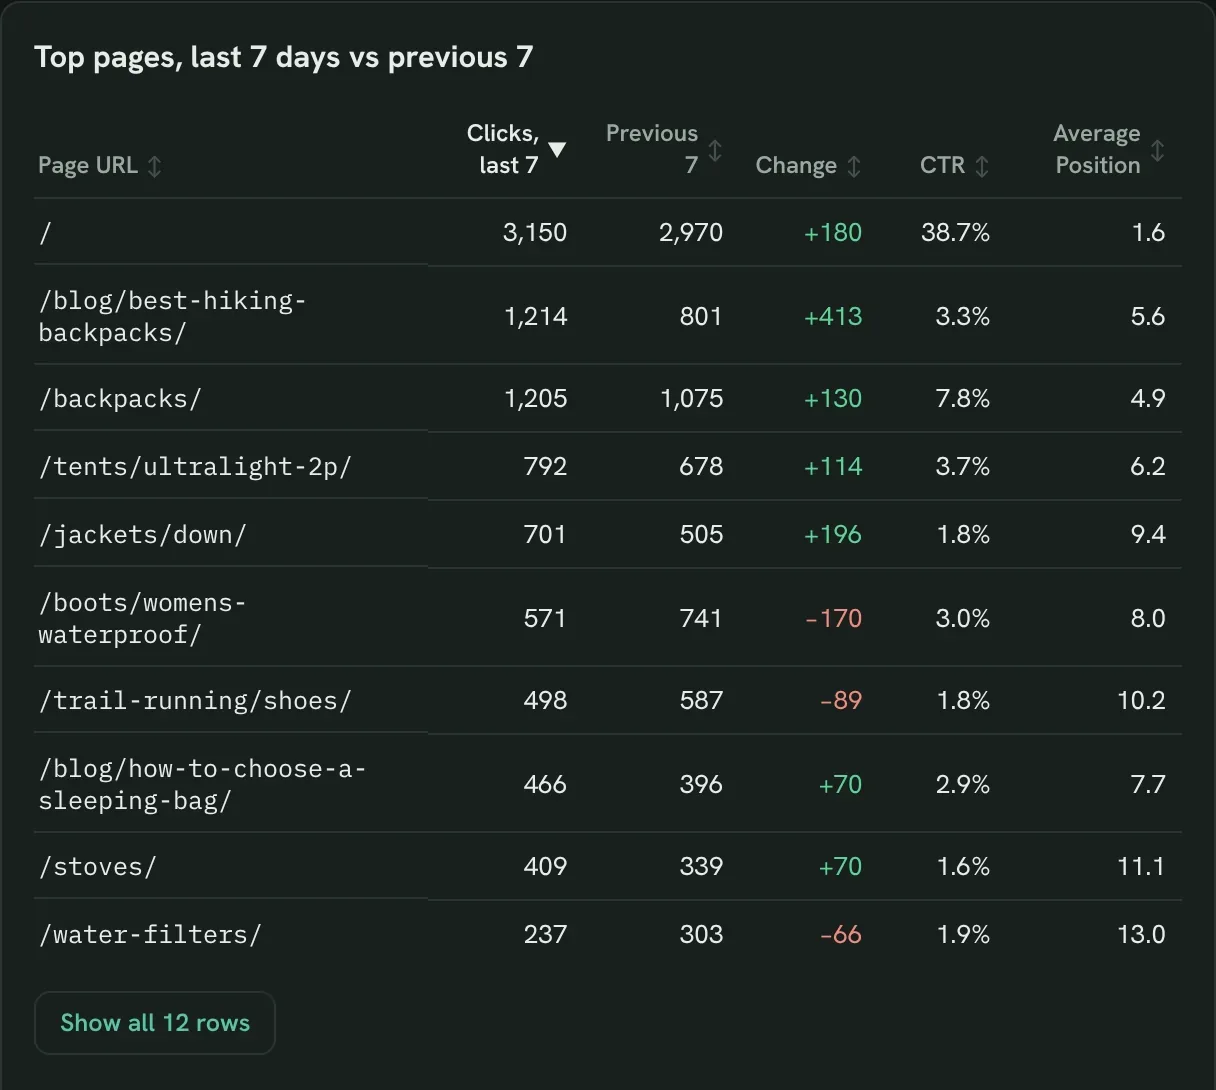
Find the pages that gained clicks
Top pages this week against last week, so you see which pages to build on next.
- Which pages gained the most clicks?
- Did their position improve too?
Compare clicks per page URL for the last 7 days with the 7 days before, with CTR and average position, sorted by the biggest gain.Also built for this: Google Search Console dashboard template
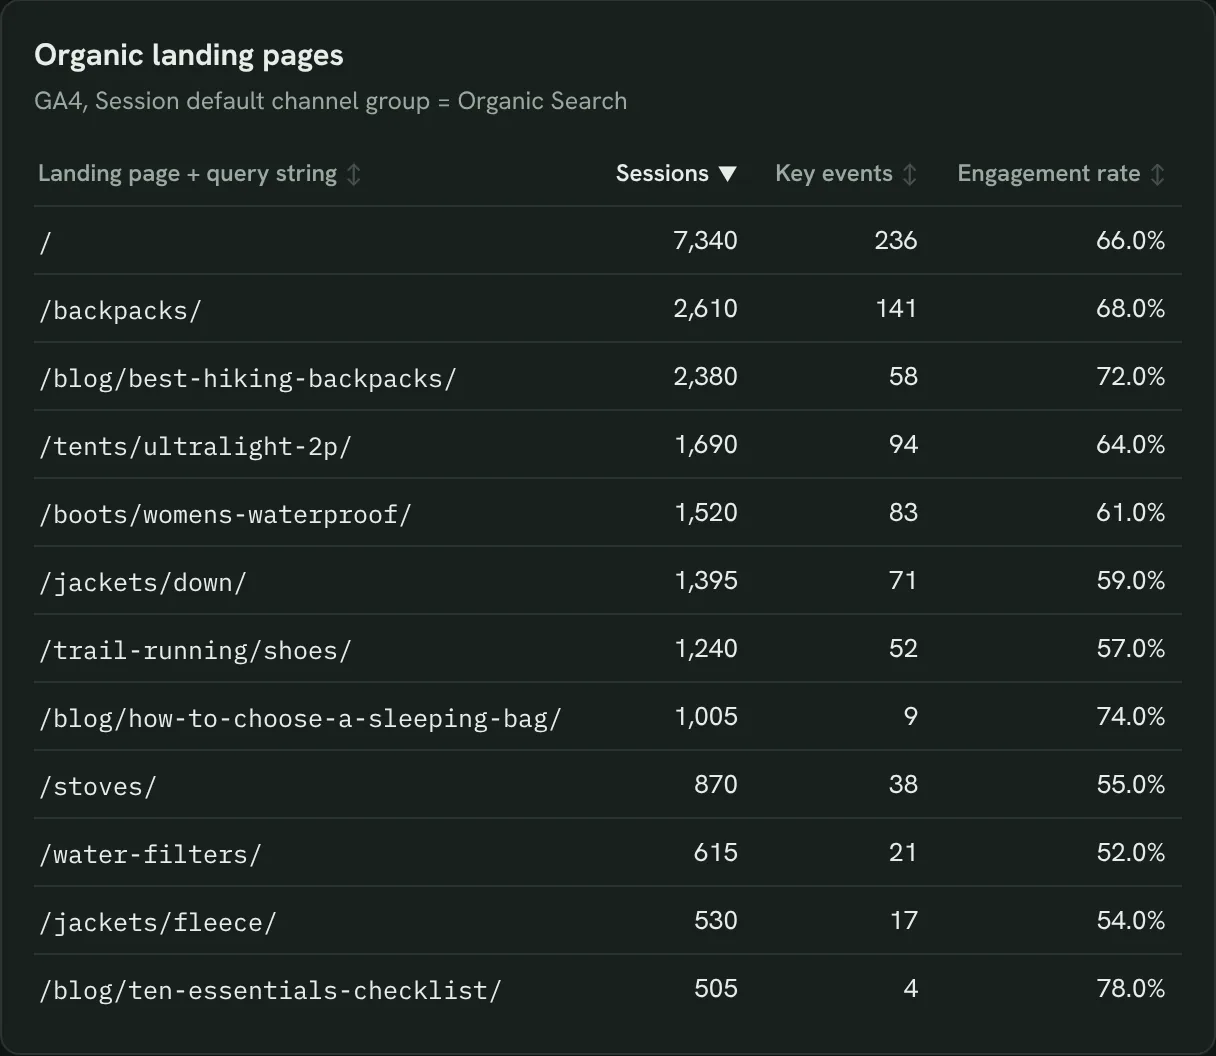
See which landing pages bring key events
GA4 organic landing pages with sessions, key events and engagement rate, so you know which pages turn visits into results.
- Which organic landing pages bring key events?
- Which pages get visits but few key events?
Show GA4 landing pages from Organic Search for the last 14 days with sessions, key events and engagement rate, sorted by sessions.Also built for this: GA4 SEO dashboard template
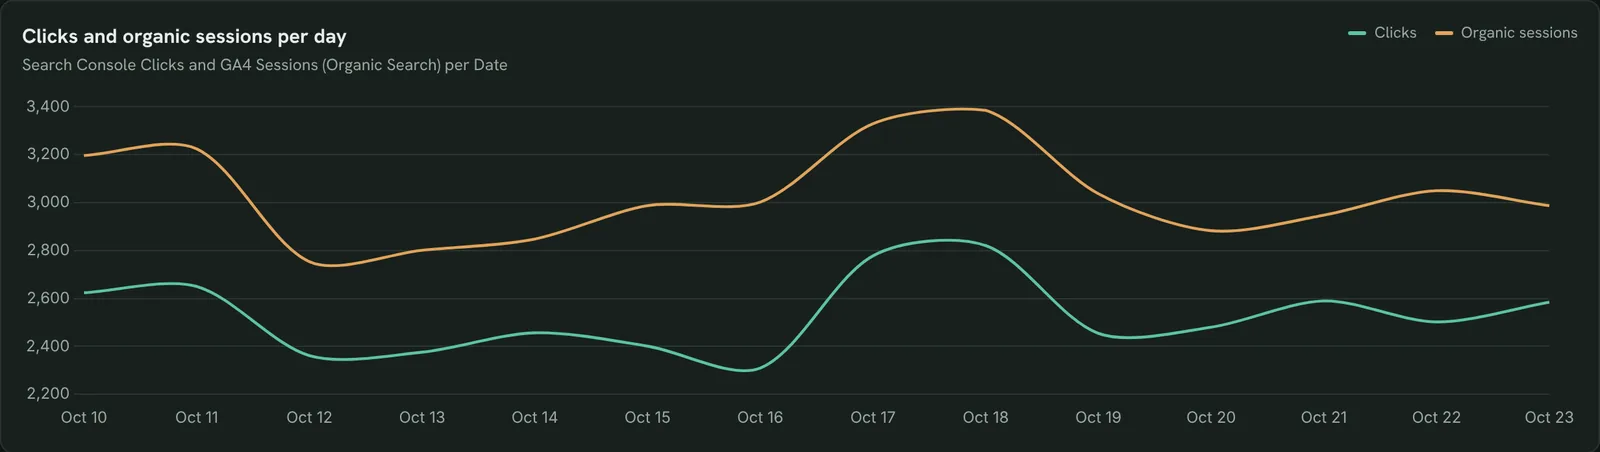
Check that more clicks bring more visits
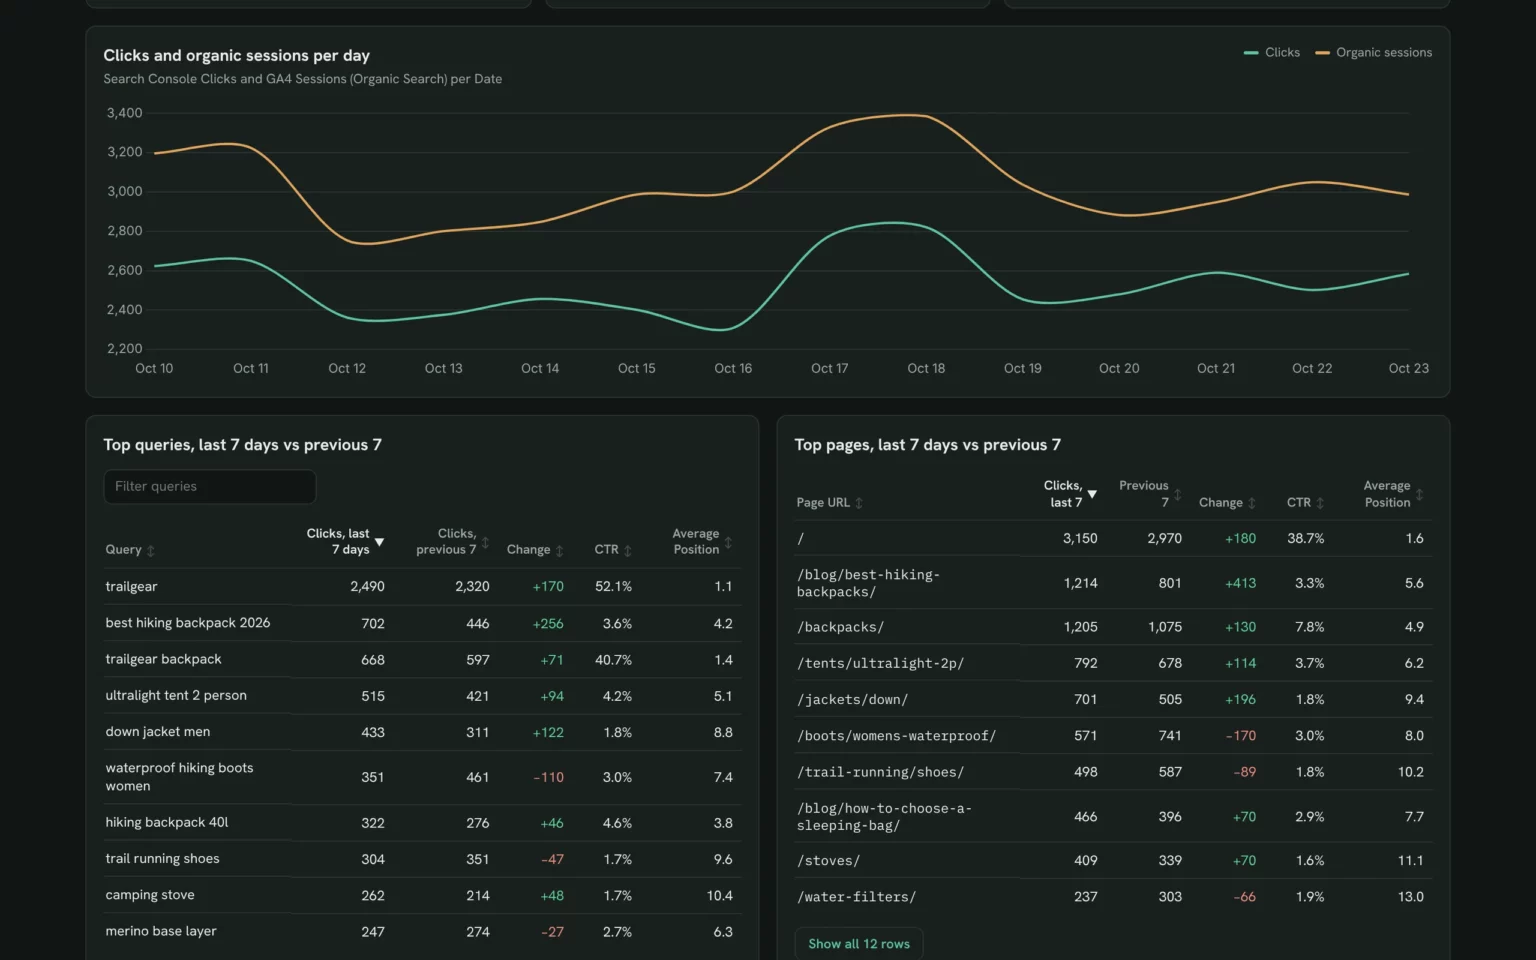
Search Console clicks and GA4 organic sessions per day on one chart, so you spot the days they stop moving together.
- Do organic sessions follow my clicks?
- On which days did they split?
Chart Search Console clicks and GA4 organic sessions per day for the last 14 days and list the days where they moved in opposite directions.Also built for this: Client SEO dashboard template
How to set up the SEO dashboard in Claude
You need a Search Console property and a GA4 property for the same site, a free Porter account and Claude Pro, Max, Team or Enterprise for Claude Dashboards. The whole setup takes about 10 minutes.
Connect Search Console and GA4 in Porter
Sign up free at Porter, open Data sources and connect Google Search Console, then Google Analytics 4, picking the site and property for the same website. The Search Console to Claude tutorial and the GA4 to Claude tutorial show each click.
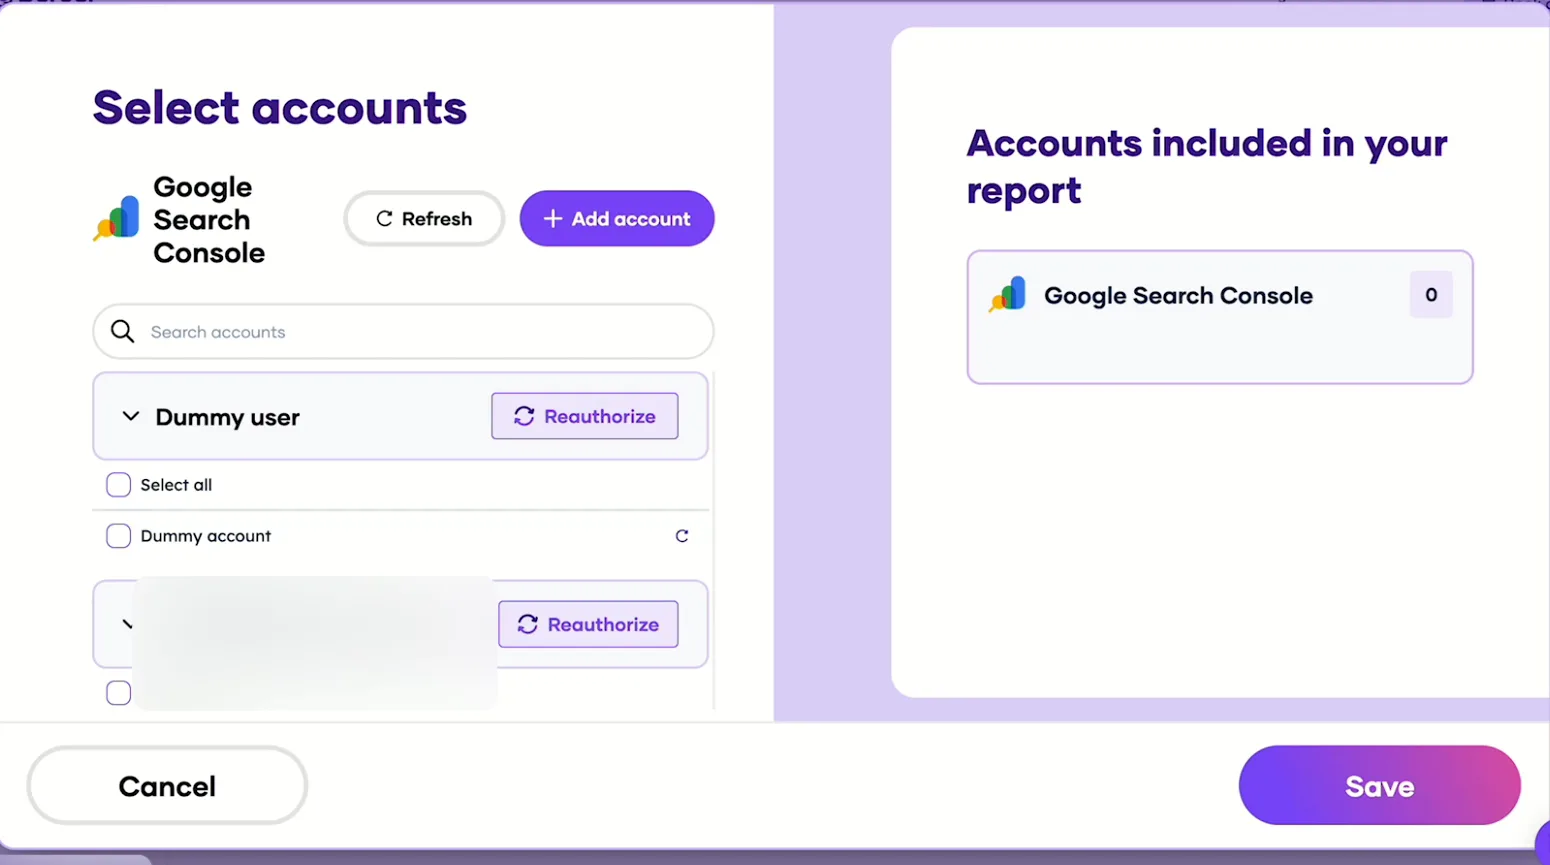
Pick the Search Console sites Claude can read, then save. Add Porter to Claude
In Claude, go to Customize → Connectors → Add custom connector, paste https://mcp.portermetrics.com/mcp and name it Porter Metrics. Click Continue, then sign in to Porter and allow access.
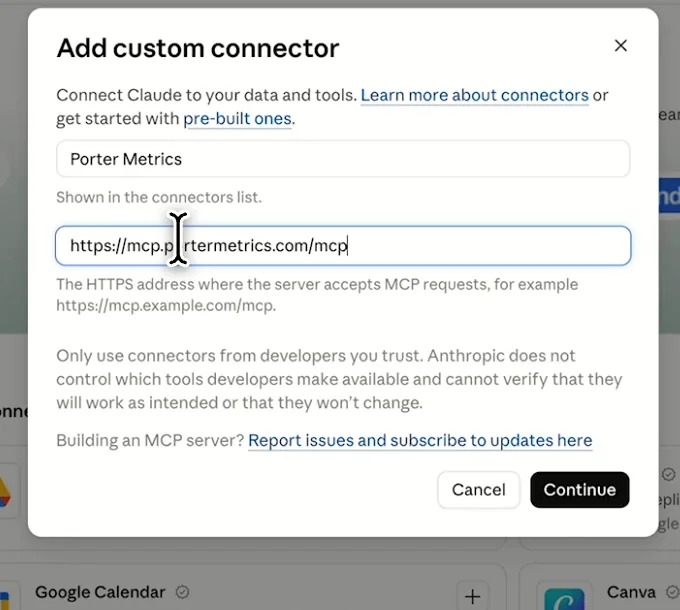
In Claude: Customize, Connectors, Add custom connector, then paste Porter’s MCP URL Paste the install prompt
Open a new chat in Claude, paste this prompt and replace the site in brackets with your own. Claude queries both sources through Porter and builds the dashboard.
Install promptDuplicate this Claude dashboard template and keep its layout, views and styling: https://claude.ai/artifact/BFLvegGwbuvXpAKDySWKFE Then rebuild it with my own data through Porter: an SEO dashboard for [site] for the last 14 days: Search Console clicks, impressions, CTR and average position with a daily trend, GA4 organic sessions, engagement rate and key events, then the top queries and pages comparing the last 7 days with the 7 days before. Flag pages losing clicks. Open in Claude with this prompt
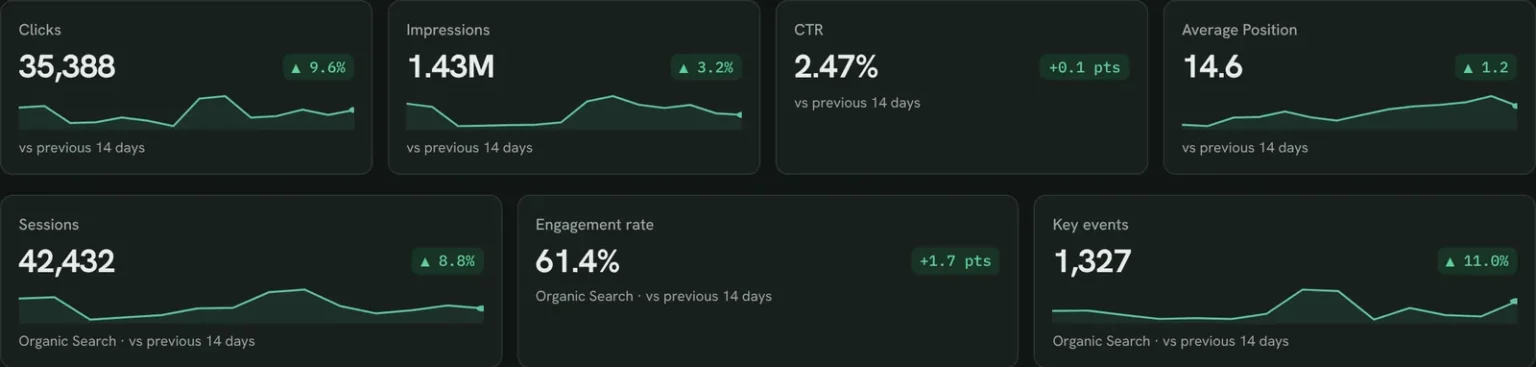
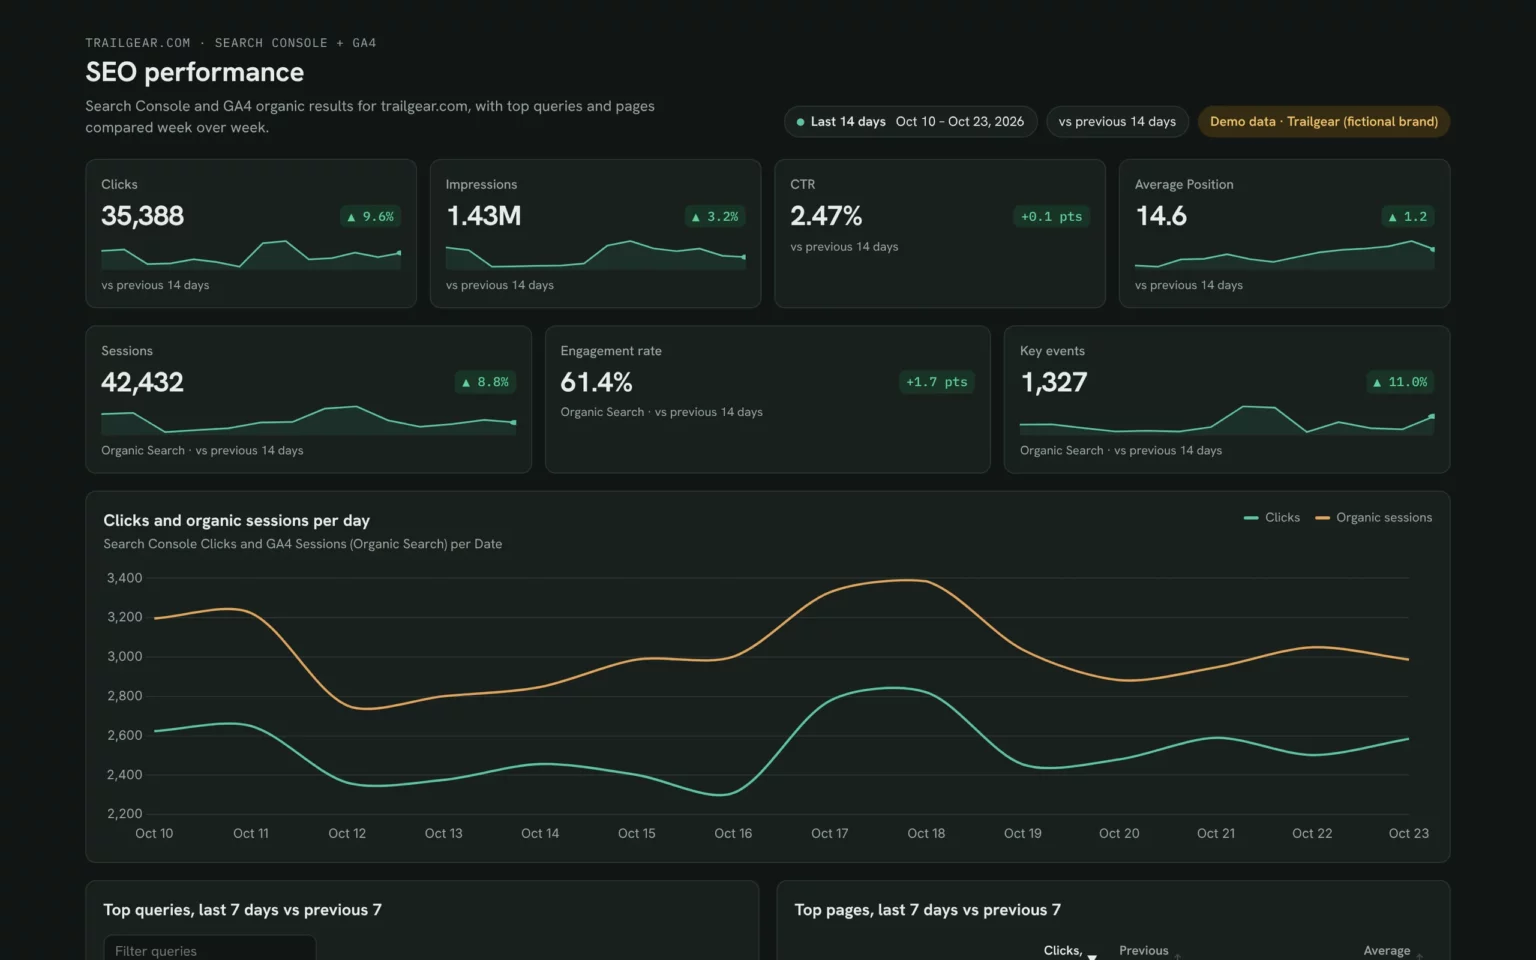
The first thing Claude builds: Search Console and GA4 KPI cards for your own site. Demo data shown.
Build a Google Search Console dashboard with Claude
Search Console and GA4 fields and data
The template reads four Search Console metrics and three GA4 metrics, joined on page URL and date. Porter reads 27 Search Console fields and 285 GA4 fields if you need more.
Top 5 SEO KPIs to watch
Trailgear demo data · last 14 days vs the 14 before
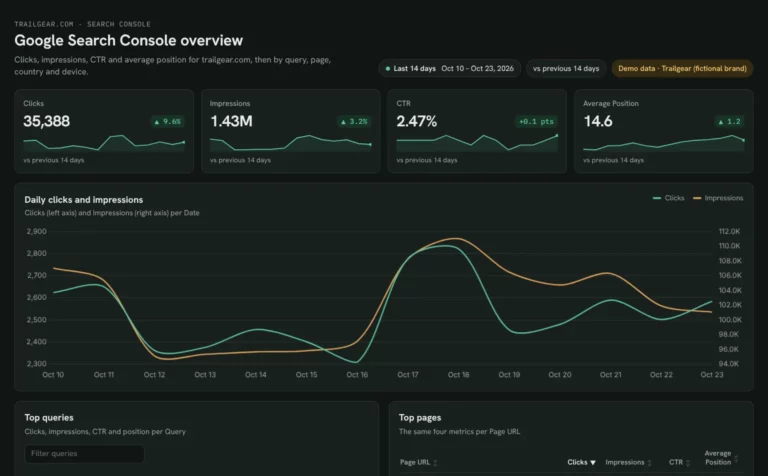
- Clicks35,388+9.6%
The number that pays. When it drops, open the pages losing clicks first.
- Impressions1.43M+3.2%
Rising impressions with flat clicks means people see you but your titles don’t win the click.
- Average Position14.61.2 better
Watch the trend, not one day: a falling number means your pages are moving up.
- Organic sessions42,432+8.8%
If clicks rise and sessions don’t, check tracking and redirects on the landing pages.
- Key events1,327+11.0%
The result SEO is for. Compare it with sessions to see which pages convert.
How the numbers are calculated
- CTR
- Clicks ÷ impressions.
- Average position
- Google’s average top position for your pages on a query, weighted by impressions. Lower is better.
- Organic sessions
- GA4 sessions where the session default channel group is Organic Search.
- Engagement rate
- Engaged sessions ÷ sessions.
- Change
- (This period − previous period) ÷ previous period. Position change shows as “better” when the number drops.
Data sources
Metrics
 Clicks
- Impressions
- CTR
- Average Position
 Sessions
- Engagement rate
- Key events
Dimensions
- Date
- Query
- Page URL
- Session default channel group
- Landing page + query string
See all fields:Google Search Console · 27 fieldsGoogle Analytics 4 · 285 fields
What makes this SEO dashboard different
What you get that Search Console and GA4 can’t show you side by side.
Stop matching numbers by hand
Porter joins both sources on page URL, so clicks and key events sit in one table, not two tabs.
Ask the next question in the same chat
Spot a drop, then ask Claude which queries caused it, without exporting anything.
Compare any two periods
Put this week next to last week, the weeks around an update or the same weeks last year.
Split branded and non-branded clicks
Define your brand terms once as a Porter custom metric to see if growth comes from new searchers.
Send clients a report on your logo
Publish it in Porter and email it, with your logo, on the day you choose.
Skip the CSV downloads
A refresh pulls the latest days Google has published, so nobody copies numbers by hand.
What the dashboard includes
- Search Console cards for clicks, impressions, CTR and average position against the previous period
- GA4 cards for organic sessions, engagement rate and key events
- A daily clicks and organic sessions chart
- Top queries and top pages, this week against last week
- GA4 organic landing pages with key events
- A pages losing clicks table
- Share by link, PDF and scheduled email once published in Porter
Related dashboard templates
 Claude
Google Search Console dashboard template
Find queries close to page one and fix low CTR by page and device.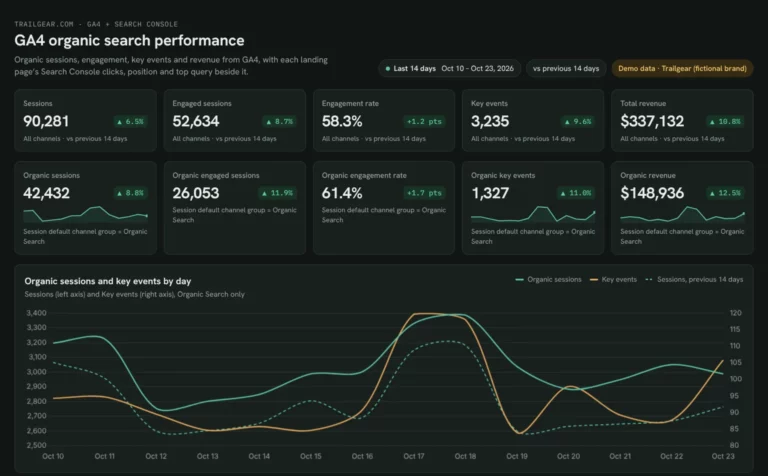 Claude
GA4 SEO dashboard template
See which landing pages bring organic sessions and key events.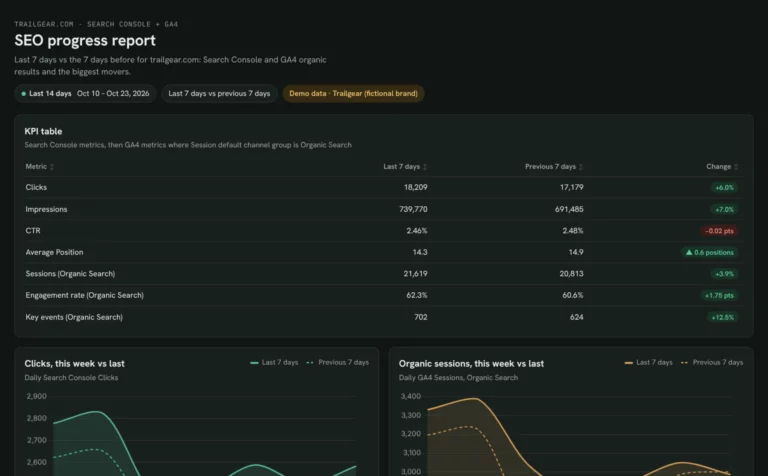 Claude
Monthly SEO dashboard template
Show month-on-month SEO results and the pages that moved them.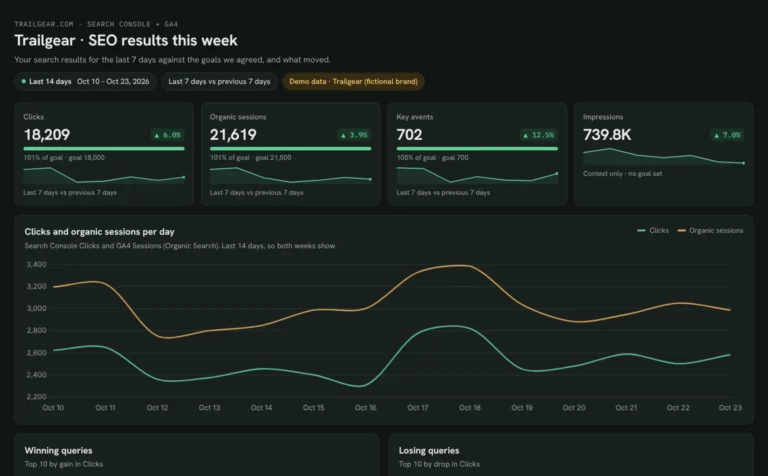 Claude
Client SEO dashboard template
Report clicks, sessions and key events against each client’s goals.Browse more Claude dashboard templates
 Data Studio
 Google Sheets
 ChatGPT
Get your free SEO dashboard
Sign up free, connect Search Console and GA4 and paste the prompt. Your own data fills the same layout as the demo.
Free plan · 14-day trial · No card needed