


If you’ve ever felt like there is an easier way to use social media, you are on the right article. Nowadays, you need to create mountains of content to be on top when you need to work smarter.
Have you ever heard of the saying work smarter, not harder? Well, this is what happens on social media.
Why It’s So Hard to Measure Organic Social Media?
If you create reports on social media, you would ask questions like how can I create a report or ensure that my report is read and understood. You would also want to know the metrics to note.
Measuring social media is very hard because you know you can track likes, Impressions, engagements, etc., but what about the money?
The most important reason is money, Meta, and Google – these platforms need the incentive to allow you to track your performance on social media.
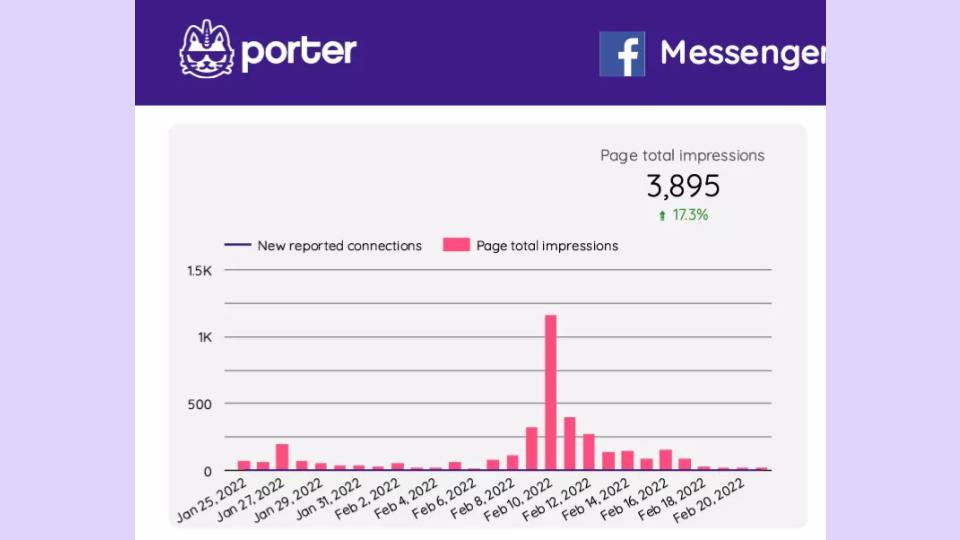
If you go to your Facebook reports on your Facebook pages, you will see that you can track reach, engagement, likes, and zero money and conversions.
What about Google ads or Facebook ads; if you go to Facebook ads, you can see that you can track your conversions on your website, on Facebook, on Messenger, and so on.
You can track these things, but if you go to Google ads, you can see exactly what keyword is driving conversions; if you want to do it on SEO, you cannot.
You can track keywords that deliver traffic but cannot tie traffic or conversions to specific keywords on the Google search console.
Why? Because many times Google needs the incentive to let you track this data. Another reason they do this is that, as marketers and advertisers, you pay for ads, not just for effectiveness or buying an audience.
You are willing to pay for ads for predictability, even though this predictability is expensive.
Most people do this because, for instance, you are a startup with an extensive clients, and you are on the 15th day of the month below your goals.
As a result, the manager says, let’s turn on the ads, spend more on ads, and that’s when you pay for the predictability. Businesses pay for peace of mind even though the data doesn’t make sense.
This is so because there are many companies or startups today whose cost per acquisition needs to be clarified and still willing to pay.
Meta and Google want you to measure better ads, and they don’t want you only to measure better your organic efforts because they are getting money from it. This is the only reason why measuring social media is tricky.
Apple made these changes in iOS 14. Meta reported that it lost $10 billion in the last quarter. They lost $10 billion because of those measures.
Why is Apple doing this?
First, it is an economic incentive. They will be pushing stronger on their ads Network, which is privacy. We are living in a world where privacy is becoming increasingly important.
Why? The first incentive of measurement is companies don’t want you to measure better; organic efforts.
Why is it not easy to solve?
If the reason were technological, a developer would do it. Someone in China, India, Latin America, in the US will figure out a way to track things, and many people will pay for this.
But when the reasons are economic and political, there is no strong incentive to fix this. That is why the future looks harder to measure.
Measuring ROI and conversion from social is hard, but here is how to measure social media. When you use social media, there are four things that you want to measure;
- Visibility
- Engagement
- Conversion
- Productivity
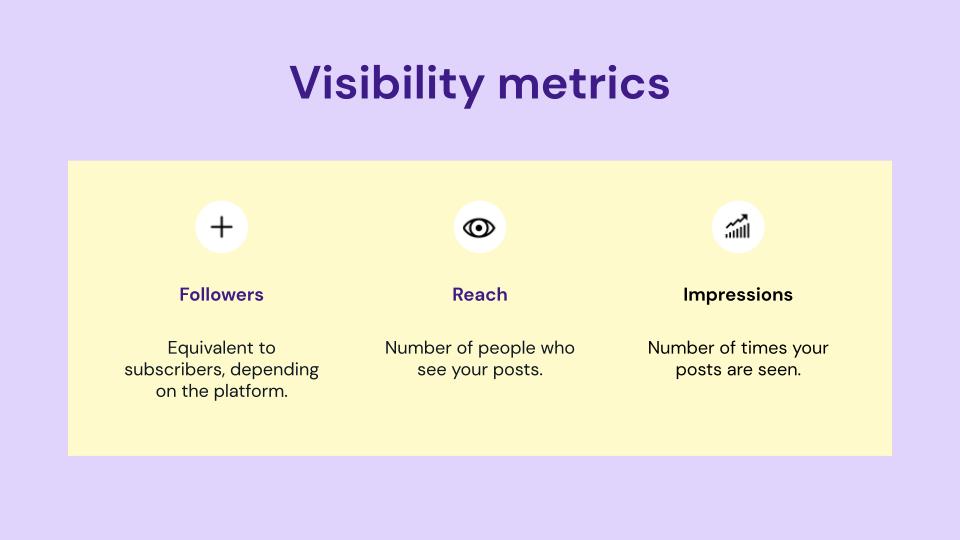
1. Visibility
Visibility is making sure that more people see and know about you. Two metrics are essential to measuring visibility – Followers represent subscribers; the more you have on social media, the more you have visibility.
This is false because Meta is changing its algorithm not to prioritize your followers. In the end, having subscribers matters; the more subscribers you have you sometimes tend to have visibility.
This applies to YouTube, for instance. You have subscribers depending on your social media, and the second metric is Reach and Impressions.
- Reach
Reach is the number of people that see your posts.
- Impression
An impression is the number of times your posts are seen.
So Reach is people, and Impression is actions. This is important because when you calculate your engagement rate, you will use just one Impression and not Reach, or if you use Reach, you need to modify your engagement rate.
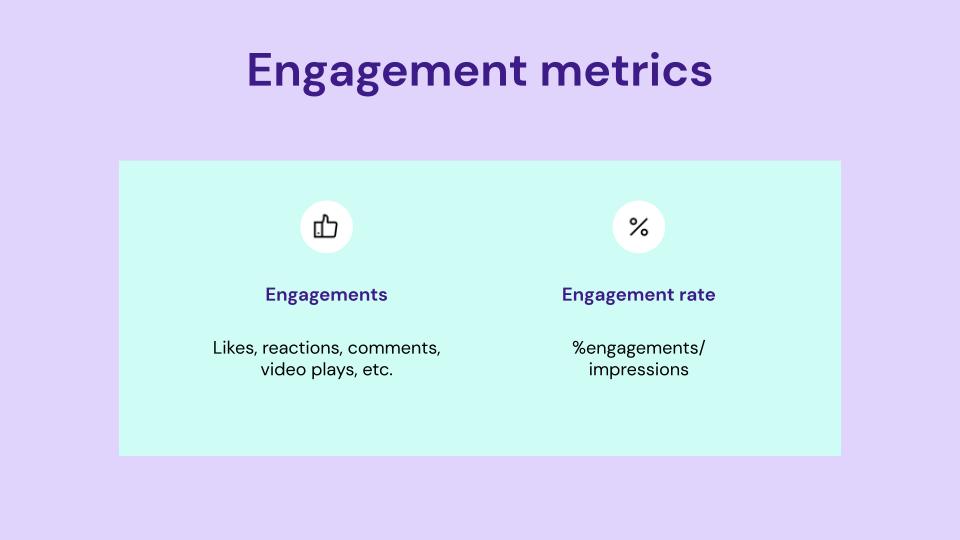
2. Engagement
Engagement is about the people, the audience; this visibility is if they interact with your content. Also, there are two metrics; engagement and engagement rate.
Engagement depends on the platform, content, and post you are doing. An engagement can be like; a click, a video play, a tap, etc., representing the behaviour of interacting with content.
The engagement rate is the percentage of Impressions that end up in action. So if you have a hundred Impressions and three of those Impressions ended in an engagement, then your engagement rate is 3%.
Social media platforms want you to deliver engaging content, not promotional. So if you want to play the social media game, you need to stop focusing on conversion tracking and delivering value to more people.
Because somehow that will pay back, and that will deliver to your business, and this is the opportunity most marketing managers desire.
They want to track everything and have this sense of predictability, but most people are only willing to play if they care about winning the game.
There are some ways to measure your engagement on Instagram or Facebook;
- Go to Porter Metrics’ website
- Click on make a report
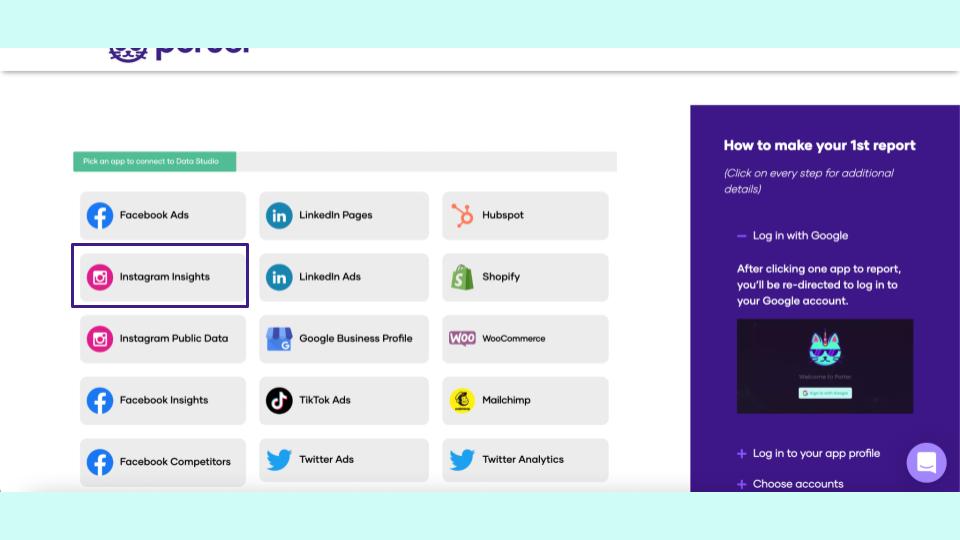
- Choose Instagram or Facebook
- You connect to Google Data Studio (formerly Looker Studio) and Data Studio
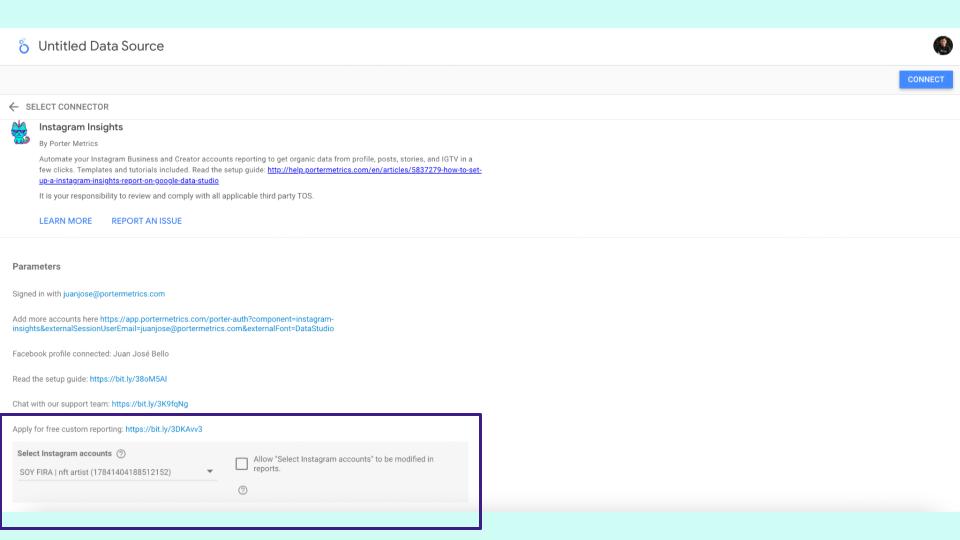
- Choose your Instagram page
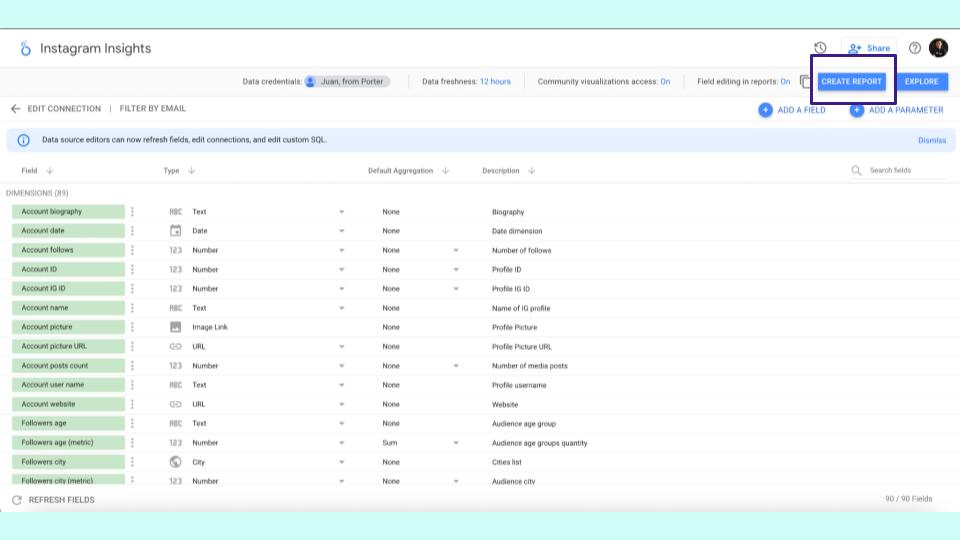
- You go to Data Studio, create a report, and then you will have a free report.
You can try Porter metrics for free for 14 days, and you can make reports for your clients or your business.
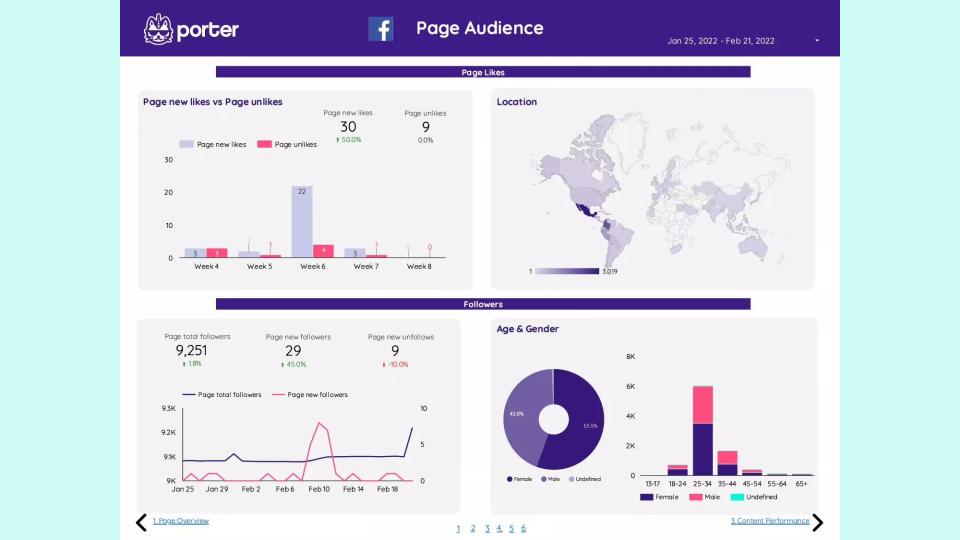
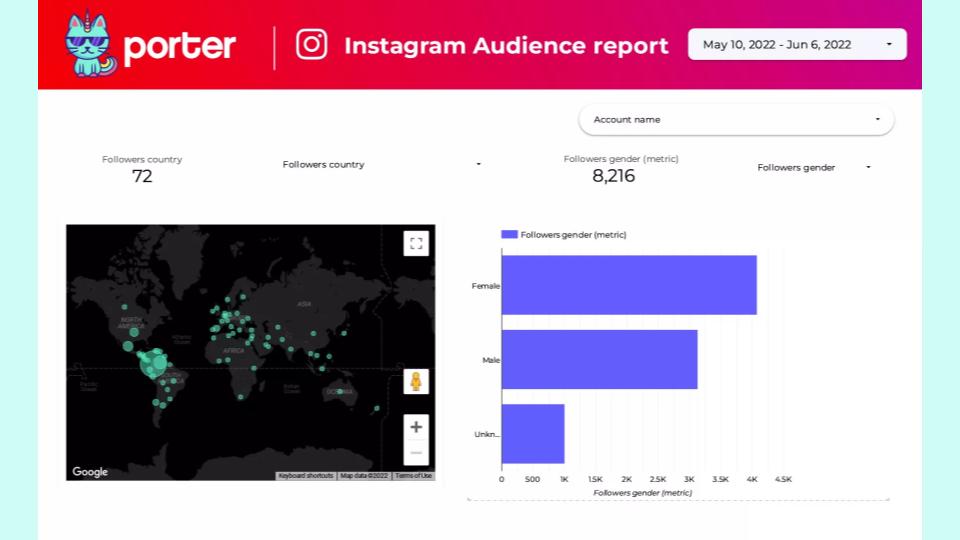
Also for Facebook, if you connect your Facebook page, Facebook lets you know the gender, age, country, and some other demographic data.
3. Post-Performance Rate
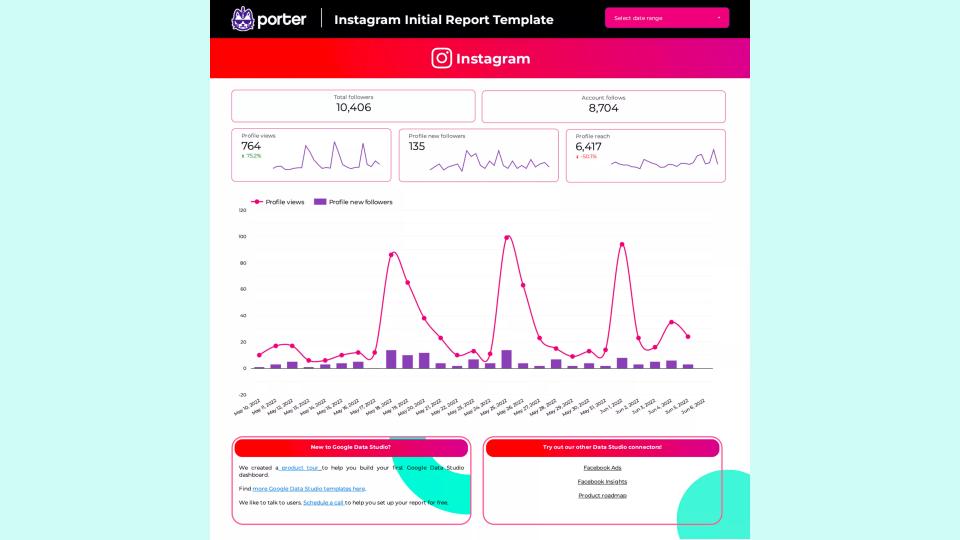
Finally, the post-performance; if you create your report for Instagram or Facebook on Data Studio using Porter, you can know your post-performance.
Post-performance shows engagements, Impressions, and calculating engagement. If you follow the above process again, you get the best-performing posts.
For instance, video performance; if you publish video content on Instagram or Facebook, you can get this data for free with Google Data Studio.
If you want to visualize or track your videos, you can see how many because you are getting how many views in three seconds, 10 seconds, and 30 seconds.
How to calculate your post-engagement rate
- Go to your Instagram report.
- Click on the table (download Porter metric templates or use Porter Metrics product so you can get the report by default)
- Go to report
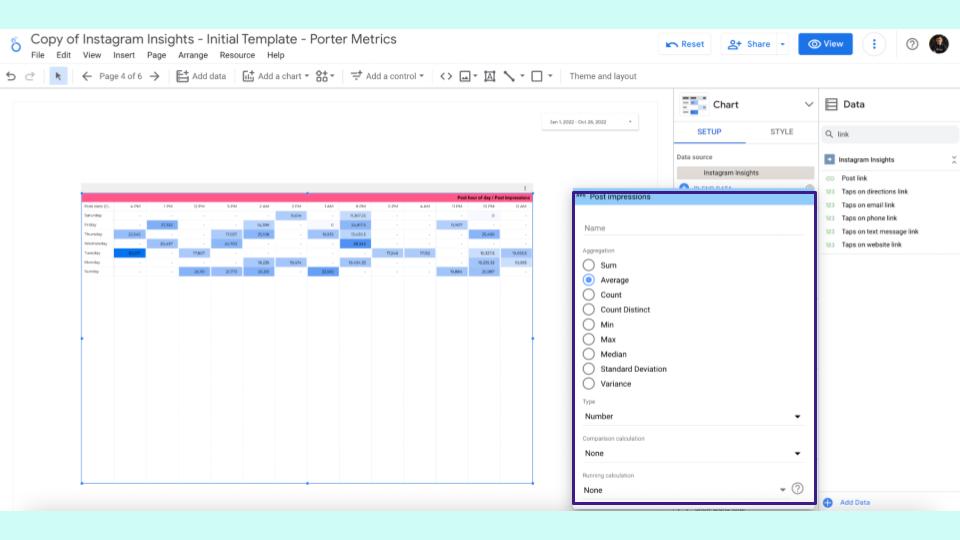
- Click on the table, then change the metrics; you only see data for posts
- Bring to metrics post Impressions and post engagements
- Calculate your engagement rate – click on a new field and create a formula. (the formula is post engagements divided by post Impressions)
- Transform this number into a percentage, and you’re done.
How To Calculate Engagement Rate With Social Media Report
Go to Google Data Studio and check for your best posts based on the engagement rate.
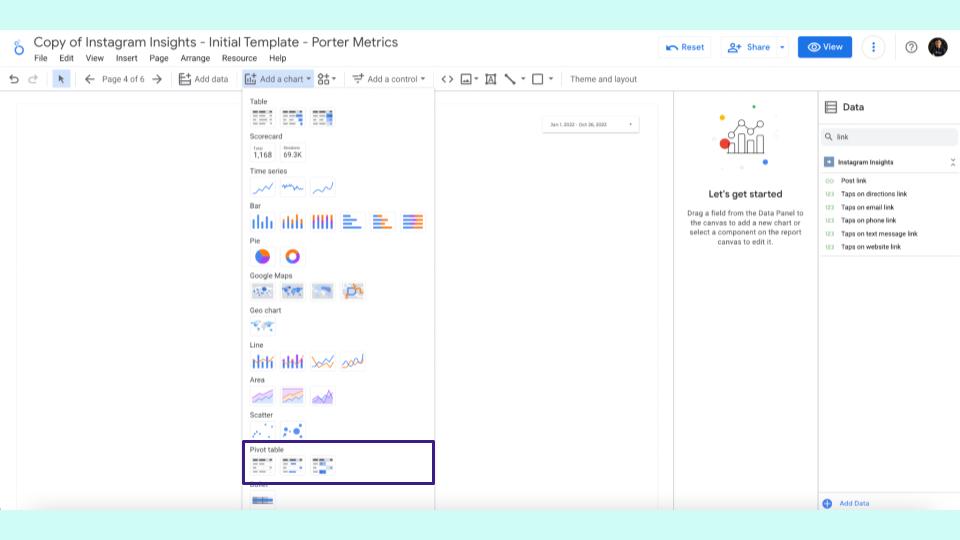
1. Go to a blank report.
2. Click on the Scarab plot.
(Sometimes, Scarab’s plot is too complicated, but if it works for you, you can go ahead and make use of it. If not, you can use the Color plot)
3. Put the chart in Data Studio.
To make it helpful, you can change the metric to make sure that you are using three things; first, post-link because it is unique, and for metrics, you want to use the engagement rate and the post-impression.
4. To determine the time frame/length, add a date range control.
With this, you will have all your posts on Instagram following the time frame you selected in the color plot.
5. How do you make this more helpful?
- Go back to your report.
- Tell the Data Studio to show a reference line and the engagement rate of your posts.
- You will see a line showing your posts’ average engagement rate.
If the engagement rate of your latest post is on the right side, you are doing fine. If it is on the left side, okay if it falls short, the performance could be better.
6. To know the impressions
- Create a new reference line
- Add the average Impressions
To analyze this data, if your post has better than average Impressions and the engagement rate is also better than the average, it is a good-performing post.
That’s how you will identify your best-performing post with this card plot. To spot your best-performing post faster and easier, it is better to use a scatter plot to compare Impressions and engagement rates.
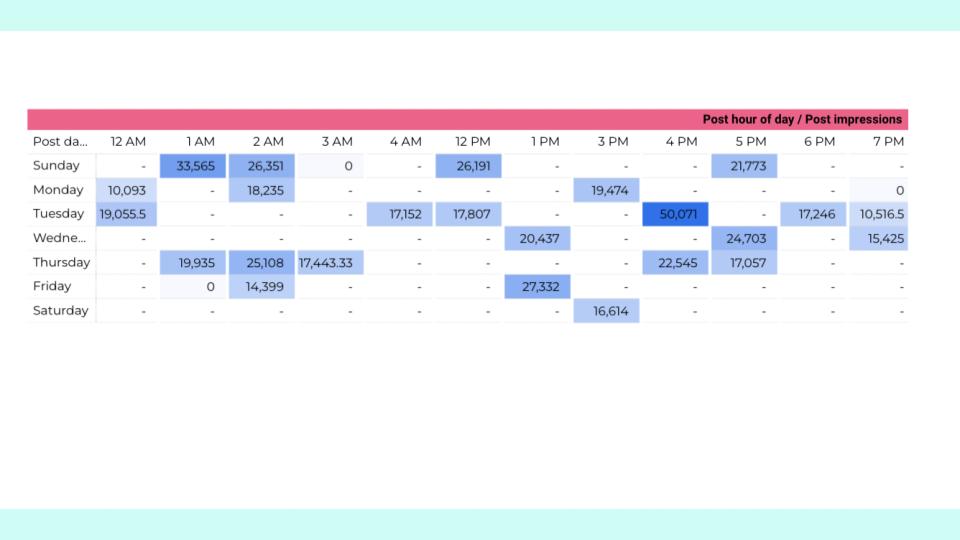
How To Know The Best Time To Post On Social Media
- Go to Data Studio
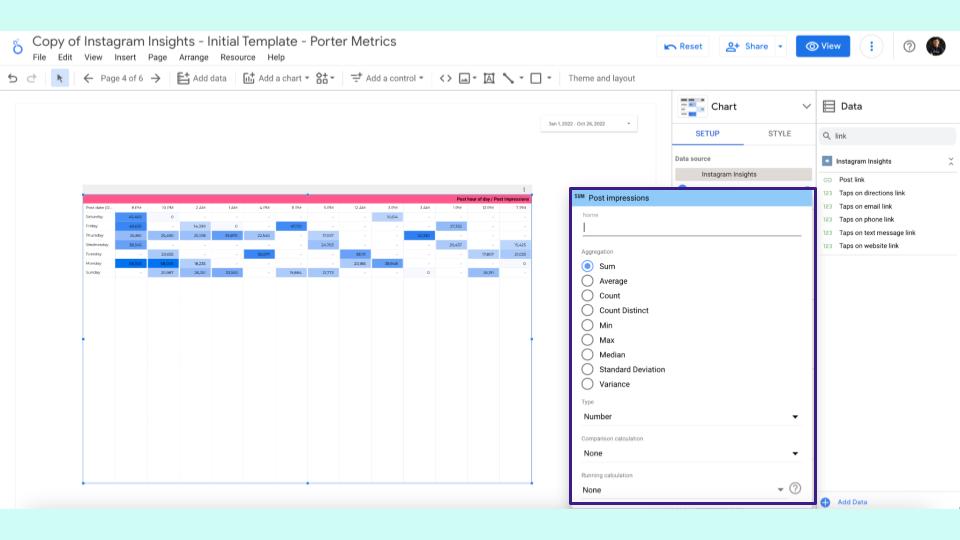
- Create a pivot table that will create something by default, and ensure that you use this data for the row Dimension.
- Use the date for the horizontal values, and for the columns, use the hour of date for your posts.
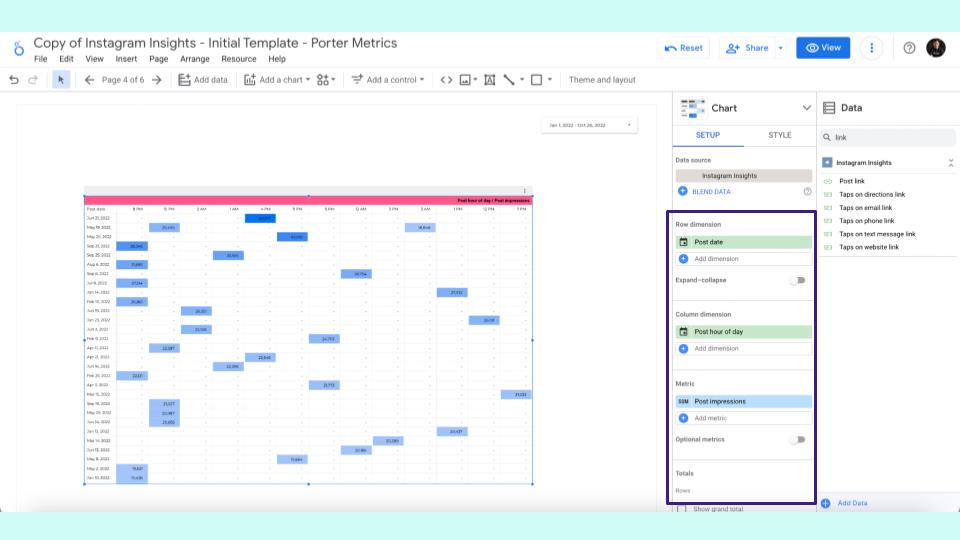
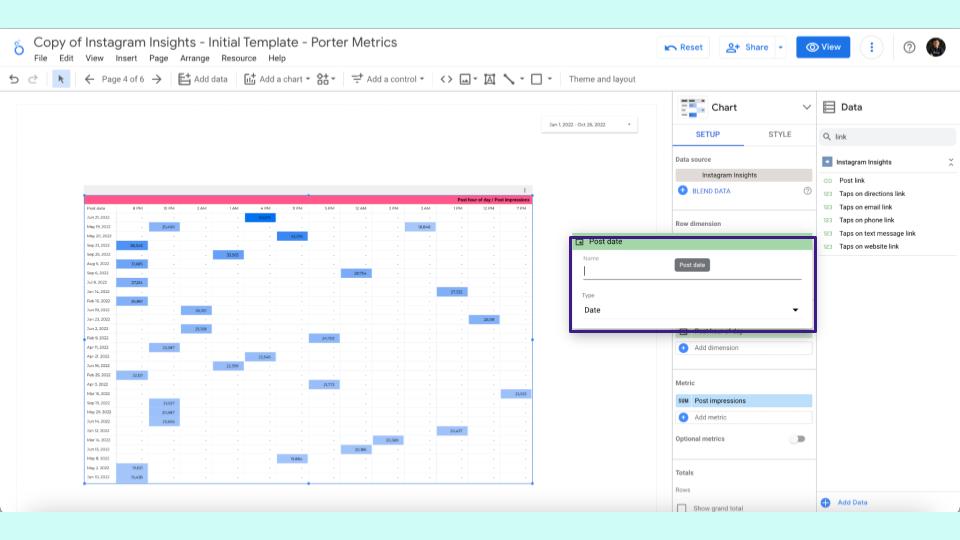
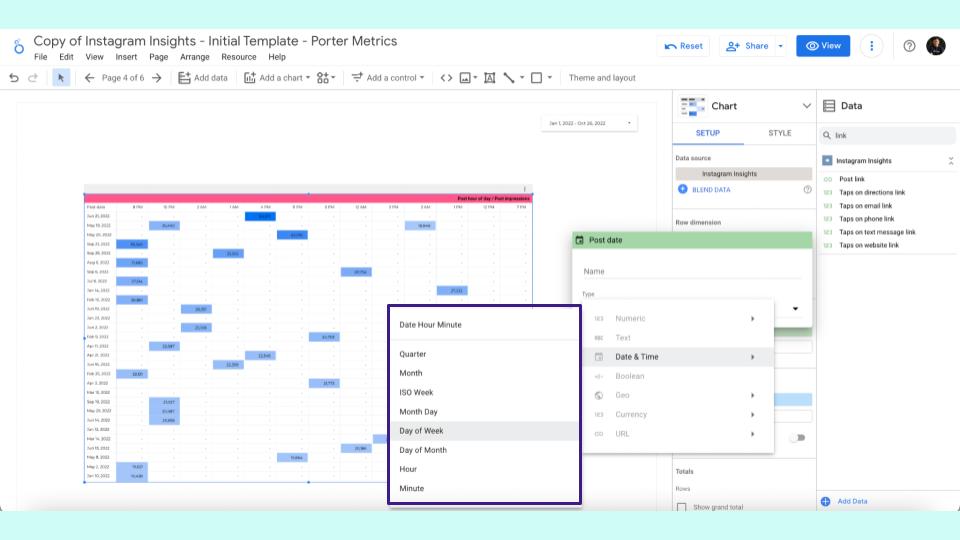
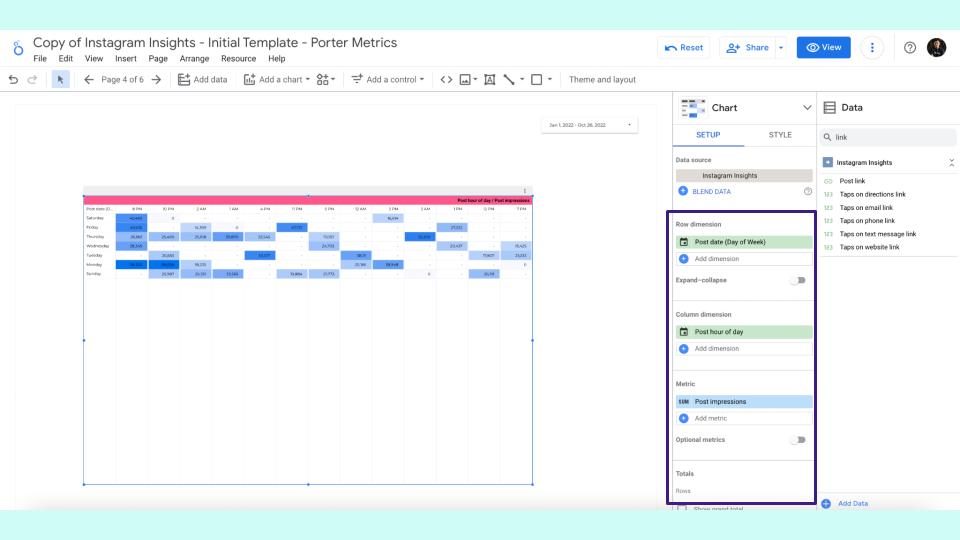
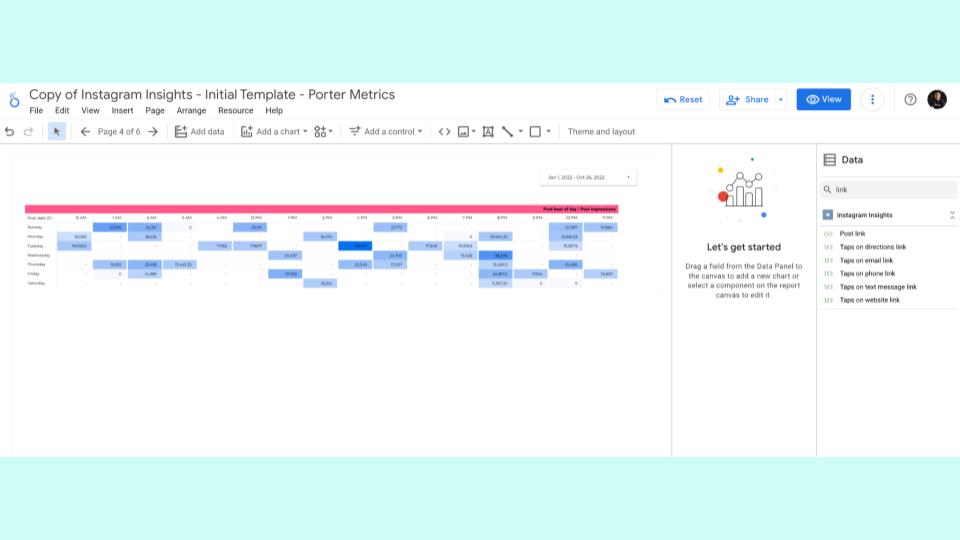
- Transform the post’s date to the day of the week. This will help you see which days of the week are performing better.
4. Conversion
Conversions refer to all the behaviours that represent value to your business. If someone contacts, calls, books a call, or starts a trial at Porter, those behaviors represent value to the business, and that’s why they are called conversions.
How to Measure Conversions with Social Media;
By default, Instagram lets you track actions on your account. You can also track specific behaviors from your Facebook page, Messenger, and Meta.
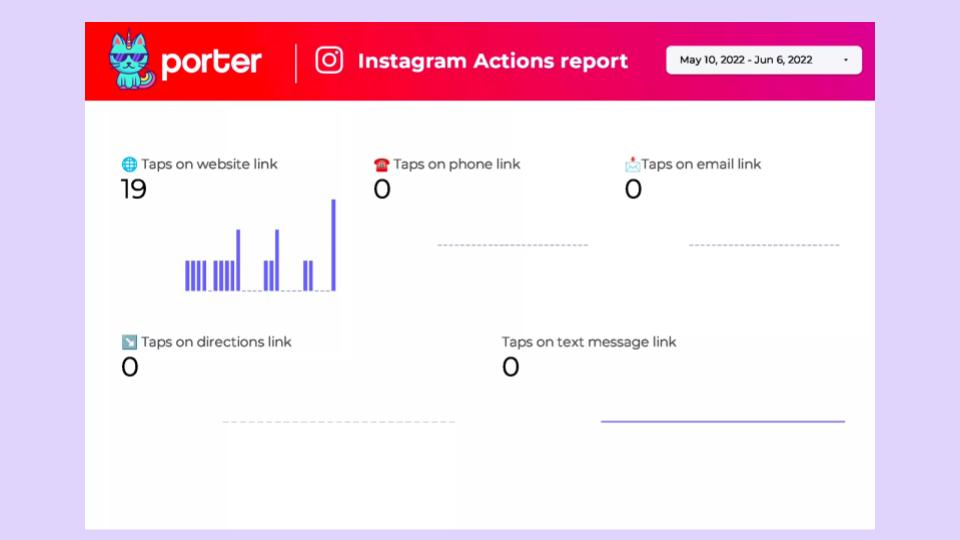
For social media, tracking these behaviors is needed, so how can you attract purchases or conversions on your website?
If you are a marketer called the UTM parameter, the UTM parameter creates a link where you want people to go.
Google will then add some text. You can do this with the tool called The Campaign URL Builder by Google.
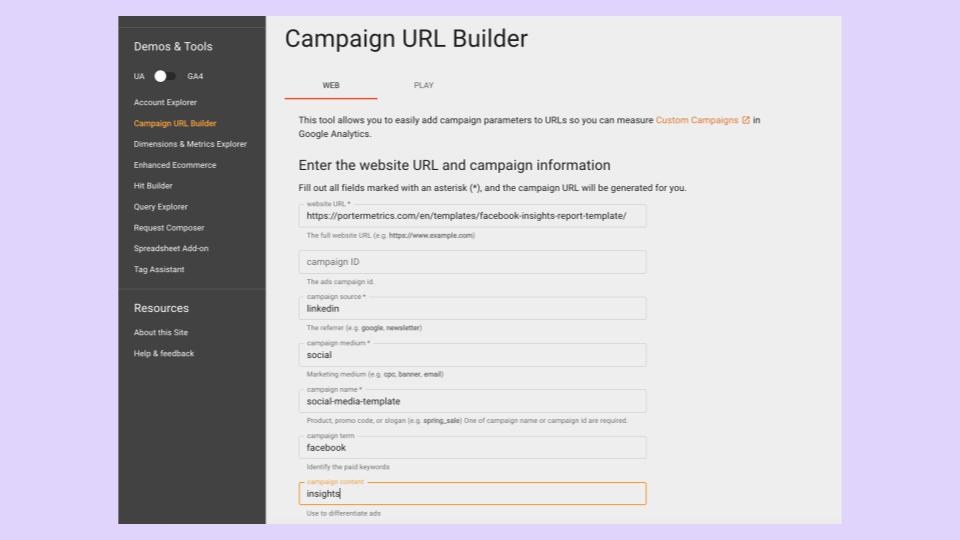
You can create your UTM parameters for your URLs, and you will start sharing them on socials.
When you go to Looker’s studio and use parameters correctly, you can track how many conversions you get from social media on your website.
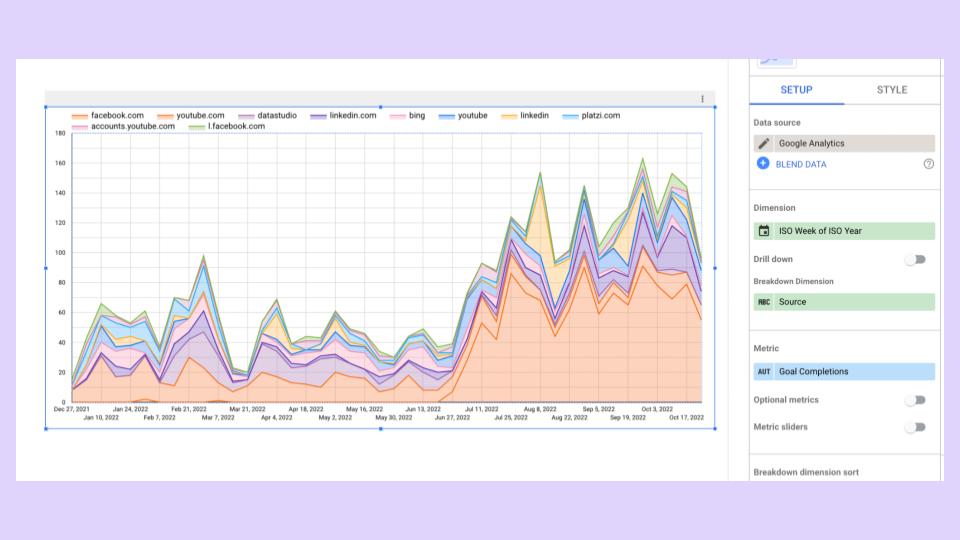
These conversions will, over time, let you know many conversions you are getting from Facebook, YouTube, LinkedIn, and other platforms.
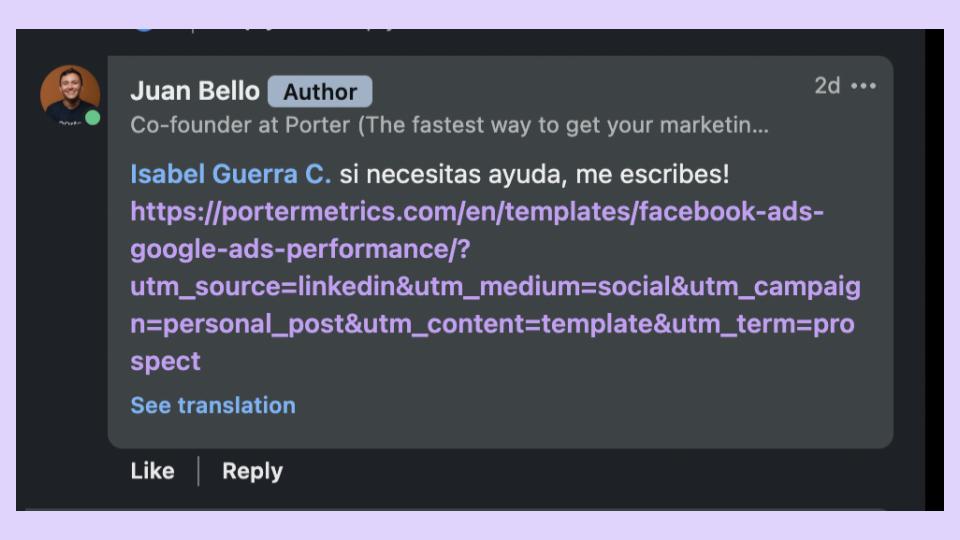
One of the problems with social media platforms is that they don’t encourage you to use links because when people use a link on a post, they leave LinkedIn, Meta, Instagram, etc.
The incentive of LinkedIn is that you stay on LinkedIn. That is why it is recommended that you never share links on your post. You share them in the comments, increasing and boosting your organic posts’ Reach.
Another way to track your social media growth is if many people search for your brand on Google. You can also have calls with customers and send out surveys to know people’s responses to your brand.
5. Productivity
Finally, productivity is an important performance metric. Engagement, Impressions, and engagement rate describes the past and what you have done.
Productivity predicts the future, and you can predict your outcomes when you create a system.
How do you Measure Productivity on Social Media?
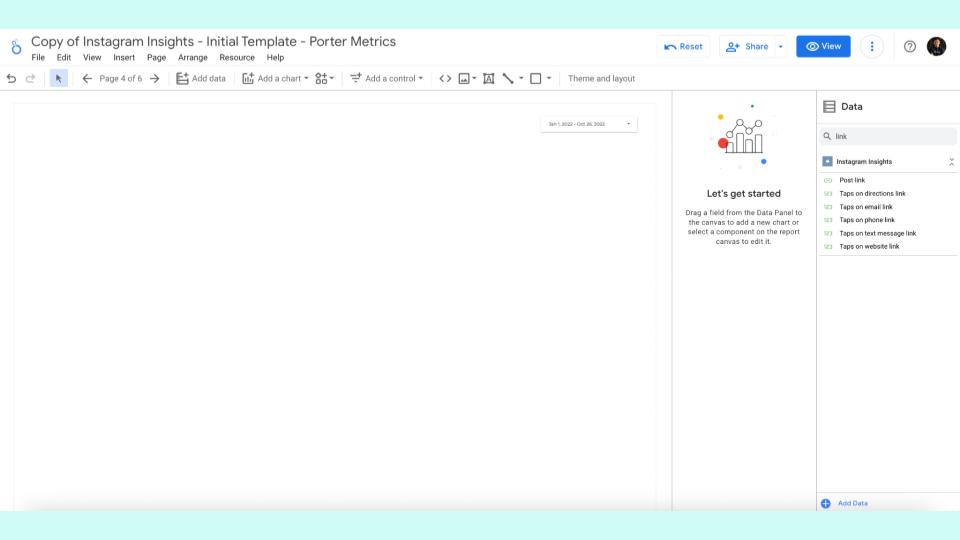
- Go to Data Studio
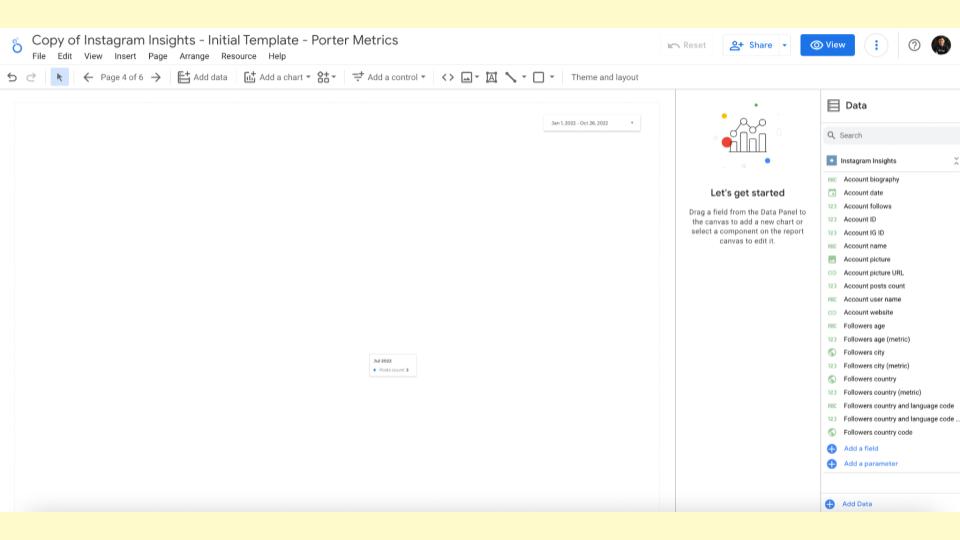
- Create a Time series, and you will see your data by date and as a metric
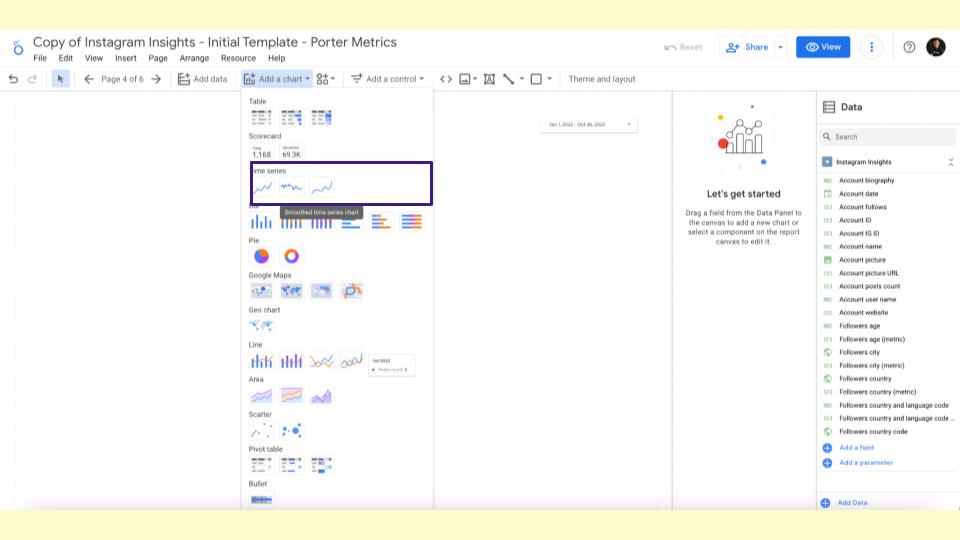
- Take the post link and convert it into metric
- Simply drag and drop the post link
- Data Studio will count how many links you have for a specific date. You can see how many posts you are doing every day, etc.
- Following this, change the date, and instead of the date, you will see by month.
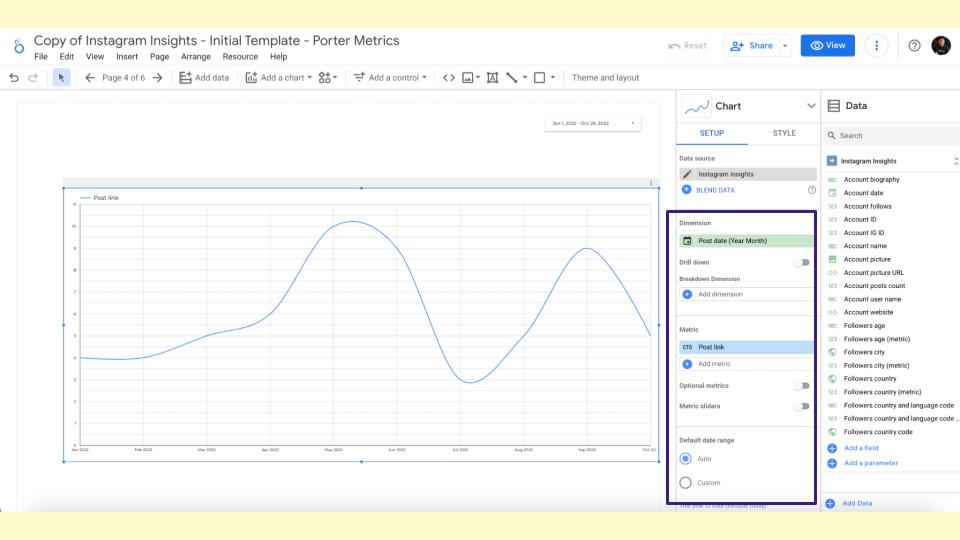
- (This way, you can see which month you publish more)
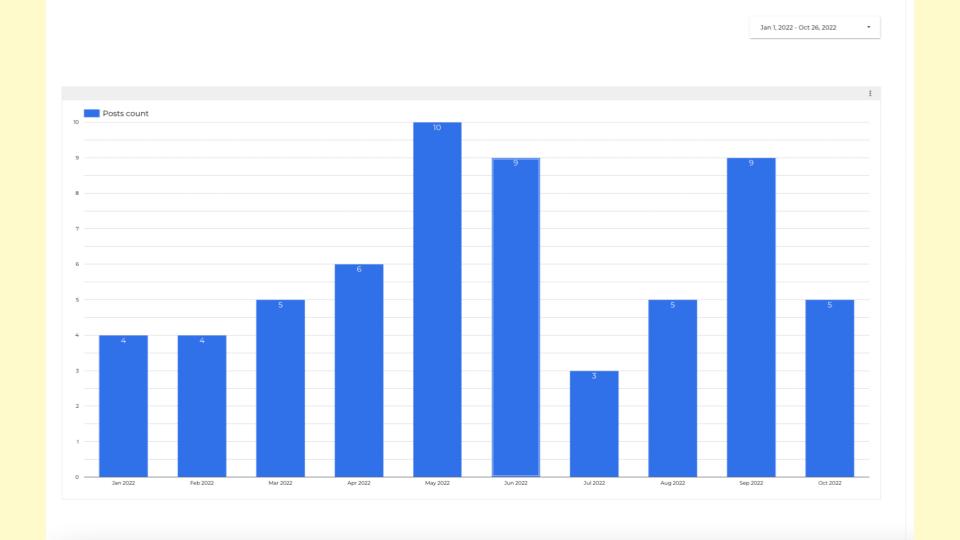
The result is how often you post and at what points you get more engagements and impressions, leading to productivity.
Frequently Asked Questions
Can’t you post the link with the UTM parameters in the caption on the post? Why do you recommend only posting it in the comments?
This is because Facebook and Linkedin don’t have the incentive when you leave LinkedIn, and that’s why when you add a link to your post, it automatically decreases your reach.
When you download a link in your post and encourage people to leave a comment, it will automatically increase the post’s engagement.
Not only that, but it also increases the Reach. Coming to Instagram, the link in your bio doesn’t take you out of the platform.
Instead, when people click on the link, it takes them to a sort of Instagram browser, which is why Meta encourages you because you are still on their platform.
What can you use to create content in bulk tools, strategies, etc.?
Tools to create master content include milk video, wave video, and lumen5.
Is it better to post a lot and wait to hit it with the content or post less and analyze it?
Consistency beats analysis. If you hit many times, some of your posts will do it, and creating the behaviour of publishing every day is hard, and most people won’t do it.
Your competitors publish only a few times a week. If you create a behaviour of publishing every day even though you are risking your reach, that behaviour will lead to a better outcome. The essential thing in content marketing is consistency.
What is the planning strategy for content on LinkedIn, and what are the success metrics?
Success on LinkedIn means more Impressions, engagements, and comments on your posts.
You can know that you are delivering these Impressions and comments and are reaching people in marketing agencies, tech companies, etc.
Hence, a strategy for LinkedIn is publishing every day. That’s the most important thing. You can constantly share reports, templates, and tutorials and split this content with personal thoughts.