This guide will teach you how to automate your Shopify sales reports using a free platform such as Google Data Studio. Discover the metrics you need to track to optimize your marketing strategies.
After reading this guide, you will understand the types of reports you can automate, schedule, and share. No code skills are required, and we’ll provide you with a template to automate your Shopify reporting in seconds.
Why Does Shopify Reporting Matter?
Shopify is the cloud-based and hosted leading e-commerce platform that allows merchants to sell products on multiple platforms such as websites, apps, physical stores, and social networks bot, globally and locally.
Shopify reporting matters because it integrates the most important data for e-commerce. Not only focusing on sales but on customers.
With Shopify, you can create a marketplace in seconds, place your products on different platforms and use different resources such as templates to create an appealing store without too much effort.
Reporting sales is only a small part of your results to be considered when running a business. Imagine all your efforts tracked and analyzed in only one place.
While we already offer ads and social media reporting, the end result and most critical KPIs rely on Shopify.
At Porter Metrics, we know what it means for marketers, business owners, and merchants to find affordable tools to integrate multiple data sources and finally relieve huge pain with report automation.
In other words, If you are a Shopify user, you will love your reporting with Porter.
How to Understand Shopify Metrics?
Before creating a report, you must be familiar with the metrics included in your Shopify plan.
The reports you create need to be aligned with the strategy and a clear objective, sales. Which means conversions.
With that said, finding a tool that allows you to track the metrics you need as a marketer or business owner is important.
Choosing a Shopify Reporting Tool
In the market, you will find a million and one third-party reporting tools often used by eCommerce brands on Shopify to track and report on data.
The challenge, however, is that most of these third-party reporting tools are yet to develop perfect connections and templates that generate errorless reports when linked with eCommerce platforms such as Shopify or Google Properties such as Google Analytics, Sheets, and Data Studio.
Existing cases show that reports from these tools are error-prone with glitches and crashes and are often misleading, especially around attribution and measurements that are important to the key business data you need to scale your business.
Most recently, there have been complaints around user analysis paralysis caused by the fact that most non-technical Shopify users are unable to understand nor make sense of the important technical metrics and dimensions they see while generating reports.
Some have also complained about their inability to get specific metrics such as LifeTime Value (LTV), Monthly Recurring Revenue (MRR), and Cohort Reports.
These problems were issues that the Porter Metrics Shopify reporting tool needed to address as soon as possible to ensure that both technical and non-technical Shopify users can easily connect their data, generate simple reports that they understand and can explain in clear terms to fellow business partners, clients and investors as quickly as possible.
Porter Metric offers you a friendly, error-free, easy-to-use, and non-technical interface that grants you access to more metrics and dimensions for understanding your business data than you can.
Aside from these beautiful benefits, you need someone you can quickly turn to if you require real-time support.
Porter Metric stands out from the competition because we offer you more than enough support – we even generate reports for you at your request.
This is why you need Porter Metrics’ Shopify reporting tool in your toolbox.
Shopify reporting
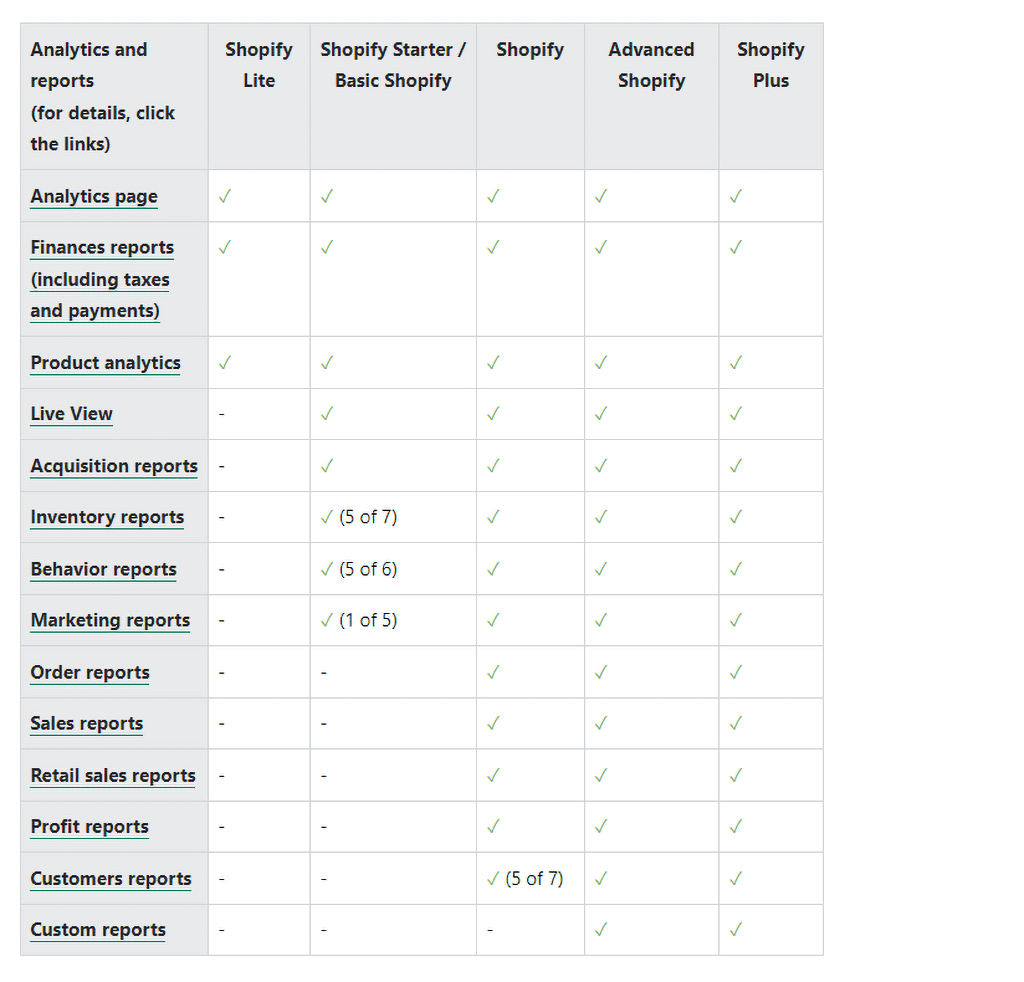
Reports on Shopify are subdivided into chunks or groups based on your subscription plan. This means that you are only able to access important business data when you get the advanced subscription plan.
Key reports such as live view, acquisition report, inventory reports, behavior report, marketing report, sales and order reports, and customer and custom reports are not included in the basic packages but are available as you ascend the subscription plan.
Shopify Analytics vs. Google Analytics :
Shopify Analytics provides a very crisp interface any business owner needs to access, generate and interpret reports.
While its first two basic packages are limited in features, the Shopify Plus, the most advanced/ premium plan, offers automatic tracking where you’ll be able to monitor the progress of your Shopify store.
To access these reports, you’ll need to open your Shopify dashboard and pick Analytics in the left column. You’ll be able to access three Submenus on these dashboards: Dashboards, Reports, and Live View.
Under the dashboard menu item, you’ll be able to see total sales, view the total number of visits to your store, access data for returning customers, and see online store conversion rate, average order value, and total orders.
Under Reports which is the second submenu item, you’ll be able to see general sales trends, Acquisition, Customers, Profit Margin, Finances, Behavior, Marketing,
Finally, the third sub-menu – Live View- gives you access to live activities in your online store. This interface allows you to see live visitors, today’s total orders, current user behaviour in your store, and real-time pageviews.
This feature is a pretty sleek and useful feature for those managers who are obsessed with their businesses and often like to keep tabs on their store’s progress on the go.
Google Analytics on the other hand provides more comprehensive information for free. With Google Analytics, merchants can do the following:
- Monitor the number of sessions/purchases and unique sessions/purchases
- Calculate customer lifetime value (LTV)
- Access in-depth acquisition reports — analyze campaign performance, referrals, etc.
- Segment by user type to evaluate visitors (and potential ROI of retargeting them)
- Run conversion rate optimization (CRO) tests
- Inspect and optimize checkout funnel drop-offs
- Identify landing pages that generate the most revenue
- Monitor your target keywords and optimize your store messaging accordingly
- Use custom segments to see the difference in revenue between search terms
With Google Analytics, the possibilities are endless. Beyond tracking site visitors, sessions, and other customer behavior on your store, Google Analytics provides you with a holistic picture of your store’s performance which you can visualize on a breath-taking dashboard.
The Enhanced Ecommerce GA reporting plugin provides even more useful data about customer behavior before a purchase occurs on your website.
This advanced yet free feature in google analytics offers you a full-funnel picture of the buying journey for your prospects. Every stage is monitored — from item list view to checkouts/purchases and even refunds.
Enhanced Ecommerce handles almost everything including customer behavior before, during, and after a purchase.
It provides comprehensive reports on average order value, add to cart, average order size, affiliate data records (number of transactions, affiliate revenue, etc.), and Cart abandonment.
Google Analytics Enhanced Ecommerce tracking also monitors customer turnover and customer engagement, including product views and purchases and coupon and discount reporting.
The beautiful thing about Google Analytics is that you can compare data between two related domains with a few minor JavaScript and HTML adjustments.
Discrepancies between Shopify and Google Analytics
On the surface, Shopify offers all of these data on a platter of gold to help you monitor and scale your businesses.
However, the reverse is the case, as this useful information can only be fully accessed when you subscribe to their highest plan.
So here are a few reasons why you may not want to rely on Shopify’s Analytics to make business decisions totally.
- Shopify Analytics for Ever. Aside from segmenting access to valuable data and putting a premium on each plan to access key business data, you’ll most likely lose business data and be stuck if at some point you decide to migrate to another shopping provider as Shopify does not provide any support of this nature..
- Your Subscription Plan Determines How Much Data You Get. As earlier discussed, your plan truly determines how much useful business data you get from Shopify analytics to grow your business. If you subscribe to the basic Shopify plan, you’ll have to settle for the most basic sales reports (consisting of only top-level data) or upgrade to the $79 per month for standard Shopify reports. Only Shopify Plus (enterprise) members have access to complete, comprehensive reports.
- No support for cross-domain tracking. Shopify does not provide native support for instances where you’ll need to compare data between two related domains,
While Shopify Analytics has its advantages, none matches the level of detail and customization potential you’ll get from Google Analytics. For these reasons, we recommend that all Shopify users install Google Analytics within their store and use it alongside Shopify’s own analytics tools.
The good news is that Shopify makes it easy to install Google Analytics, and with Google Analytics, you can track the following data:
Know Your True Conversion Rate
Google Analytics allows you to view conversions based on certain defining and dividing metrics and dimensions you’d like to see.
Your conversion rate is measured by the percentage of visitors who complete the desired action (product purchase, form fills, newsletter subscription, etc…).
Shopify Analytics on the other hand offers limited flexibility and features to help you further break down your conversion data so you can attribute conversions properly.
Access The Lifetime Value (LTV) Of Your Customers
Lifetime Value (LTV), or Customer Lifetime Value (CLV), outlines the financial value of customers accessing your store via different channels. LTV is a measure of your average customer’s spending within a set timeframe.
It remains one of the most vital metrics that has eluded Shopify Analytics. However, Google Analytics, on the other hand, has been known to track this valuable metric easily.
Be Able To Track Total Sessions vs. Unique Sessions
Shopify offers you total pageviews metrics, whereas Google Analytics gives your business accurate information by distinguishing regular and unique pageviews.
Access Real-Time Reporting
With Shopify’s Live View Interface, you can monitor four key metrics in real time: visitors, daily totals, page views, and shopping cart behaviour.
But Google Analytics Realtime report takes things much further, giving you real-time access to:
- The number of visitors to your site
- Where your current visitors are located
- Keywords that referred your current organic visitors
- The specific pages being viewed (and the percentage of active users on each page)
- Real-time conversions
- The percentage of desktop vs. mobile visitors at any given time
- The percentage of organic vs. direct visitors at any given time
- The number of Google Analytics goals being fulfilled right now (such as the opening of a discount code link or the completion of a form)
Enjoy Seamless Integration With Other Marketing Tools
Google Analytics can quickly be integrated with other marketing tools such as Google Search, Google Data Studio, Google Console, Google Ads, Google Optimize, as well as other third-party market integration tools.
Advanced Ecommerce Goals Tracking
Google Analytic’s ability to set and track customized goals remains a unique feature that sets GA apart from Shopify Analytics.
Setting up eCommerce goals in Google Analytics is really the ultimate way to measure your true conversion rate.
Shopify’s Analytics interface doesn’t come close to matching the competitive benefits of Google Analytics sophisticated toolset, which includes:
- Detailed information on customer behavior before, during, and after a purchase.
- Comprehensive cart abandonment and bounce rate data—e.g., At what point in the sales funnel are potential customers walking away?
- Complete product performance data—e.g. Which products are attracting the most views, and are those views translating to sales?
- Detailed reports on the success of your discounts and promotions.
- Google Analytics reports to better track traffic.
Emily Imhoff of Topfloortech recommends five key report formats best for tracking traffic and conversions. Asides from the standard GA reports, namely audience reports, acquisition reports, behavior reports, and conversion reports, there are a thousand and one other reports that are key to understanding and tracking your traffic.
- Mobile Overview Report
In an age of mobile connectivity in which more than 90% of the world’s population is accessing the internet via mobile, Emily proposes that a marketing manager needs a mobile overview report to better understand the user experience on mobile and how optimization can be achieved to gain more mobile traffic.
Channels Report
Understanding your channel report is key to growing and scaling profitable types of traffic.
When you understand where your converting traffic comes from, it is easy to tell your team what works and what you must scale on.
Most importantly, you want to be able to monitor their movement through your funnel.
At a glance, you should be able to tell how many users you’ve had, how long they stayed on your page, and if they converted to your site based on goal tracking.
These are essential numbers you need to know to optimize your channels.
Navigation Summary
Google Analytics provides the navigation summary report to help you view the most common paths users follow to get to certain pages or URLs on your store.
Interestingly, this report also highlights where your audience comes from and where they leave after browsing your store.
A core benefit of this report is that it hints at what your audience may be searching for so you can rework those pages or your services to include things they’ll need on their next visit.
Landing Pages Report
The landing pages report gives you a solid breakdown of your top-performing landing pages and how many goal conversions are secured from the first page a user lands.
As a marketing expert, you’ll be able to access the number of people who arrive on your page, how many of that number engage and how many bounces off almost immediately.
The next report worth looking at is the Landing Pages report. This is the report to check out if you want to see what page is most often landed on and where users are coming from.
Information such as how many goal conversions are gained from the first page a user lands on can be collected from this report.
You can also see how many people land on your page and interact with your site versus those who leave right away.
If a lot of users are leaving a certain page right away, you may want to make that page more engaging or lower page load time to increase retention.
Goal Overview Report
A key report to keep handy is the goal overview report. Essentially, this is the most important conversion-related report you never want to miss tracking.
You can set up specific interactions, such as form submissions and downloads, to track as goals. When a user converts, your company has a qualified lead that is more likely to complete a purchase.
The report gives you a detailed breakdown of the pages driving conversions and the channels they come from. With these customizations comes the ability to compare recent data to historical data.
This way, they can quickly pin down a target to be achieved and an objective to quickly hit. Google Analytics reports will help you learn about areas like your mobile website’s performance.
GA will furnish you with information on where your audience is coming from, goals that have been met, and the top pages leading the conversions.
Google Analytics does more which is why you want to combine your Shopify Analytics with Google Analytics to gain as much insight as you can to scale your business.
Using Porter Metrics reporting tool
You may have been reading this article for some minutes while wondering what reporting tool could best get you results with little to no hassle or inconvenience.
Porter Metrics Reporting tool is the no-code data reporting tool marketers have used to generate beautiful conversion-focused reports.
Get a free custom report, or Schedule a call here if you want us to generate your first few amazing reports.
Interestingly, the Porter Metrics team has made it so that you can do it yourself once you land on the website. It’s easy as ABC.
With Porter Metrics, you’ll be able to set up without needing codes, developers or analysts. We make it even more interesting, so you can access and visualize your reports within the tools you are already familiar with.
Tools such as Google Studio, Google Sheets, Analytic, and the likes. That’s not all. You’ll be able to access an entire bank of beautiful templates you’ll use to create convincing reports your clients and investors can’t resist.
Export Shopify Data to Google Sheets and Google Drive
The beautiful thing about working with the Google family of properties is that they are free and easy to use and integrate with third-party applications.
In this case, we intend to send data (order report)from Shopify to Google Sheets. So here’s how to get it done quickly.
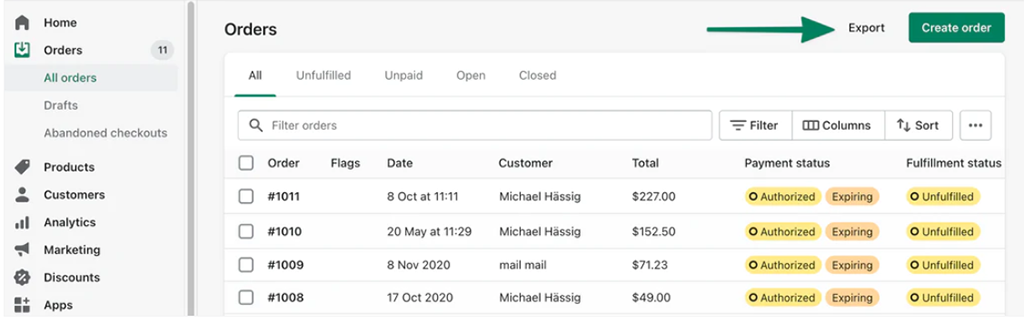
Shopify allows you to export orders as a CSV file. In your Shopify Admin, navigate to the Orders View. Click on export to download the selected orders.
After downloading this order report, you can choose to go directly to Google Sheets. Click On Blank and Create a new Spreadsheet. Then click on File and select Import under File.
Within the Import file interface, select the Upload tab. Then drag and drop the Shopify CSV file earlier downloaded.
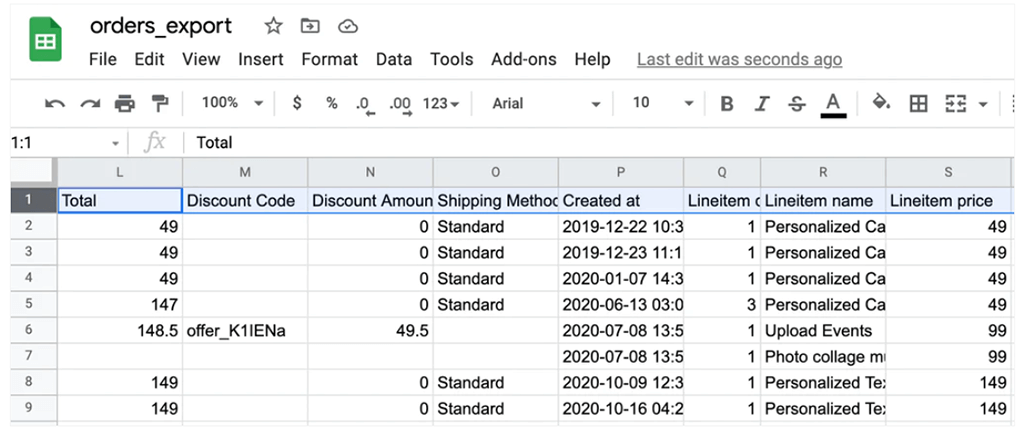
Then click on select and match the data type per column before you proceed. Once done, your order report should be populating Google Sheets rows and columns.
Or
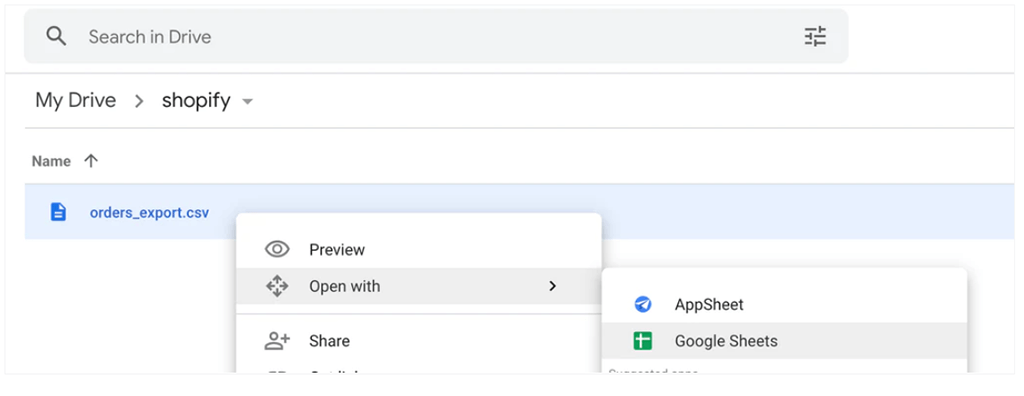
You can alternatively get the exported file onto your Google Drive by uploading the file yourself. You can then open the uploaded file in Google sheets using Right-click > “Open with” > “Google sheets”:
The order export column format is fixed and cannot be changed. If some order information is missing, there are currently no options to add additional columns.
Connect your Shopify Data to Google Data Studio
Before you can export data to Google Studio from Shopify, you need to have connected both interfaces. Porter metrics provides the easiest and fastest way to connect your Shopify Analytics to Google Data Studio.
With over 5+ starters and 80+ data visualization templates waiting for you, you can’t go wrong with this one. Via Porter’s connector, you can access data for customers, orders, cancellations, taxes, sales, margins, inventory, and more.
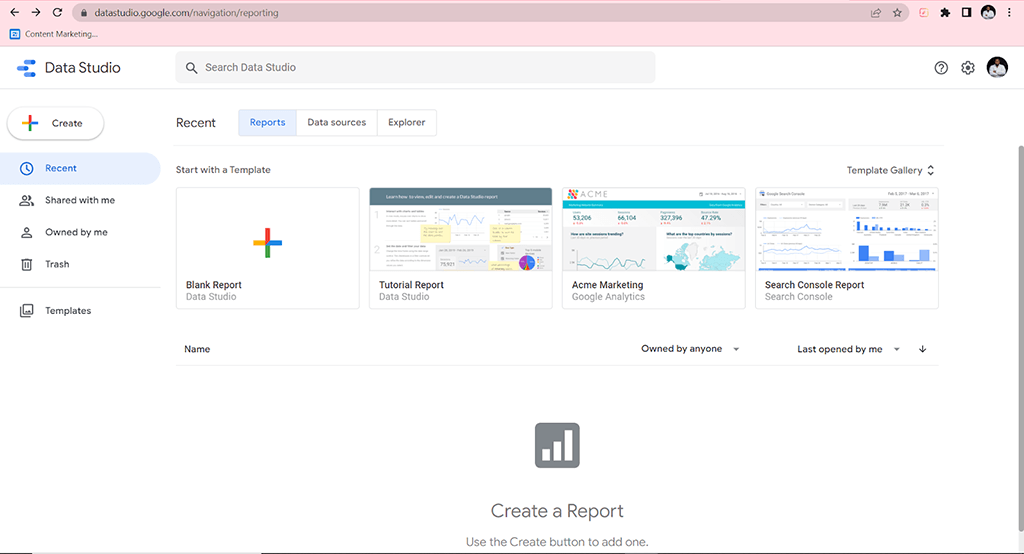
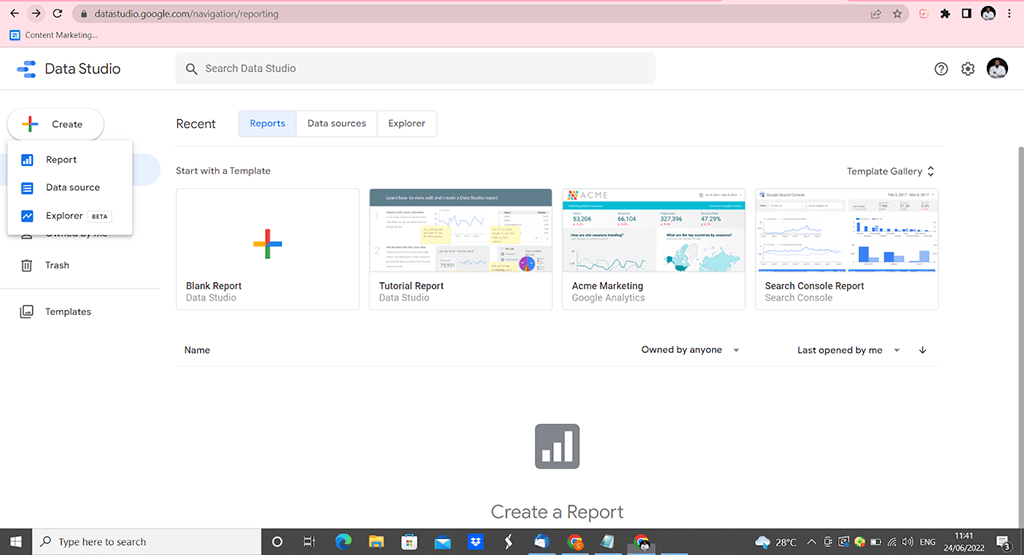
Step 1: Visit Google Studio and Click on Create
Step 2: Click on Create and Select Data Source
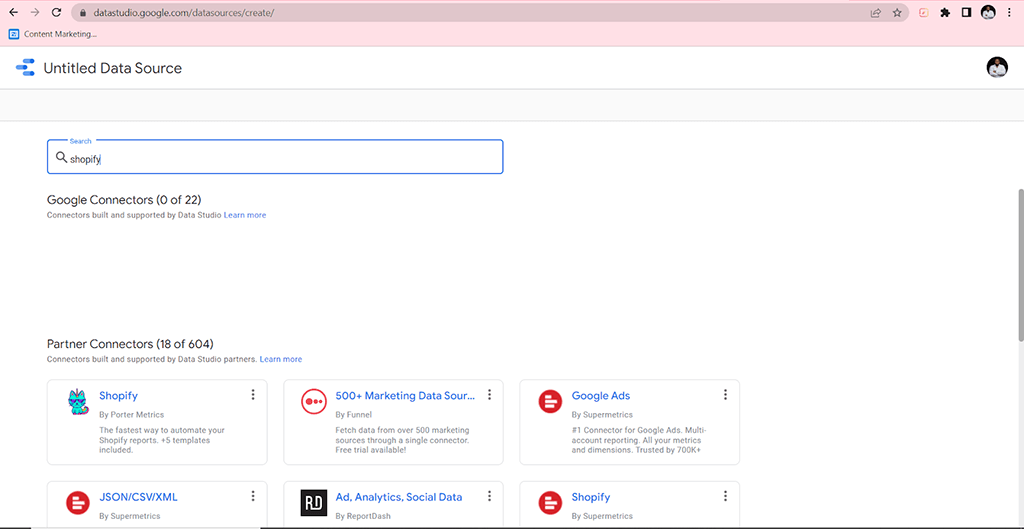
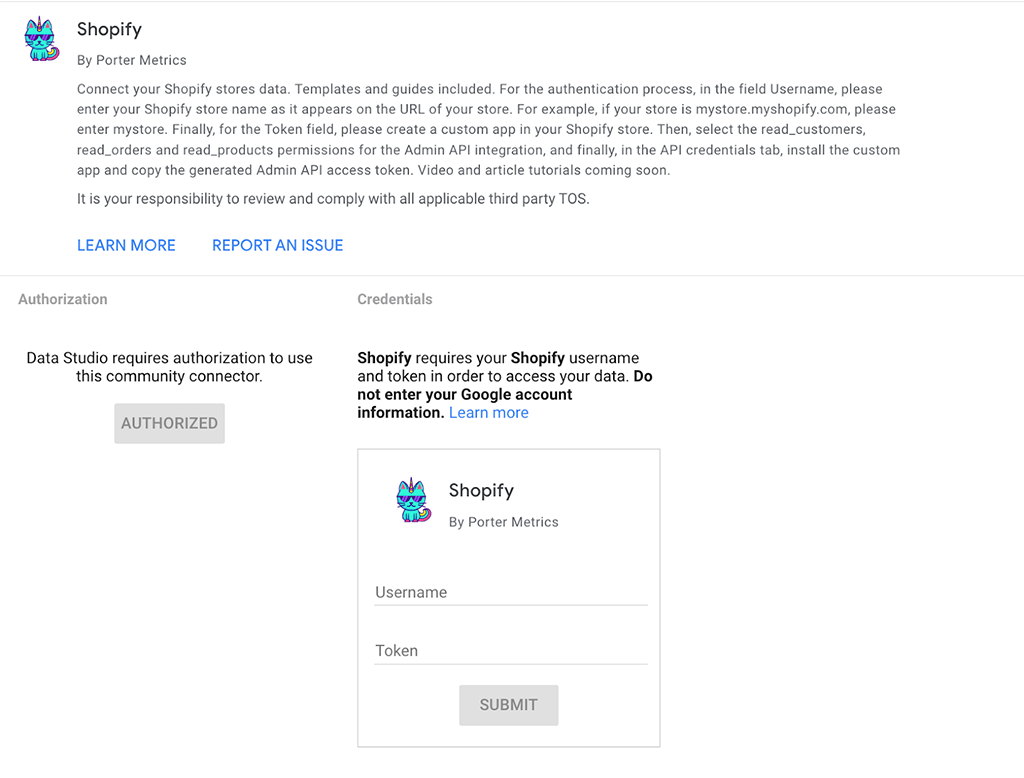
Step 3: On The Untitled Data Source Interface, Type Shopify and Select Shopify By Porter Metrics
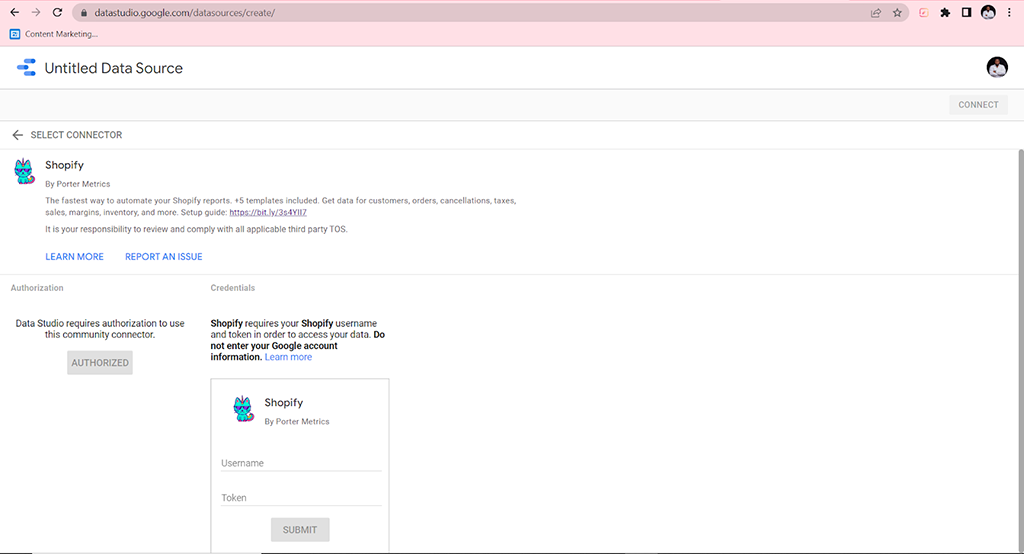
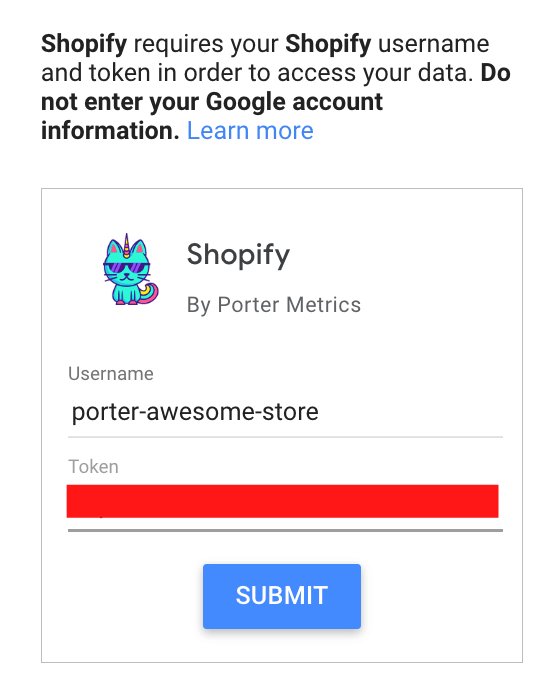
Step 4: Select authorization, allow access and input your Shopify credentials
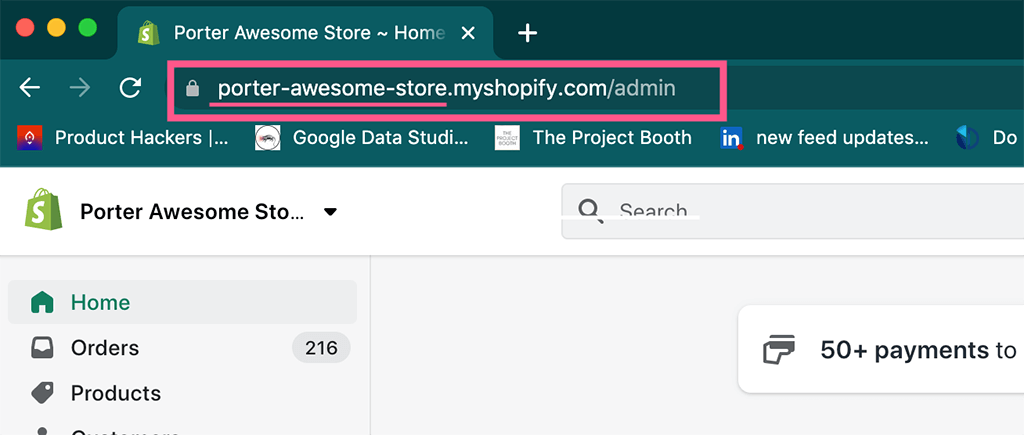
The username refers to the subdomain of the Shopify URL you use to access your store administrator. You can find it by logging in to your
store administrator. You can find it by logging in to your Shopify store account.
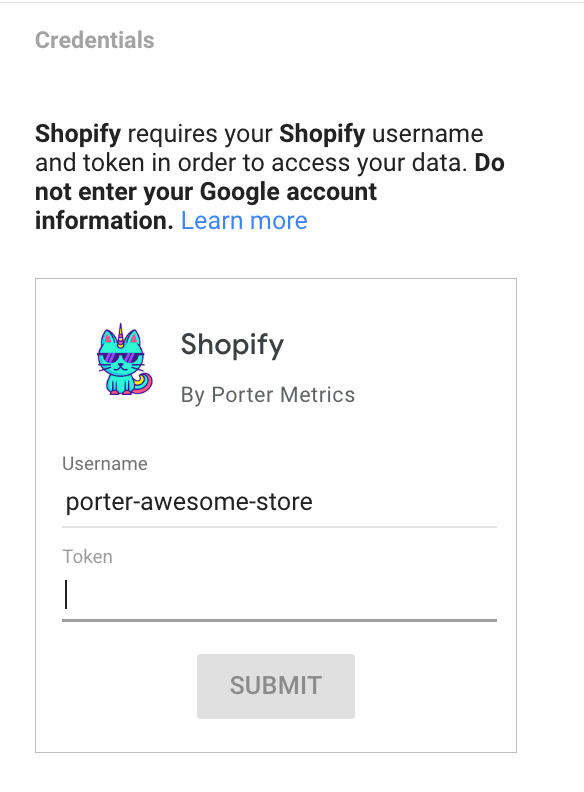
For instance, if the URL you use is https://porter-awesome-store.myshopify.com/, you’ll copy “porter-awesome-store,” as shown on this image.

When you are done inputting your Shopify username, it should look like this.
Step 5: Now Input your Token.
Follow the link to find and input your token
Step 6: Using the Token

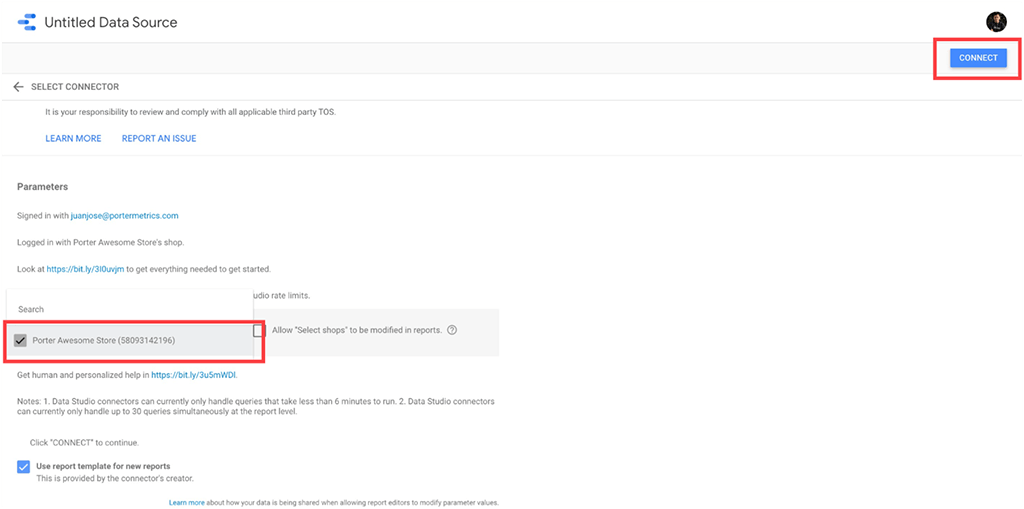
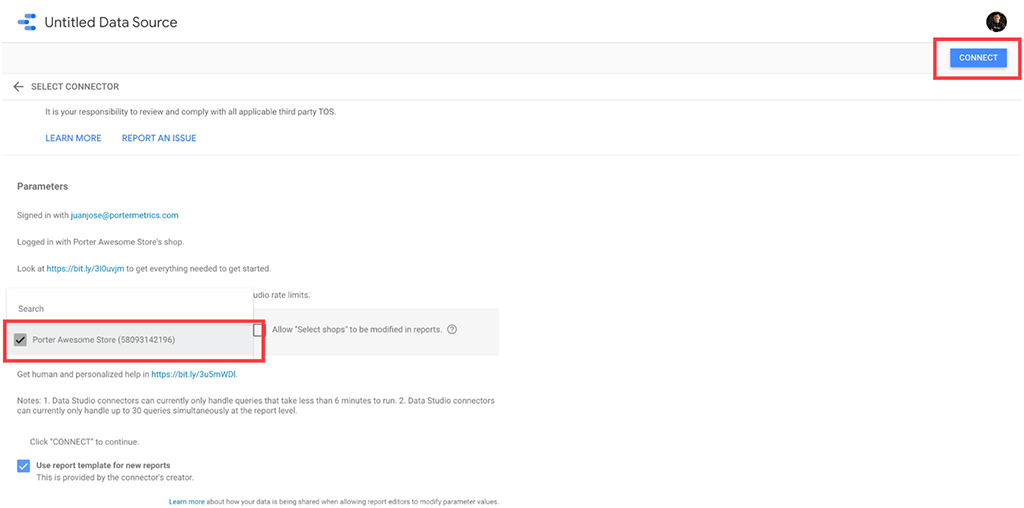
Step 7: Select the Shopify Store you’d like to Connect to Google Data Studio and Click On Connect.
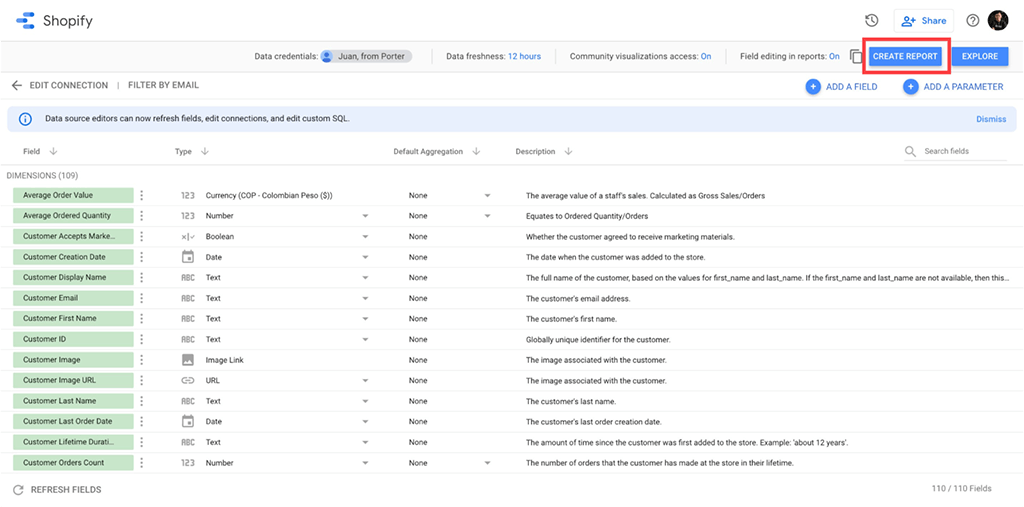
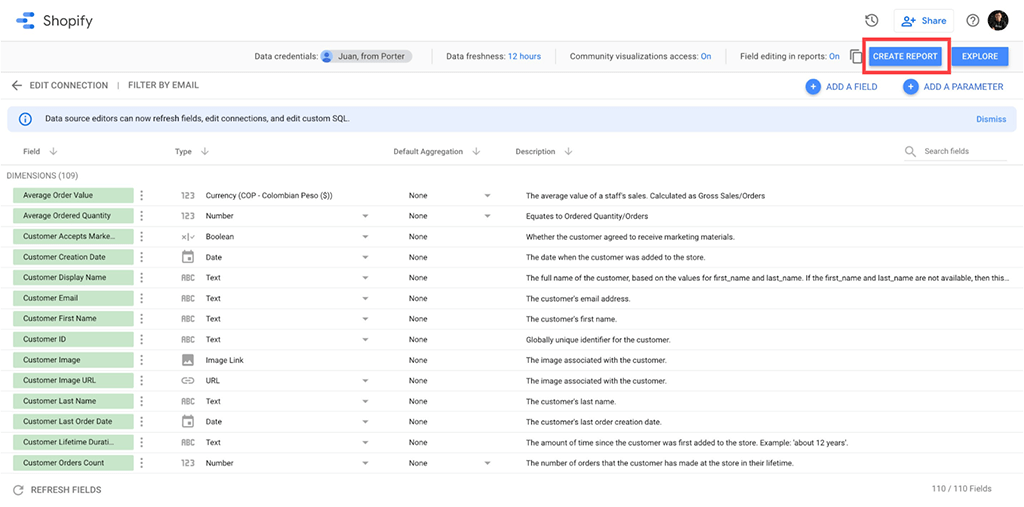
Step 8: Now, you’ll see all the Shopify fields available on Porter Metric’s connector. Click on create a report.
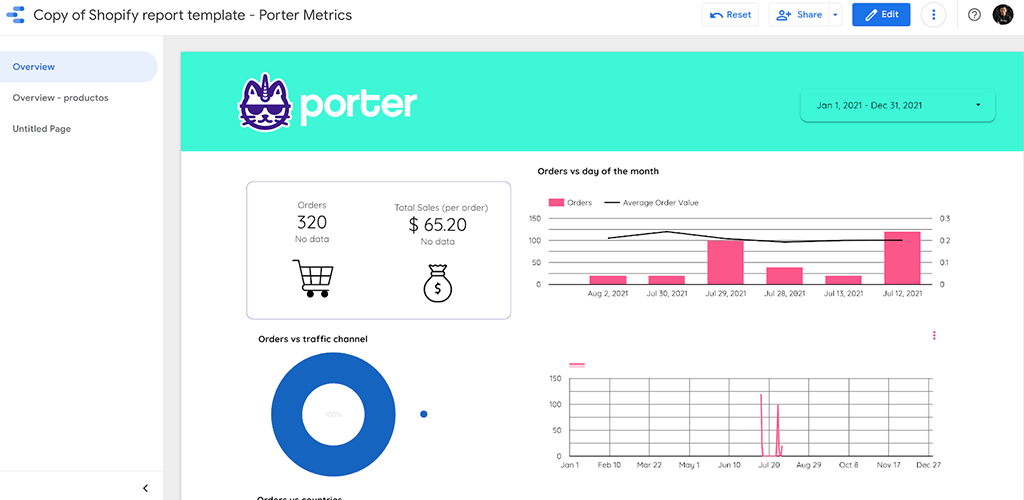
Step 9: You’ll get a default report template with Shopify data that you can fully customize!
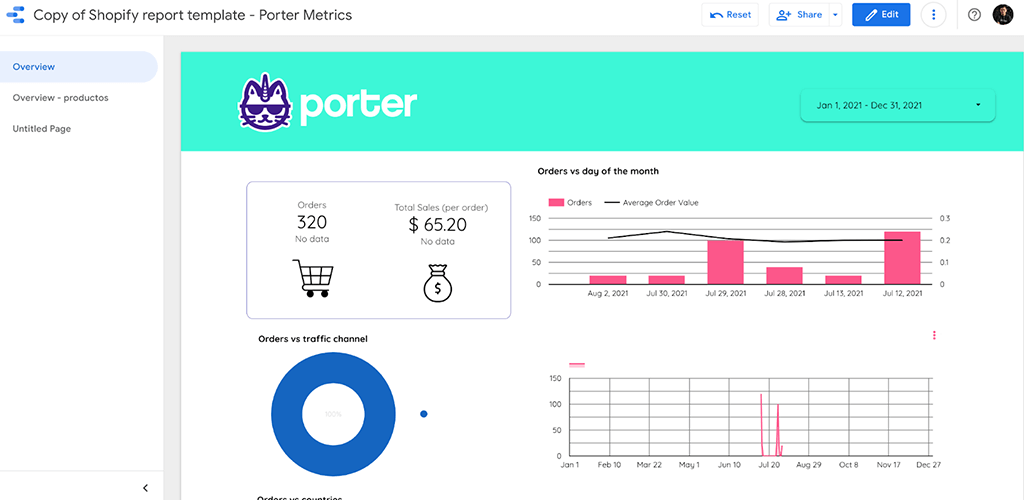
….. And voila, you have your first Porter Metrics visualized report.
Don’t hesitate to schedule a free report setup or chat with us if you need additional help with this setup.
Shopify reporting API
As of April of 2022, some more features have been added, while some have been better designed to help you improve the quality of your apps while streamlining your development experience.
Shopify’s latest API includes the all-new customer segmentation API and advanced visibility into Product Taxonomy.
It includes the latest features you’ll need to track fulfillment with fulfillment and delivery time data. If you were hoping that the new interface would feature a lot more, then you thought right.
April 2022’s edition features new interfaces for offering discounts using the App subscription API and includes updates to the Storefront API that will enable delivery quotes from the cart API.
For a full list of API changes associated with this version, visit the 2022-04 release notes.
Remember to check your Shopify API health report to ensure that your system is up to date and all-around compatible. Here’s another link to get a detailed breakdown of the updated features.
Types and categories of Shopify Report
Shopify Acquisition Reports
Acquisition reports display information about how visitors get to your online store. Your acquisition report includes the following:
- Sessions over time
- Sessions by referrer
- Sessions by location.
Shopify Behavior Reports
Behavior reports on Shopify allow you to understand your customers’ shopping behavior.
It also provides a detailed breakdown of actions your visitors take on your store while offering various insights that can help you create better promotional bundles.
Behavior reports can provide a ton of useful information, including online store conversion over time, online store speed, product recommendation conversions over time, top online store searches, top online store searches with no results, sessions by landing page, sessions by the device, as well as online store cart analysis.
Mastering information around the ways that visitors behave and engage with your store will help you make informed business decisions, including precise marketing channels to focus on.
These decisions will include planning your inventory, deciding on product choice as well as the organization of product collections.
Shopify Marketing Reports
You can use the marketing reports to see how effective your marketing is and to learn about your conversions. This report summarizes information from all online store channel orders.
It ranks top-performing marketing channels as well as the ones bringing in the highest number of customers and the clients with the highest value.
Shopify Marketing report data provides you extra confidence to make informed decisions about activities to optimize to grow your store.
The marketing reports help you as the manager or marketer visualize what brings shoppers to your online store and what persuades them to purchase.
Shopify Finances Reports
Shopify finance reports furnish you with data about your store’s financial performance during a selected date range. You can quickly access this interface by clicking the Finances section of the Reports page.
From here, you’ll be able to open the Finances summary page. From the Finances summary page, you can access detailed reports.
When you open a finance report, the data is often up-to-date. You’ll need to refresh and select a date range to show newer data.
Define the Shopify metrics and KPIs to track
Metrics are defined by the objective of the business. Select the metrics according to the report level and the metrics availability of your plan.
- Shopify Acquisition Metrics – These contain numbers and dimensions around traffic and session reports. These are defining metrics you should be studying to understand channels, mediums, and pages to scale on for business growth.
- Sessions and Visitors – One key traffic-related data to look for is the sessions and visitors metrics. This is because it is a fundamental metric for understanding the health of your business. It is the current that stimulates your online store’s growth. The Sessions overtime report shows the number of visitors and sessions for the time range. You can select a unit of time in the Group by drop-down menu to control how the data is grouped.
- Visitors by landing page – This Shopify report shows you information on how many visitors have visited each page. It is a more segmented report as it displays traffic information per landing page.
- Visitors by referrer – The Visitors by referrer or Sessions by referrer report shows you whether your visitors are coming to your store directly, from search, or by a referral. This form of data can also be accessed from your Analytics page, but the Sessions by referrer report gives you more detailed insights
- Visitors by location – The Sessions by location report shows you the countries from which visitors are accessing your website.
- Shopify Overall Metrics – These are some of the most important metrics every Shopify online store owner must keep in mind. They can make or break your business if overlooked.
- Average order value (AOV) – This metric reveals the average amount your customer spends on purchases on your website.
- Online store conversion rate – Your store conversion rate shows the percentage of visitors who took the desired action on your website. It isn’t only limited to purchases.
- Added to cart – This reveals the total number of sessions where a customer added a product to a cart in your store.
- Reached checkout – The reached checkout Shopify metric displays the total number of sessions where there was user input (for example, a key press or mouse click) during checkout.
- Sessions converted – Shows the number and percentage of sessions in which shoppers added one or more items to their shopping carts, proceeded to the checkout, and then purchased the items. This amount might not match your order count, because shoppers can make multiple orders within a single session.
- Online store sessions by device type – This metric shows the number of sessions on your online store and what kind of device was used to access your store. The most common device types are mobile, desktop, and tablet.
- Online store sessions by location – this shows you the number of sessions on your online store sorted by country.
- Online store sessions by traffic source – reveals information on the number of sessions on your online store based on how the visitors accessed your store. A session occurs when someone does a search or enters the URL of your store directly, for example. The most common traffic sources are search, direct, social, and email.
- Online store sessions from social sources – shows the number of sessions on your online store originating from social media sources, such as Facebook, Instagram, YouTube, or Twitter. This data can help you focus your marketing efforts.
- Repeat customer rate – This shows the percentage of your customers who have placed more than one order from your store. This rate can help you determine how solid your established customer base is
- Sales by POS location – Sales by POS location works best for multi-chain store businesses. If you have a point of sale locations, this data displays the number of sales that originated from each location.
- Sales by social source – This shows you the number of sales that originated from social media sources, such as Facebook and YouTube. This data can help you focus your marketing efforts.
- Sales by staff – If you have point of sale locations, this data will show you the amount of sales handled by each staff.
- Sales by traffic source – reveals the total amount of sales that came from each traffic source. The most common traffic sources are search, direct, social, and email.
- Top landing pages – This display ranks specific pages on which your customers started their sessions on your online store. You can use this data to customize the text and call to actions on those pages to capitalize on your customers’ first impression of your site.
- Top products by units sold – Shows the top-selling products from your store that you can use to recommend products to new customers or refer to them in social media promotions. This is useful to know for marketing and inventory purposes.
- Top referrers by sessions – Shows the number of sessions to your online store that came directly from other websites. The top 5 websites are shown.
- Products Returns & Refunds – This shows you details regarding products returned and refunded. This is an important data to keep track of as it is critical to your business health and central to customer feedback on specific products. If you refund orders quickly and effectively, then you show your commitment to customer service and might encourage customers to order again. Depending on your return policy, you might need to create returns for customers to return purchased items and refund a customer’s payment. From your Shopify admin you can create and manage your returns, send shipping instructions and return labels to your customers, track returned items, restock inspected items, and refund payments to your customers.
Shopify Breakdowns and Filters
Time:
This shows you the time stamp and range when certain activities happened in your store or report.
Device and placement :
This filter shows the device type your store surfers used to access your store as well as placement.
Geographic and demographics:
The geographic filter categorizes customers based on their geographical location while demographic groups customers based on factors such as age, gender, or purchases.
Customer:
This shows you the total number of people who have purchased your product from your Shopify store.
Line Item:
Line items are anything on an order affecting the order total (e.g. products, taxes, shipping, discounts, fees, etc.). A line in a cart, checkout, or order. Each line item represents a product variant.
Orders :
An order is a customer’s request to purchase one or more products from a shop. You can retrieve, update and delete orders using the order resource.
Steps to set up your report
To connect Shopify to Data Studio, access the Shopify Porter Metrics connector and click on the Make a Free Report button.
First, log in with your Google account, Make sure you log in with the same account you’re currently using on Data Studio.
Later, you should add the username and content of your Shopify store.
The username refers to the subdomain of the Shopify URL you use to access your store administrator. You can find it by logging in to your Shopify store account.
For instance, if the URL you use is https://porter-awesome-store.myshopify.com/, you’ll copy “porter-awesome-store“, as shown on this image.
On Data Studio, it would look like this:

For adding the Token, you’ll follow these steps.
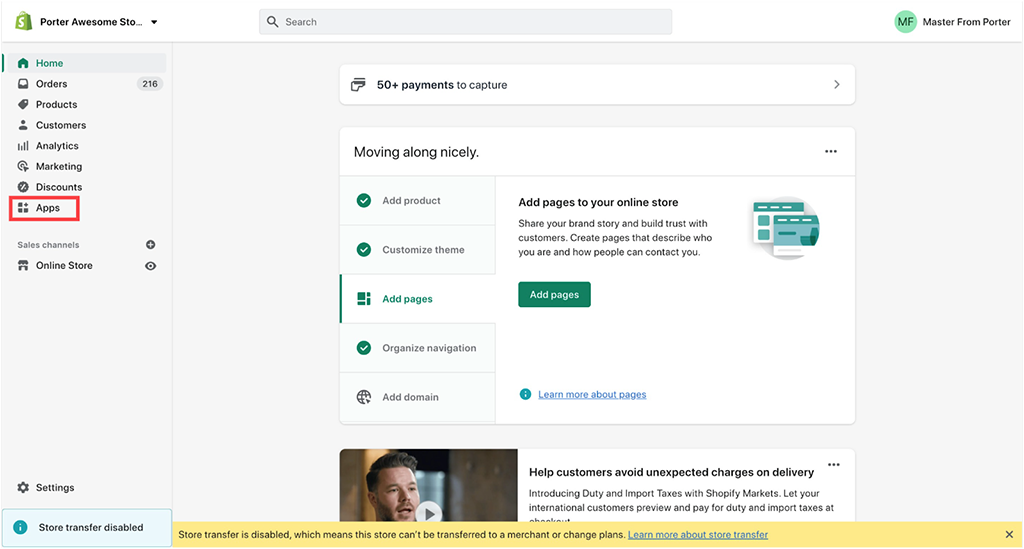
Log in to your Shopify store and go to Apps.
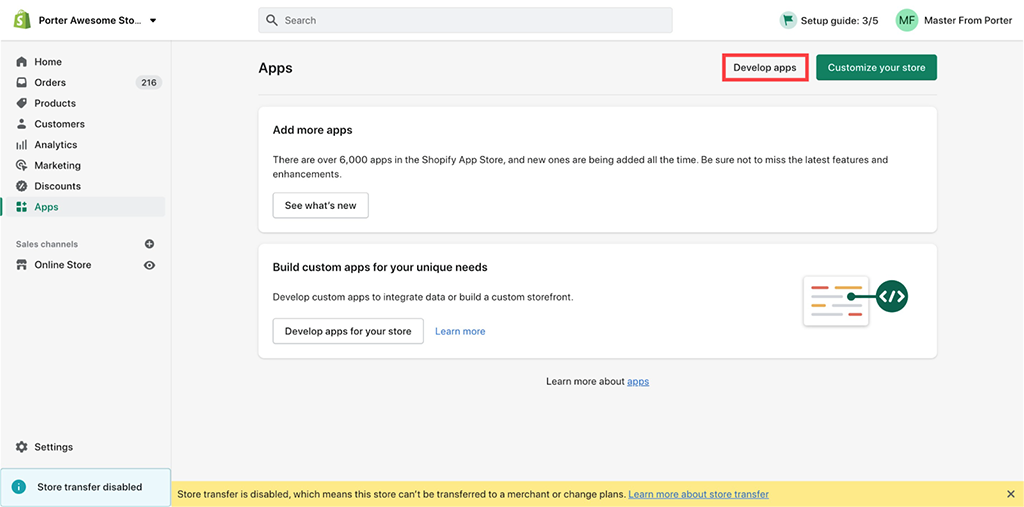
Then, go to Develop apps.
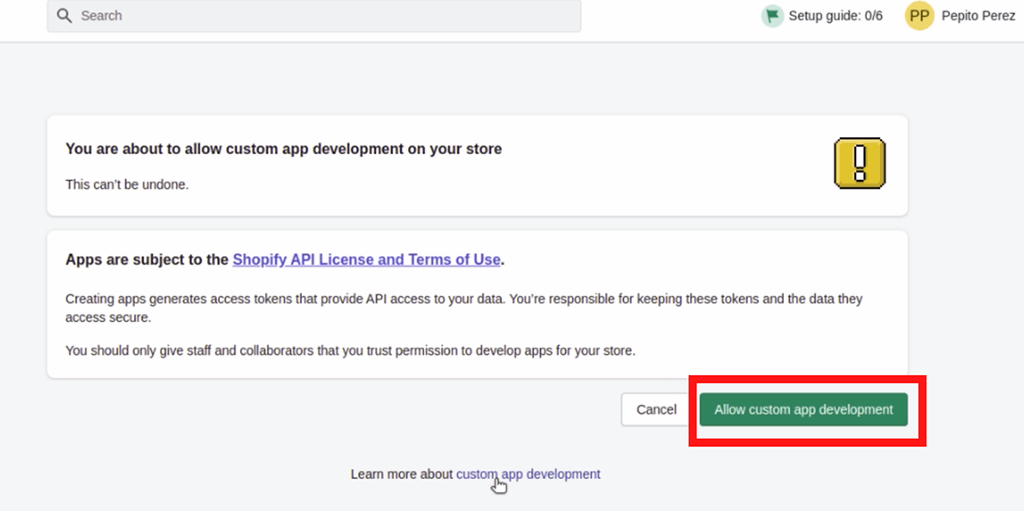
Next, go to Allow custom app development.
If it’s your 1st time, you’ll see this view:
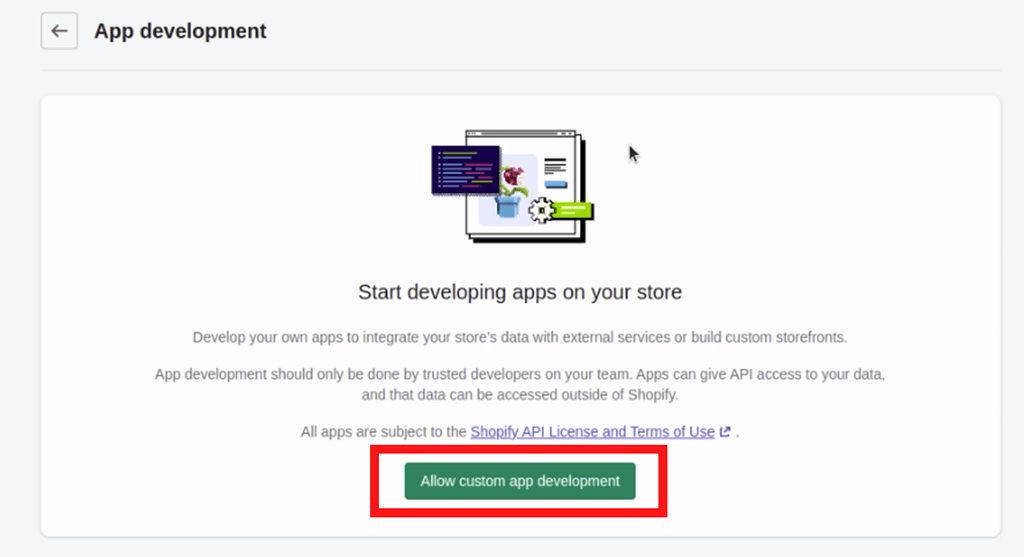
Then, confirm on Allow Custom app development.
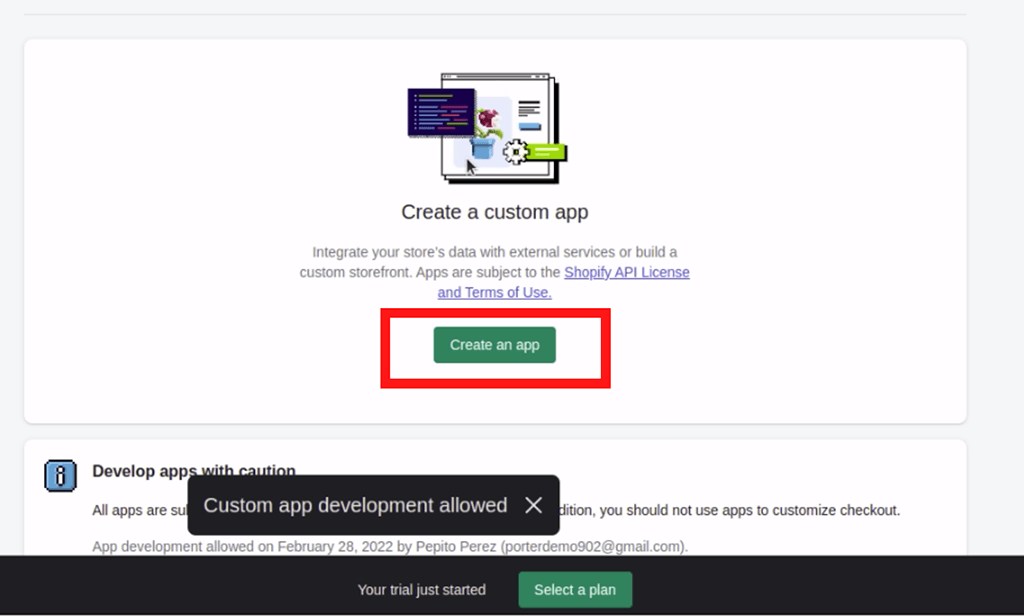
Next, click on Create app.
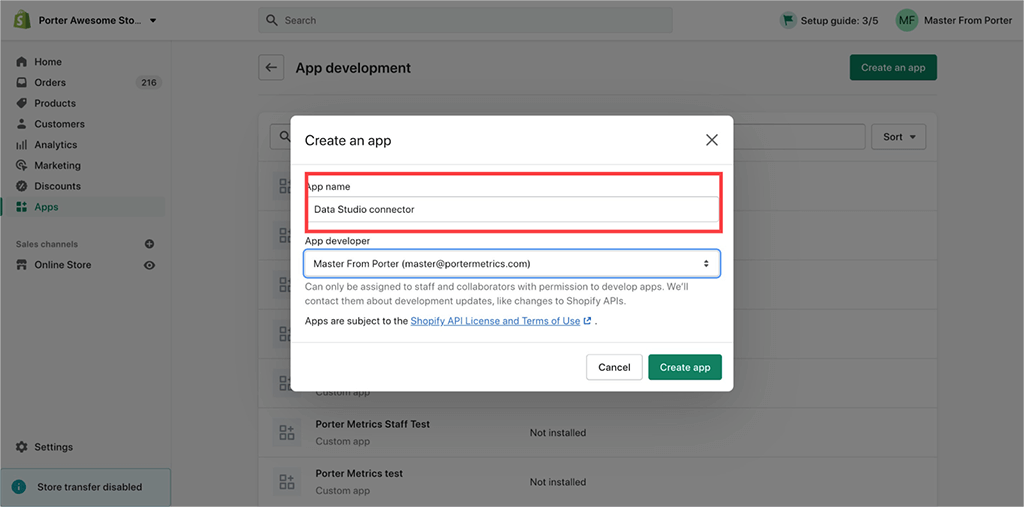
Then, name your app. Optionally, you can call it Shopify connector for Data Studio. Continue by clicking on Create app.
Go to Configure API scopes.
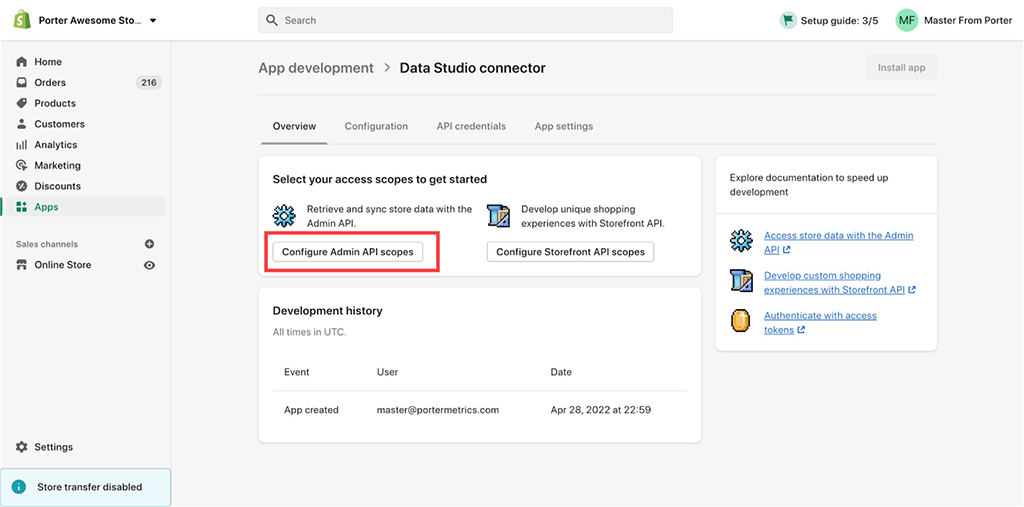
Enable the following permissions
- read_customers
- read_orders
- read_products
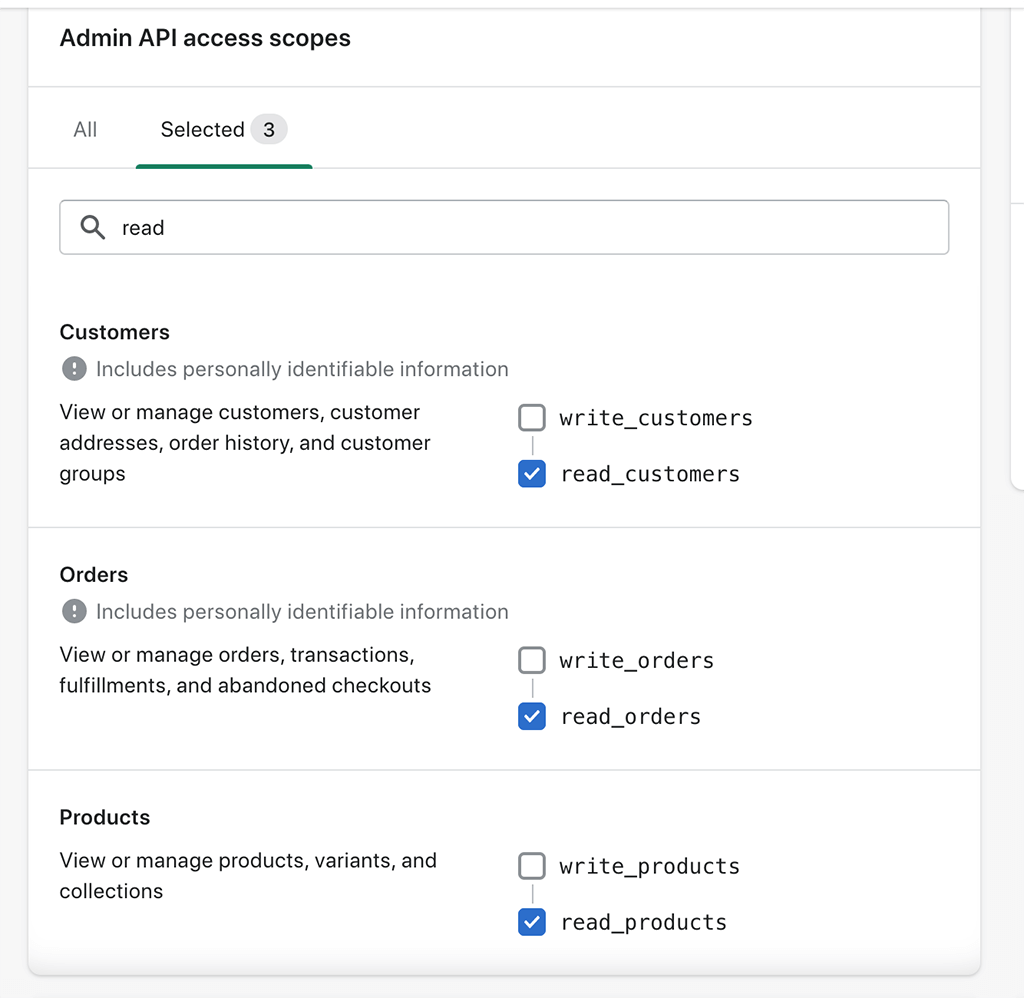
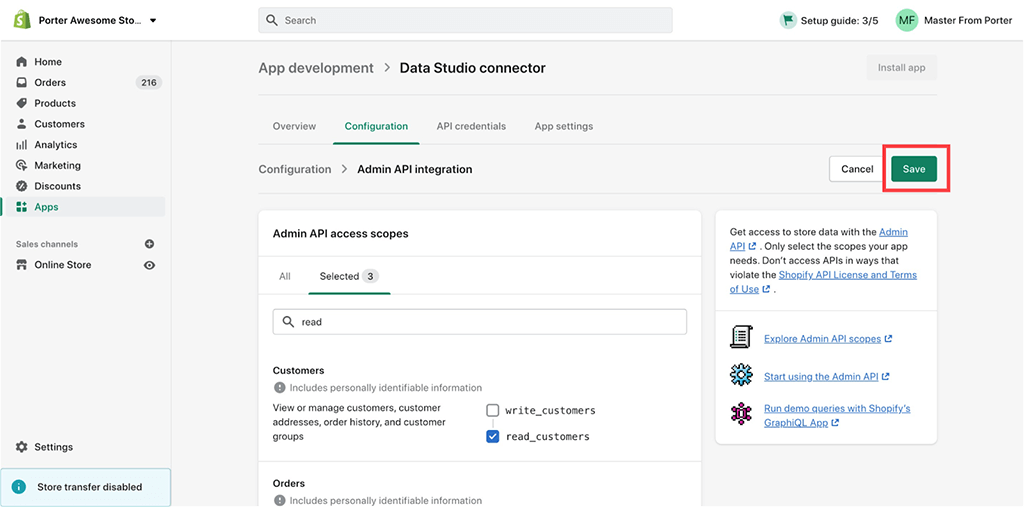
Click on Save, on the top-right corner of the page.
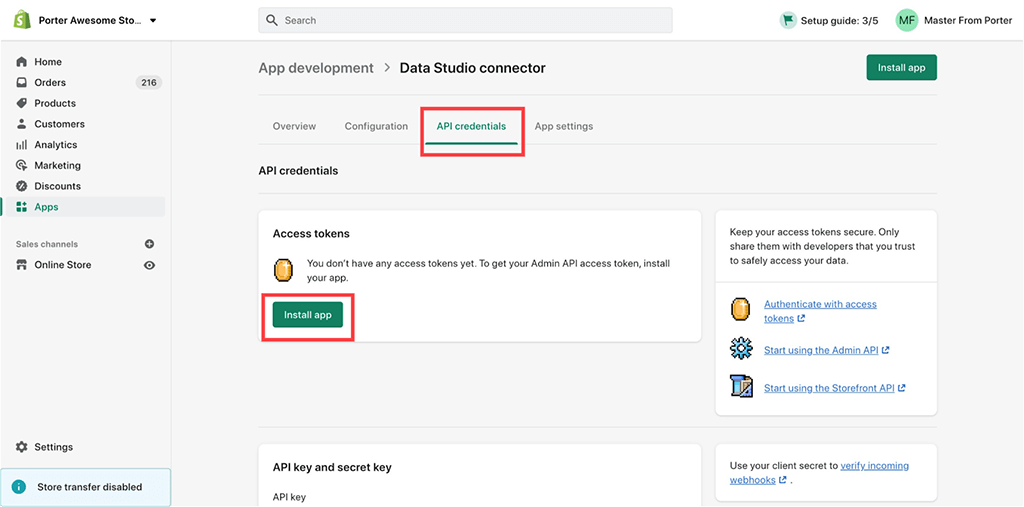
Go to API credentials and click on Install app.
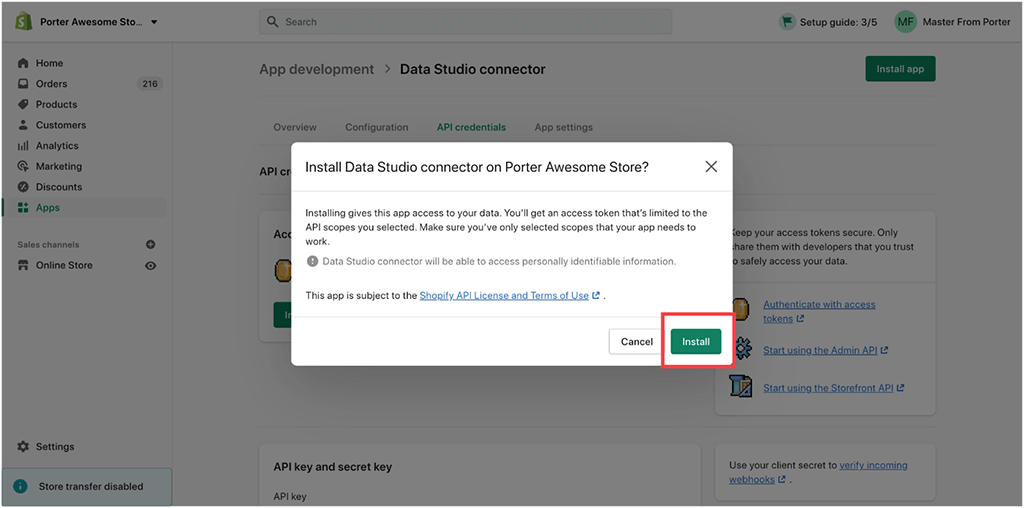
Confirm the installation by clicking on Install.
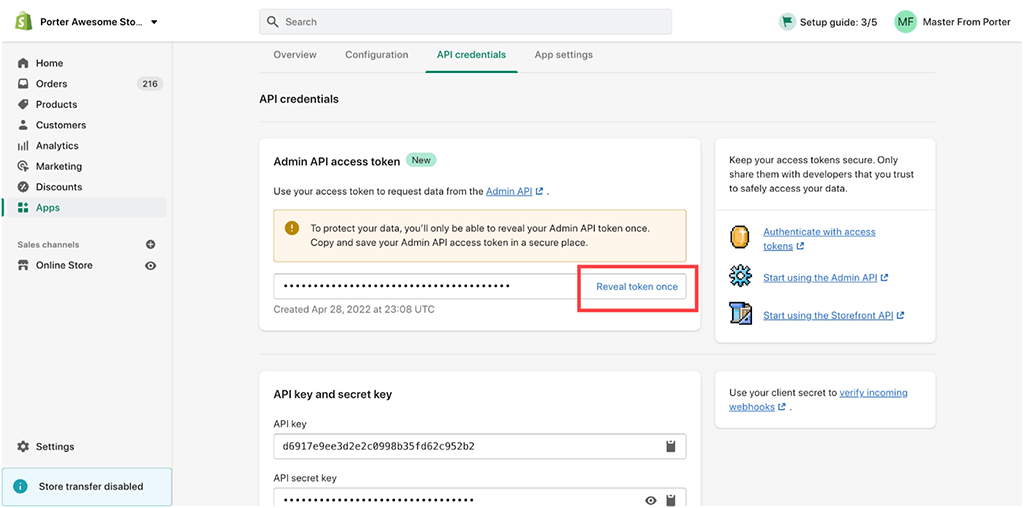
Click on Reveal token once.
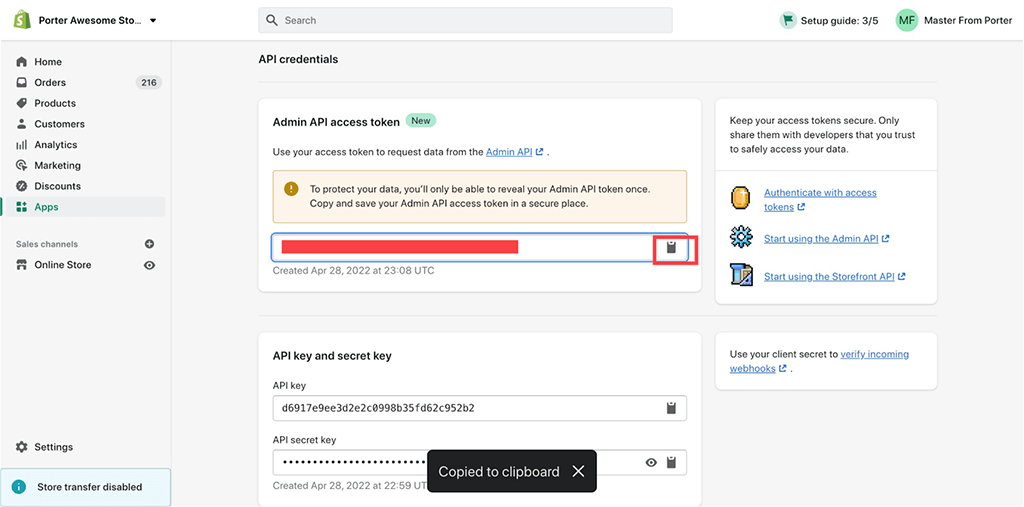
Copy the token.
Paste the token on the Google Data Studio configuration.
Finally, choose the Shopify store you want to connect to Data Studio and click on Connect.
Finally, you’ll see all the Shopify fields available on our connector. Click on create report.
You’ll get a default report template with Shopify data that you can fully customize!