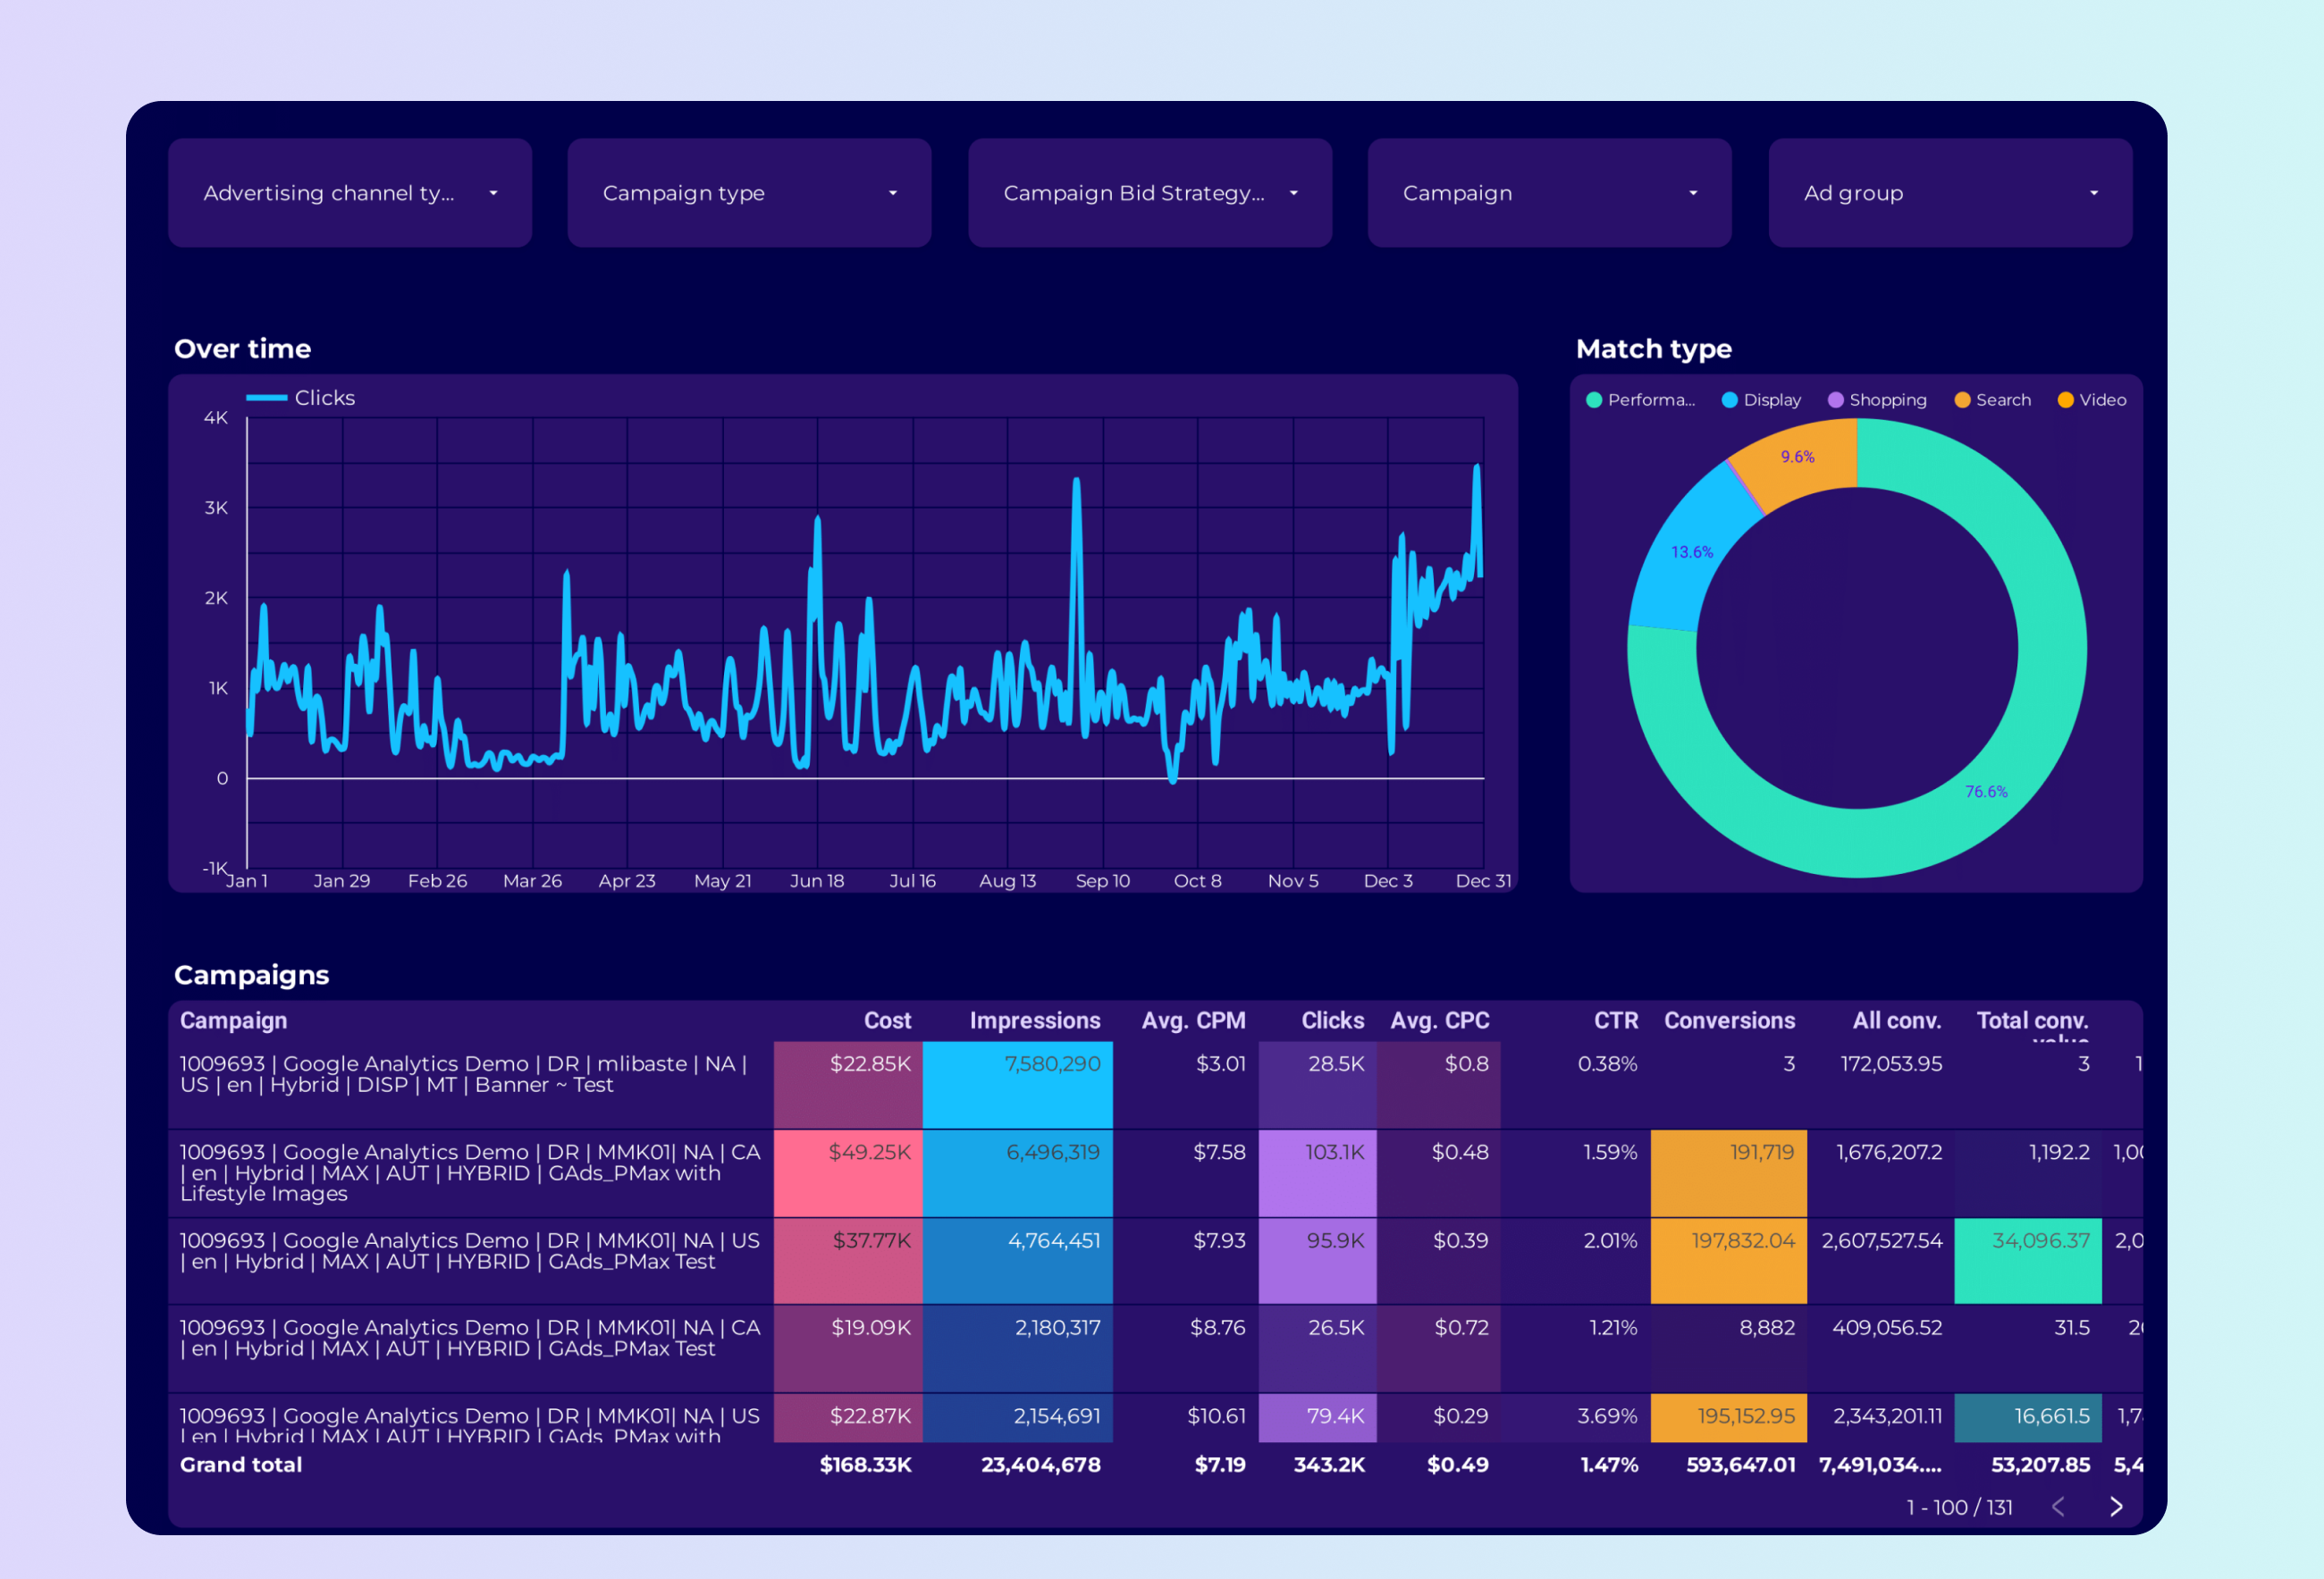
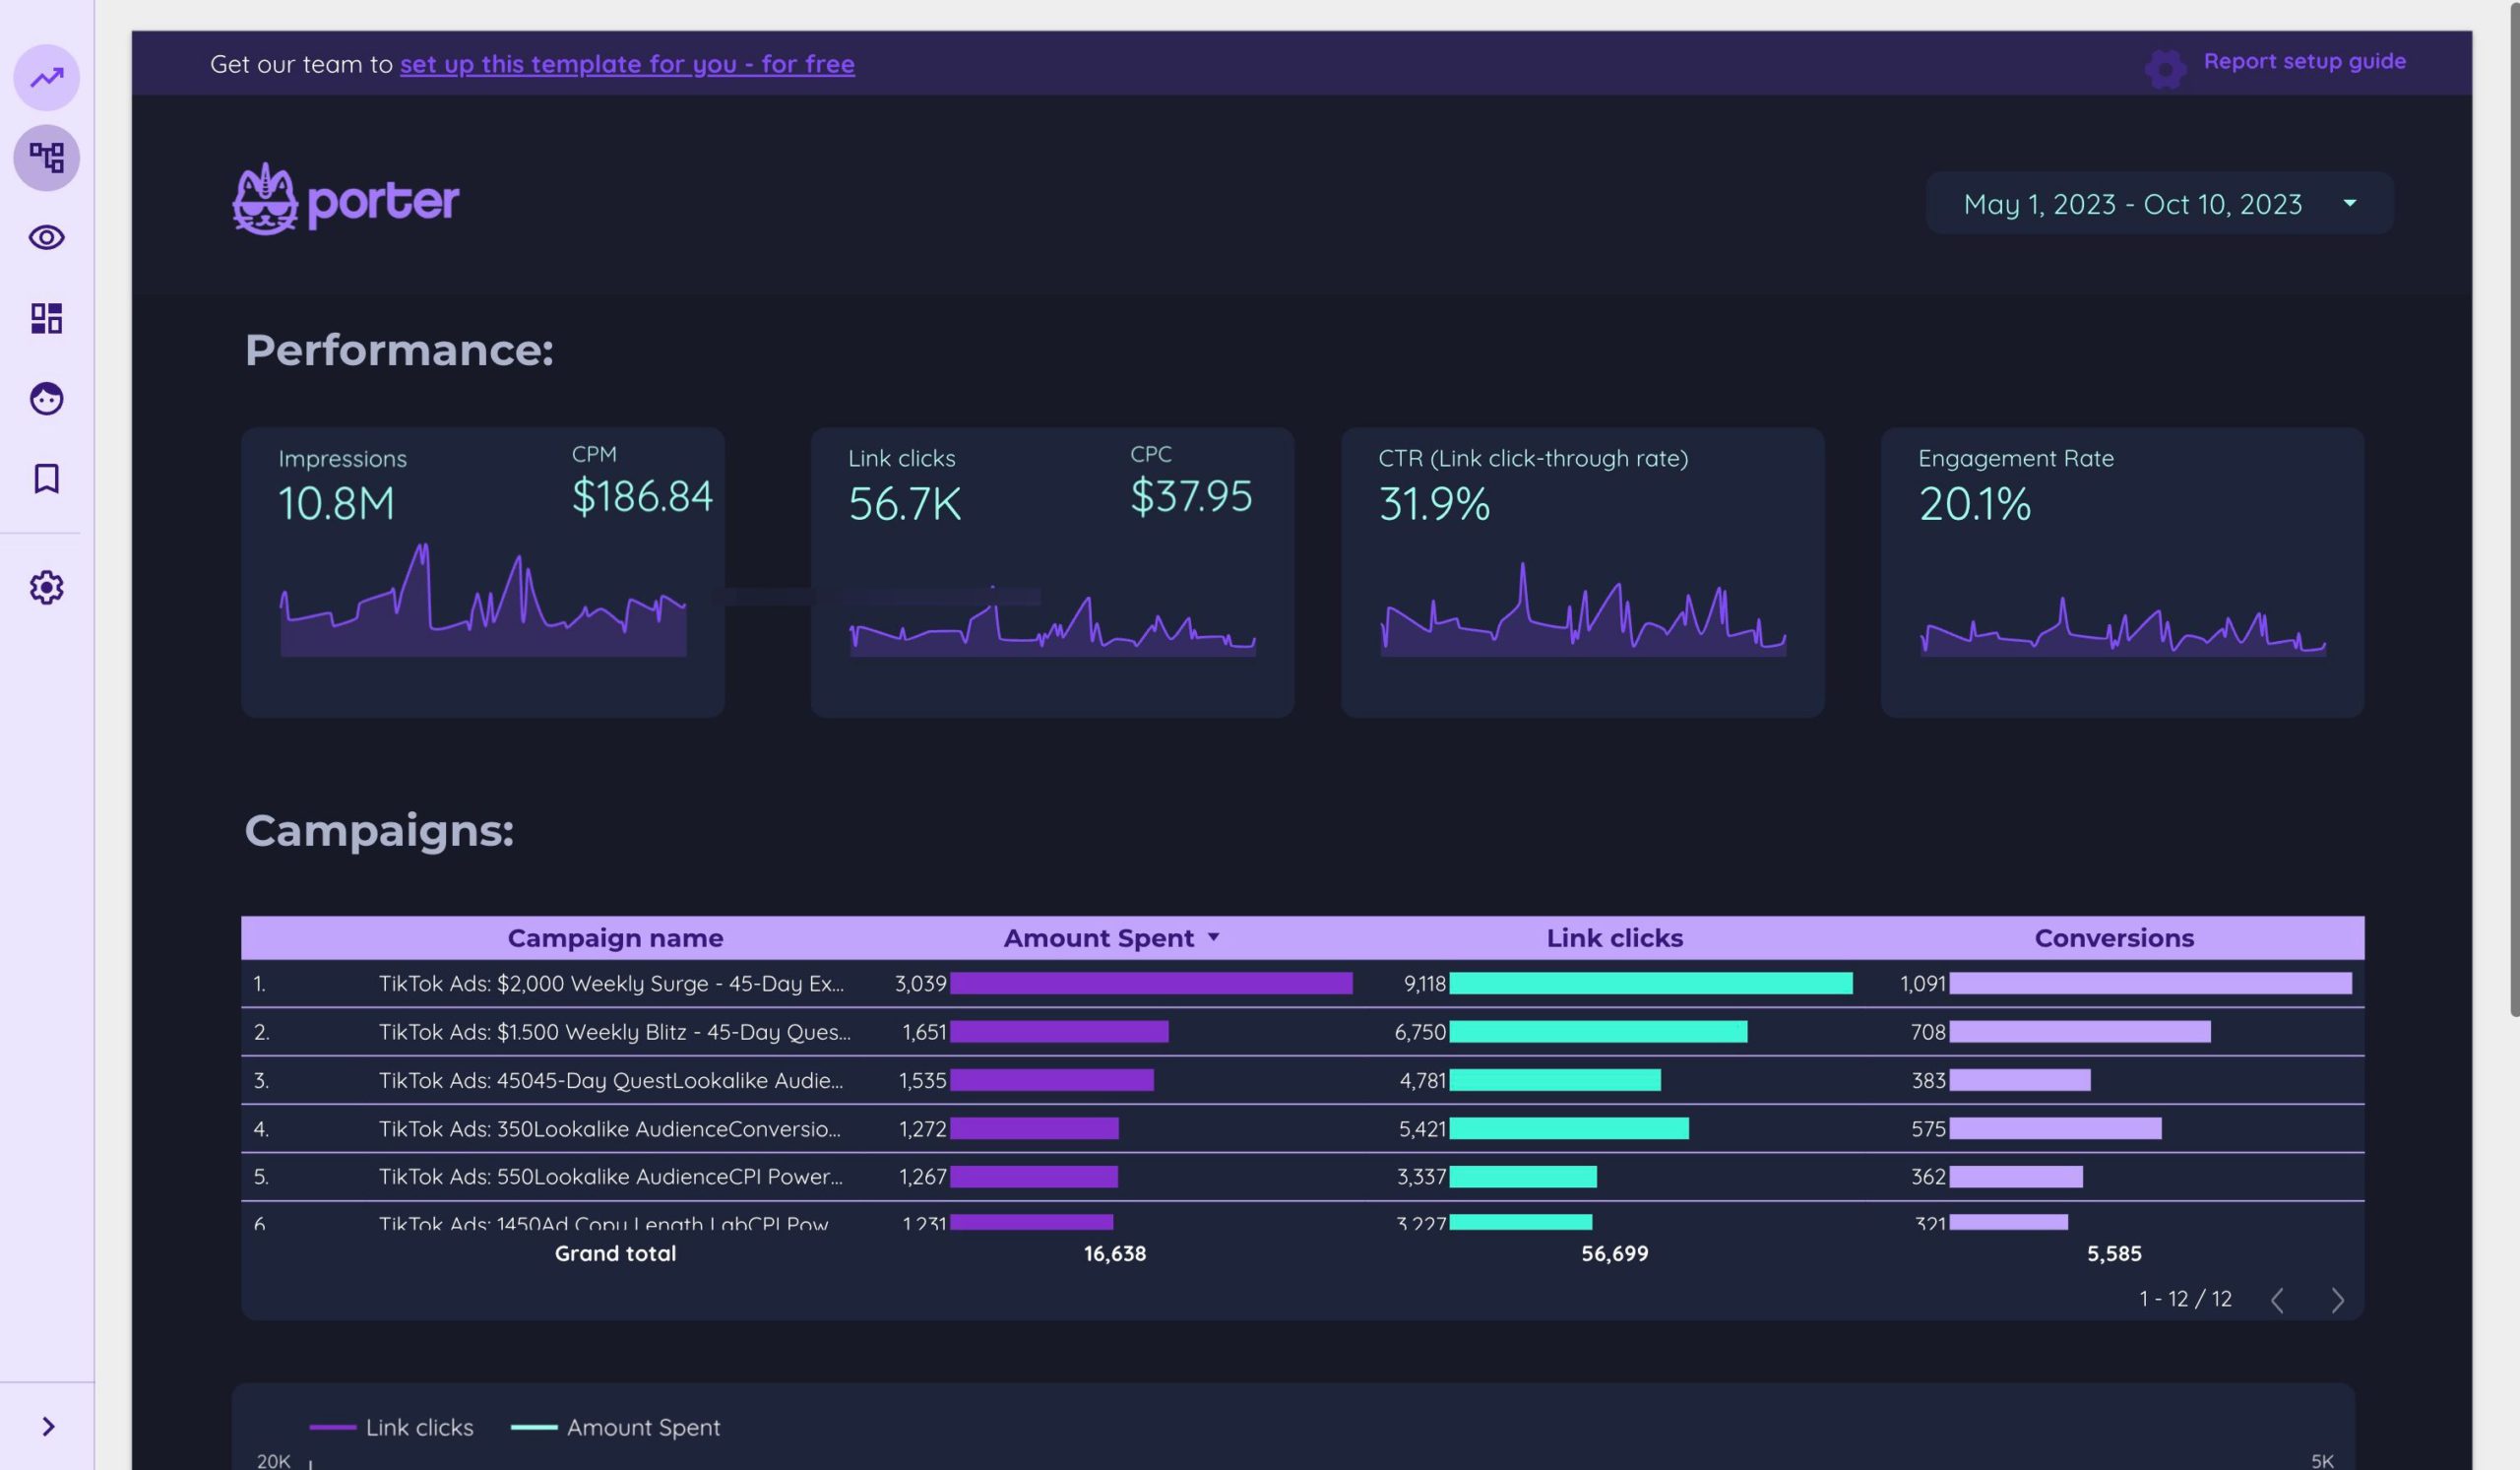
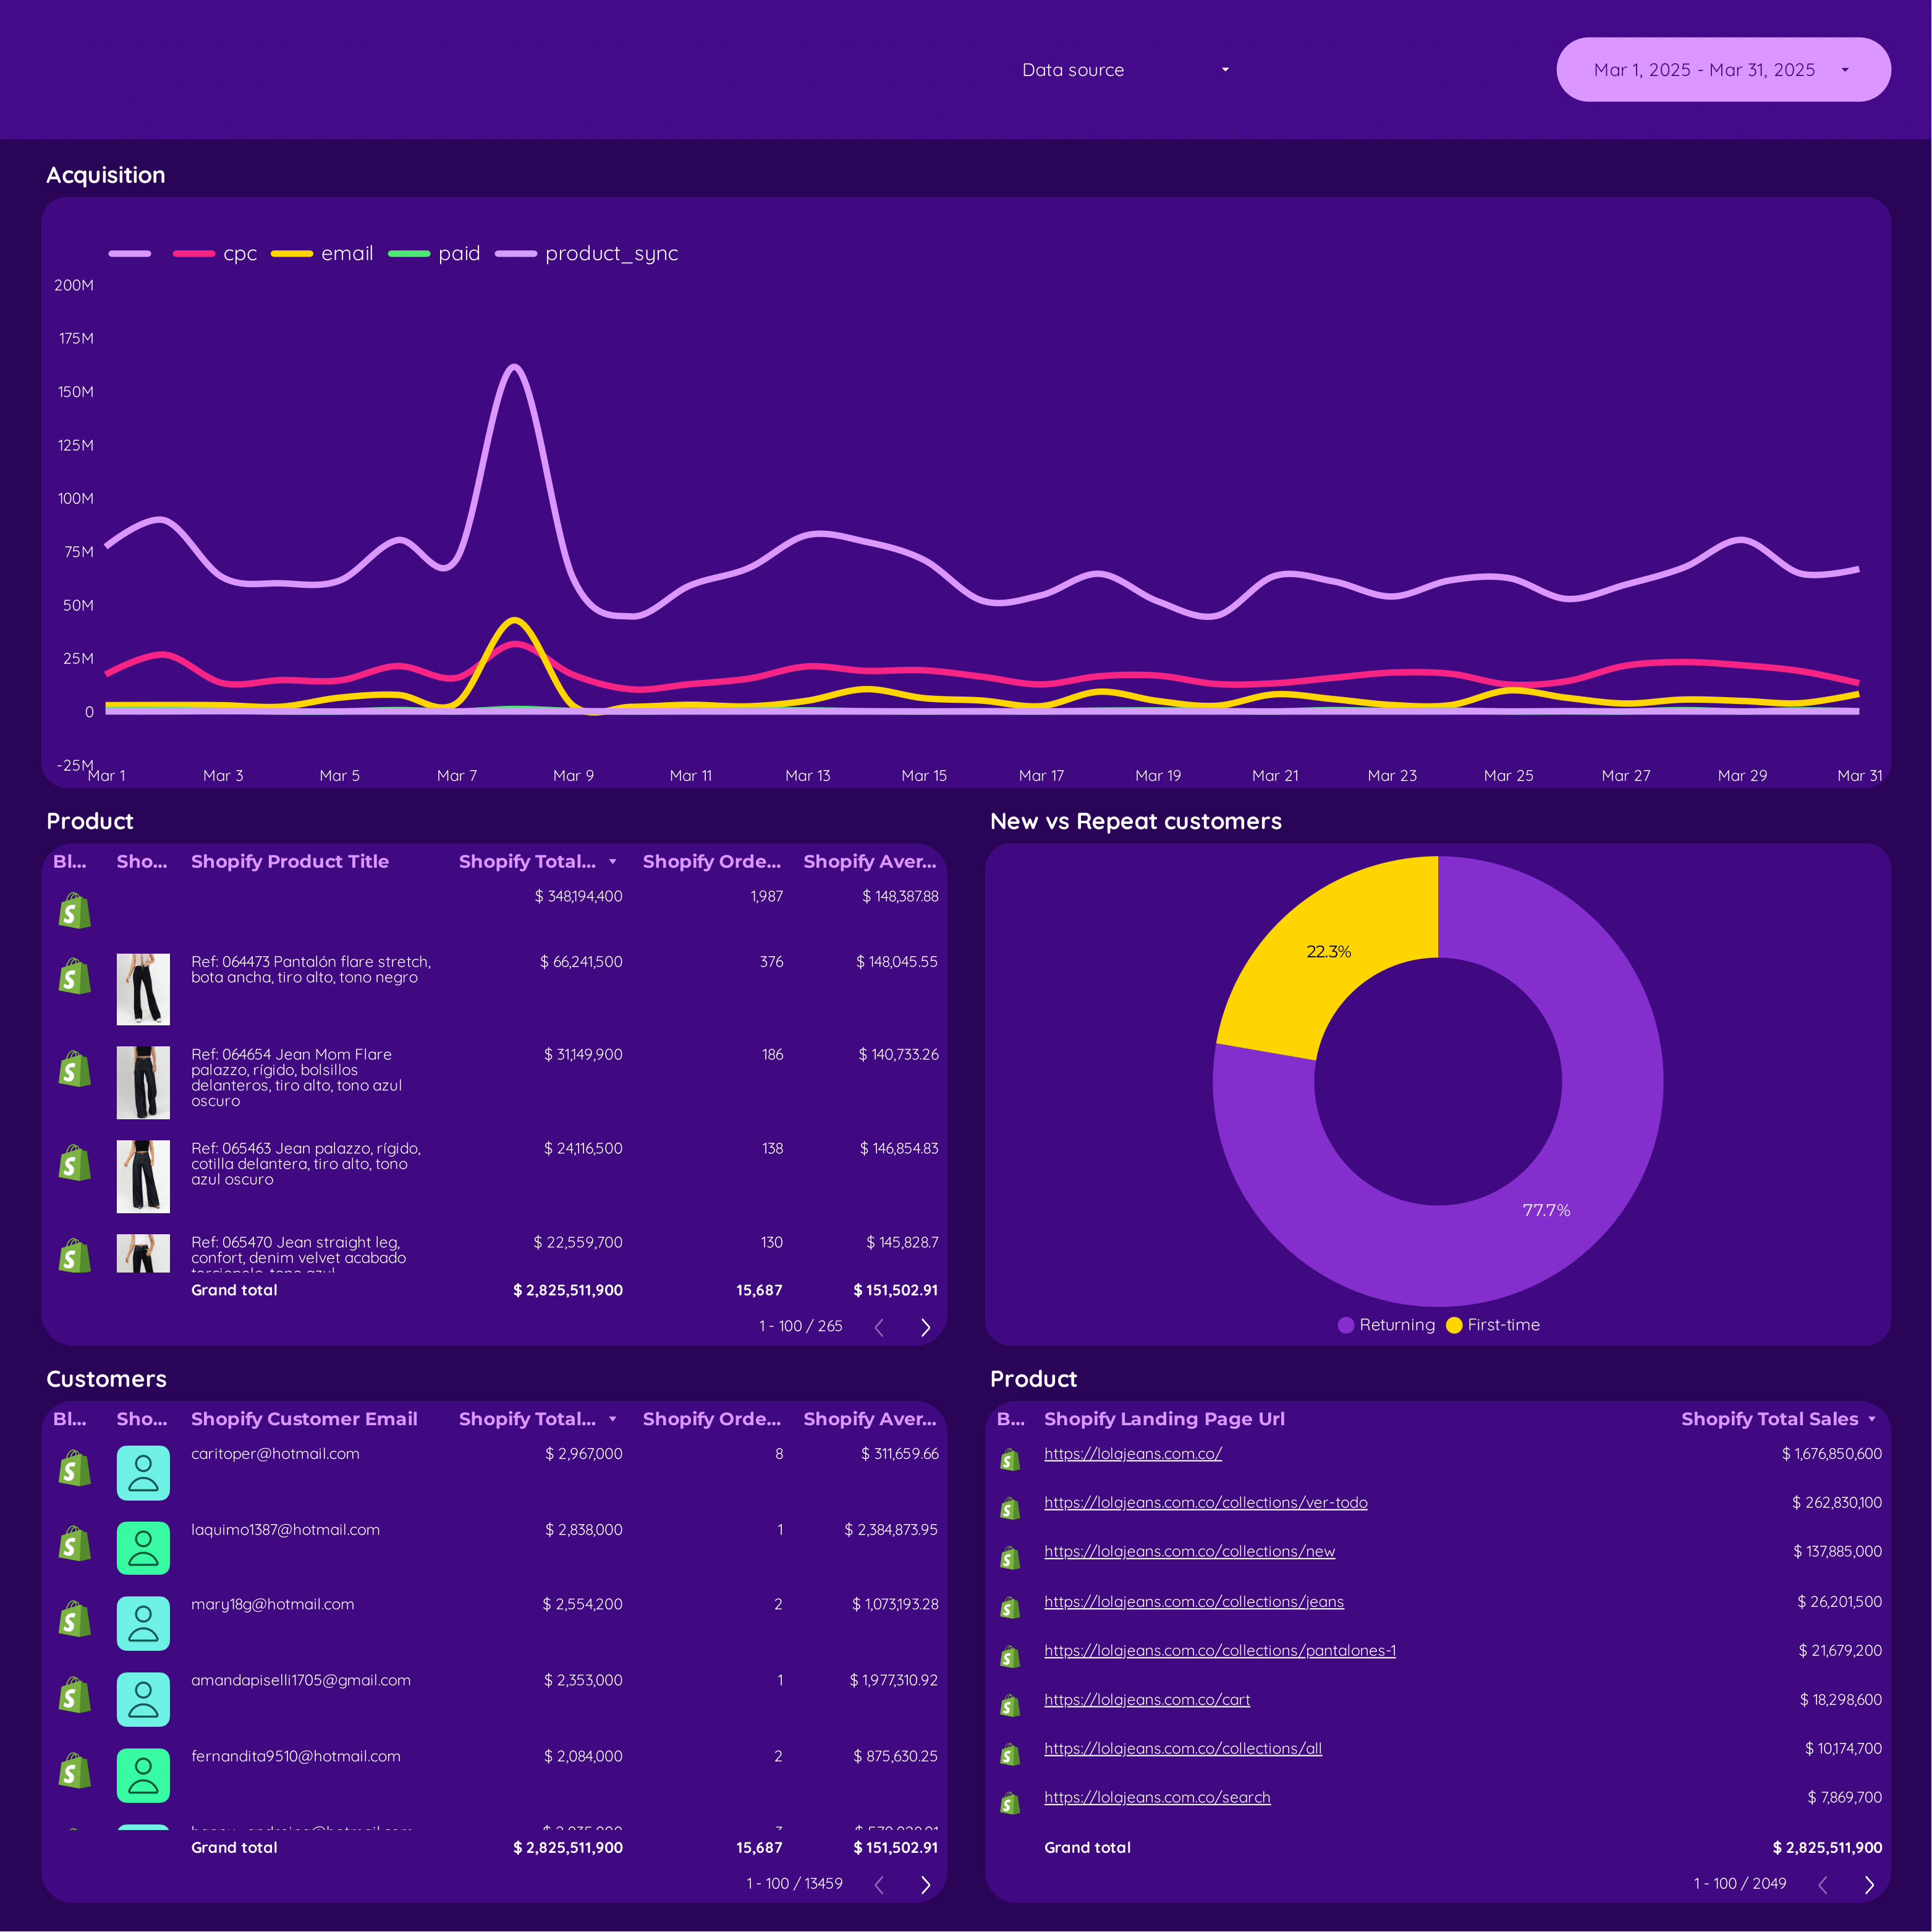
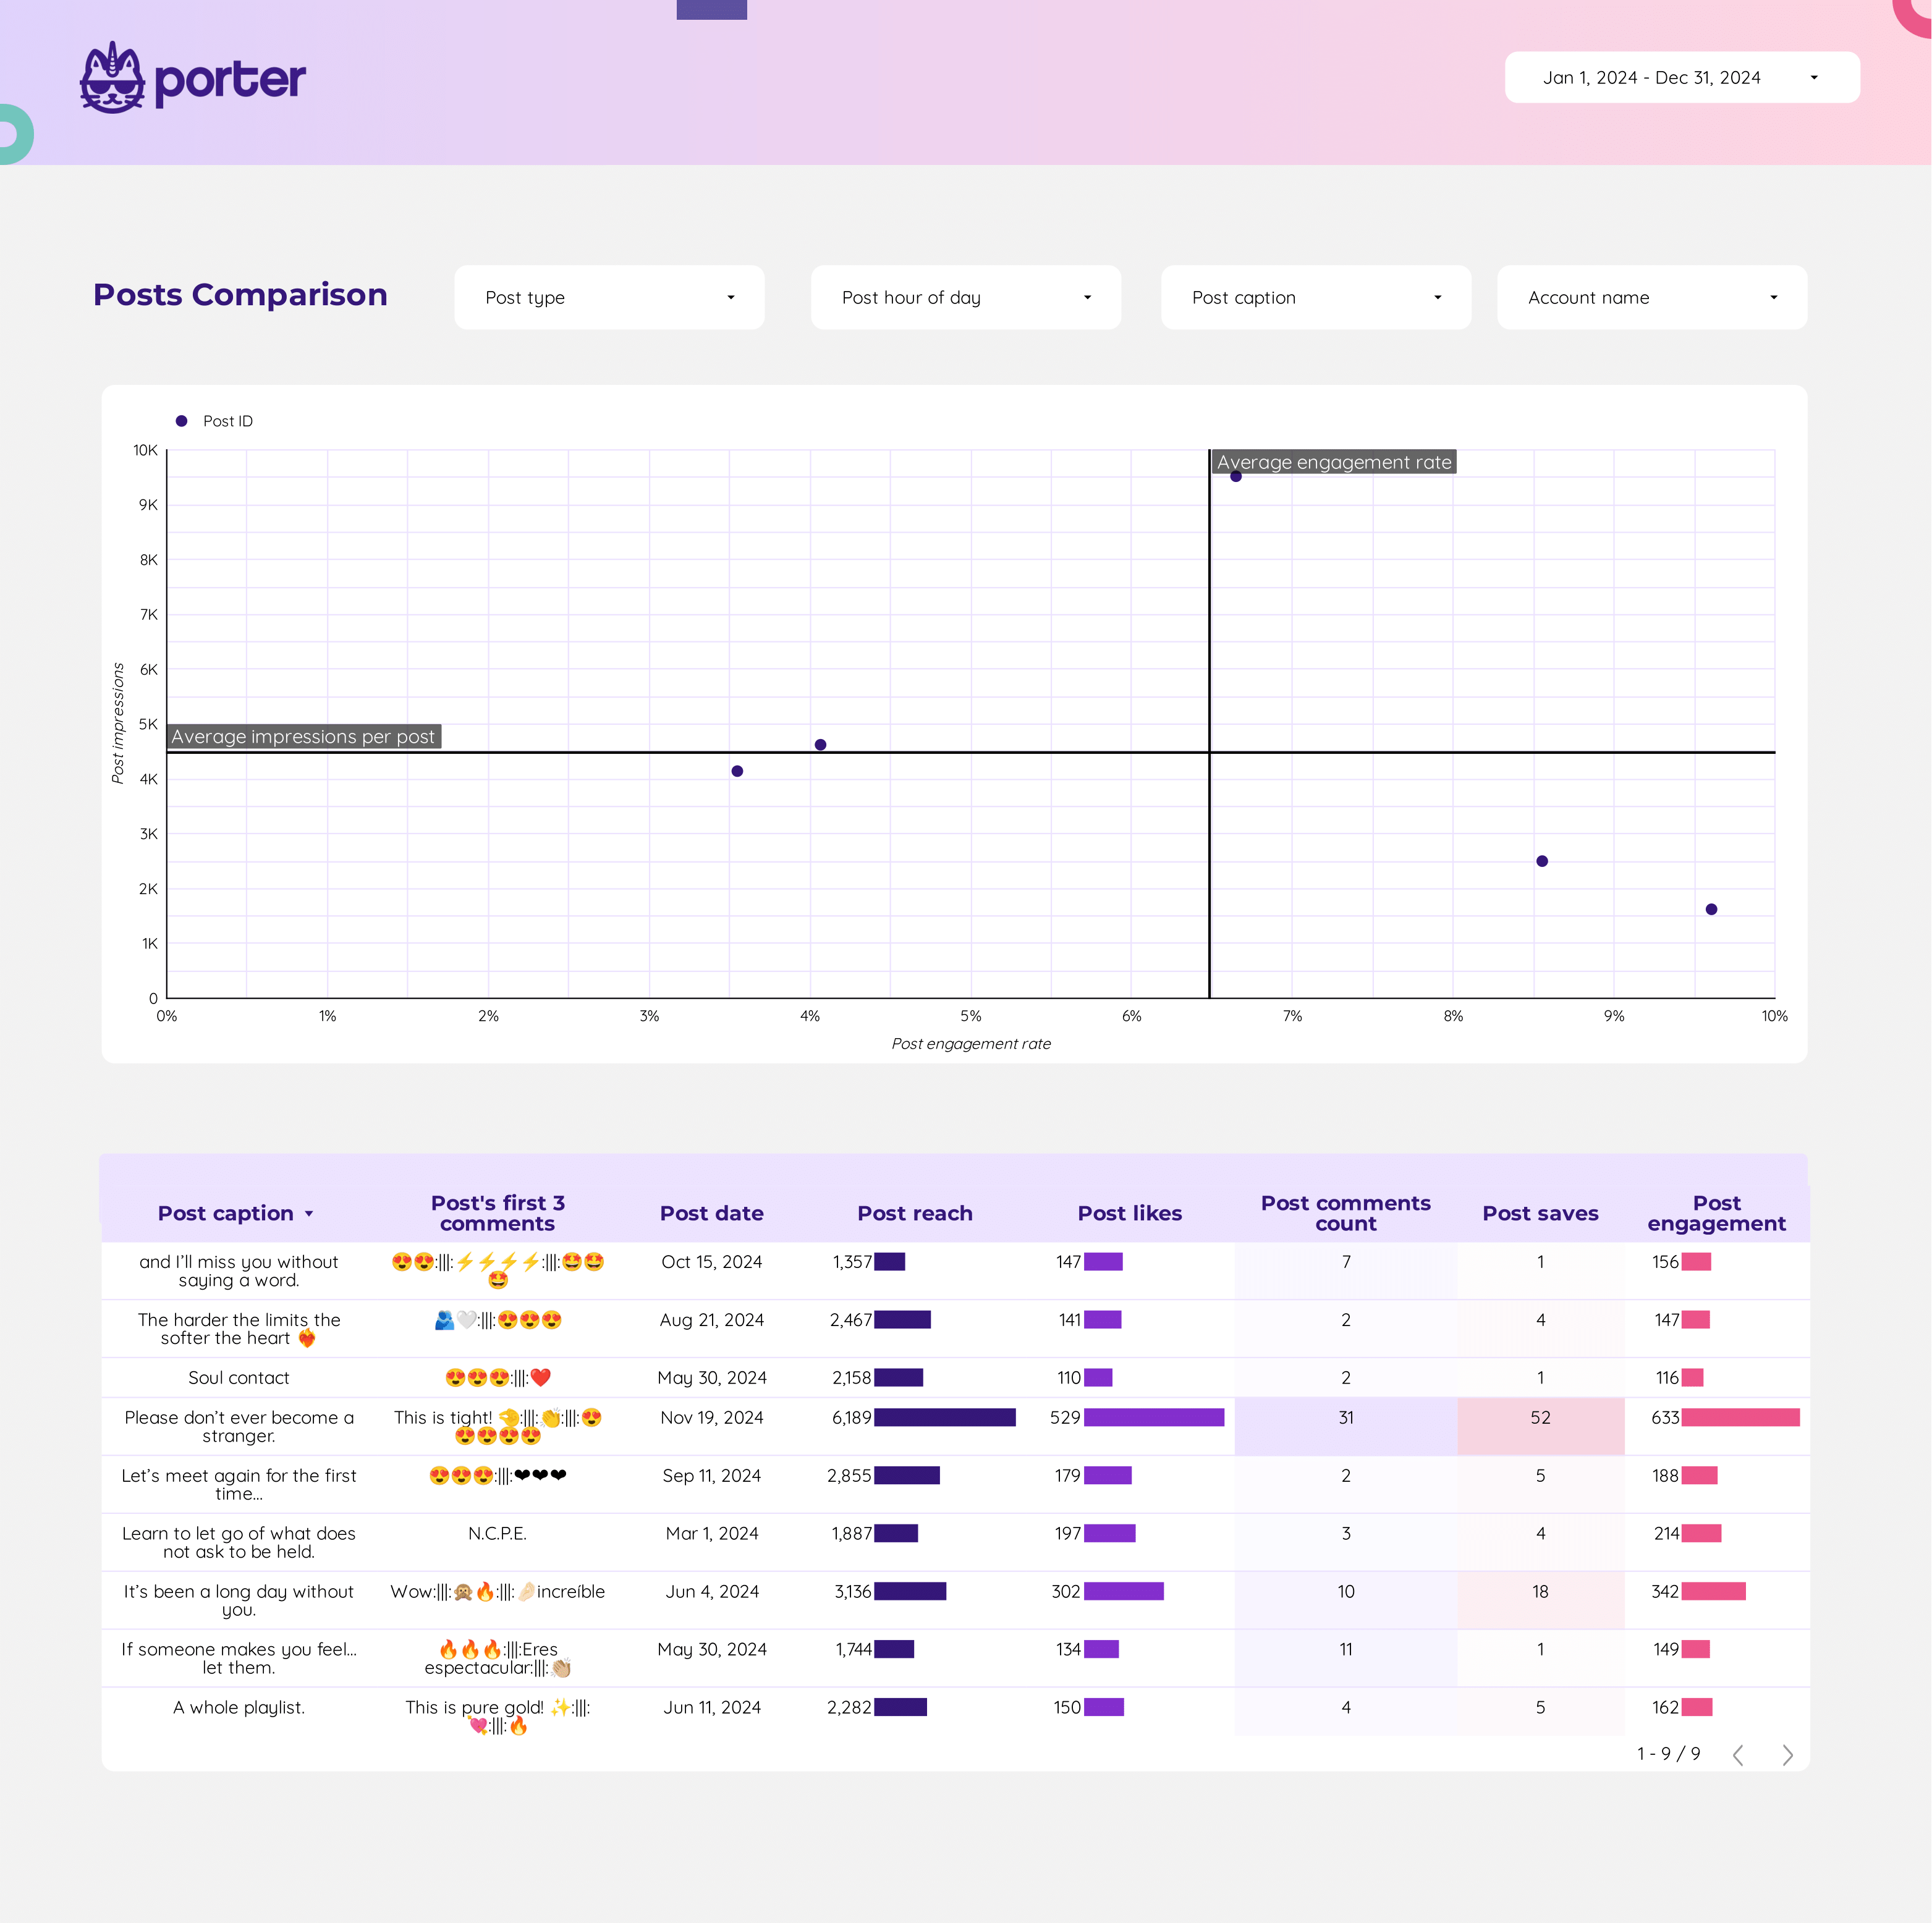
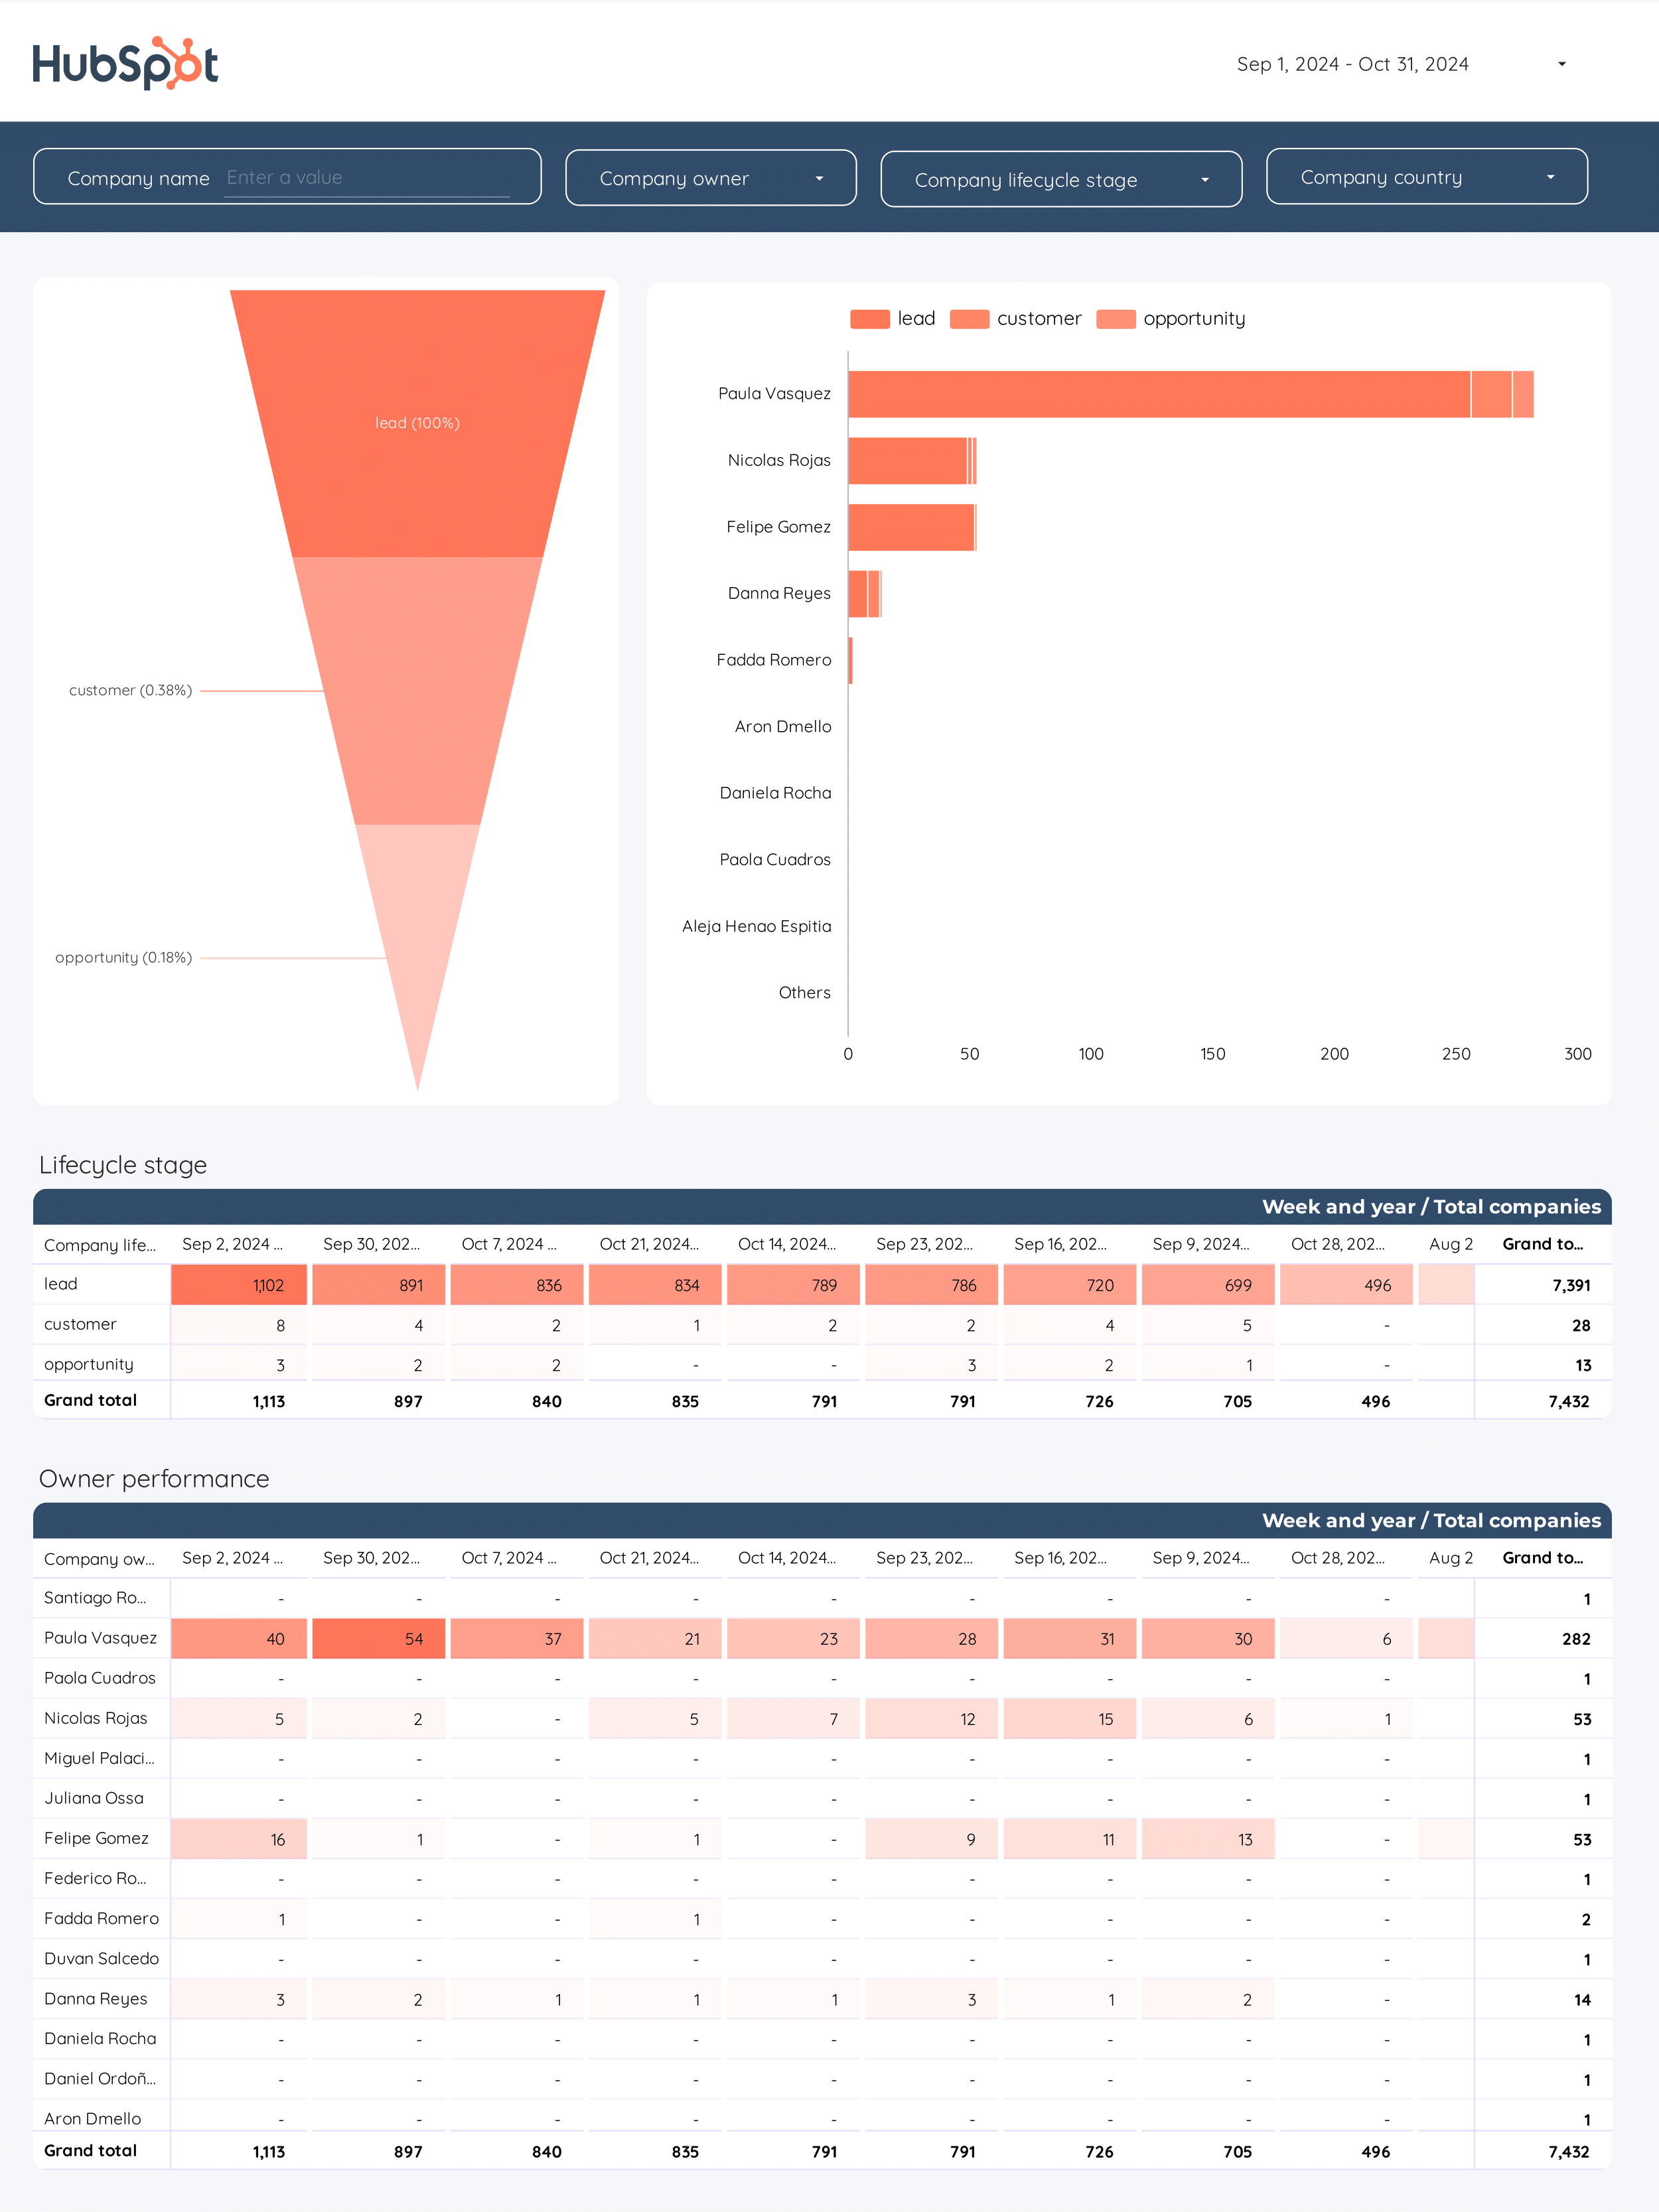
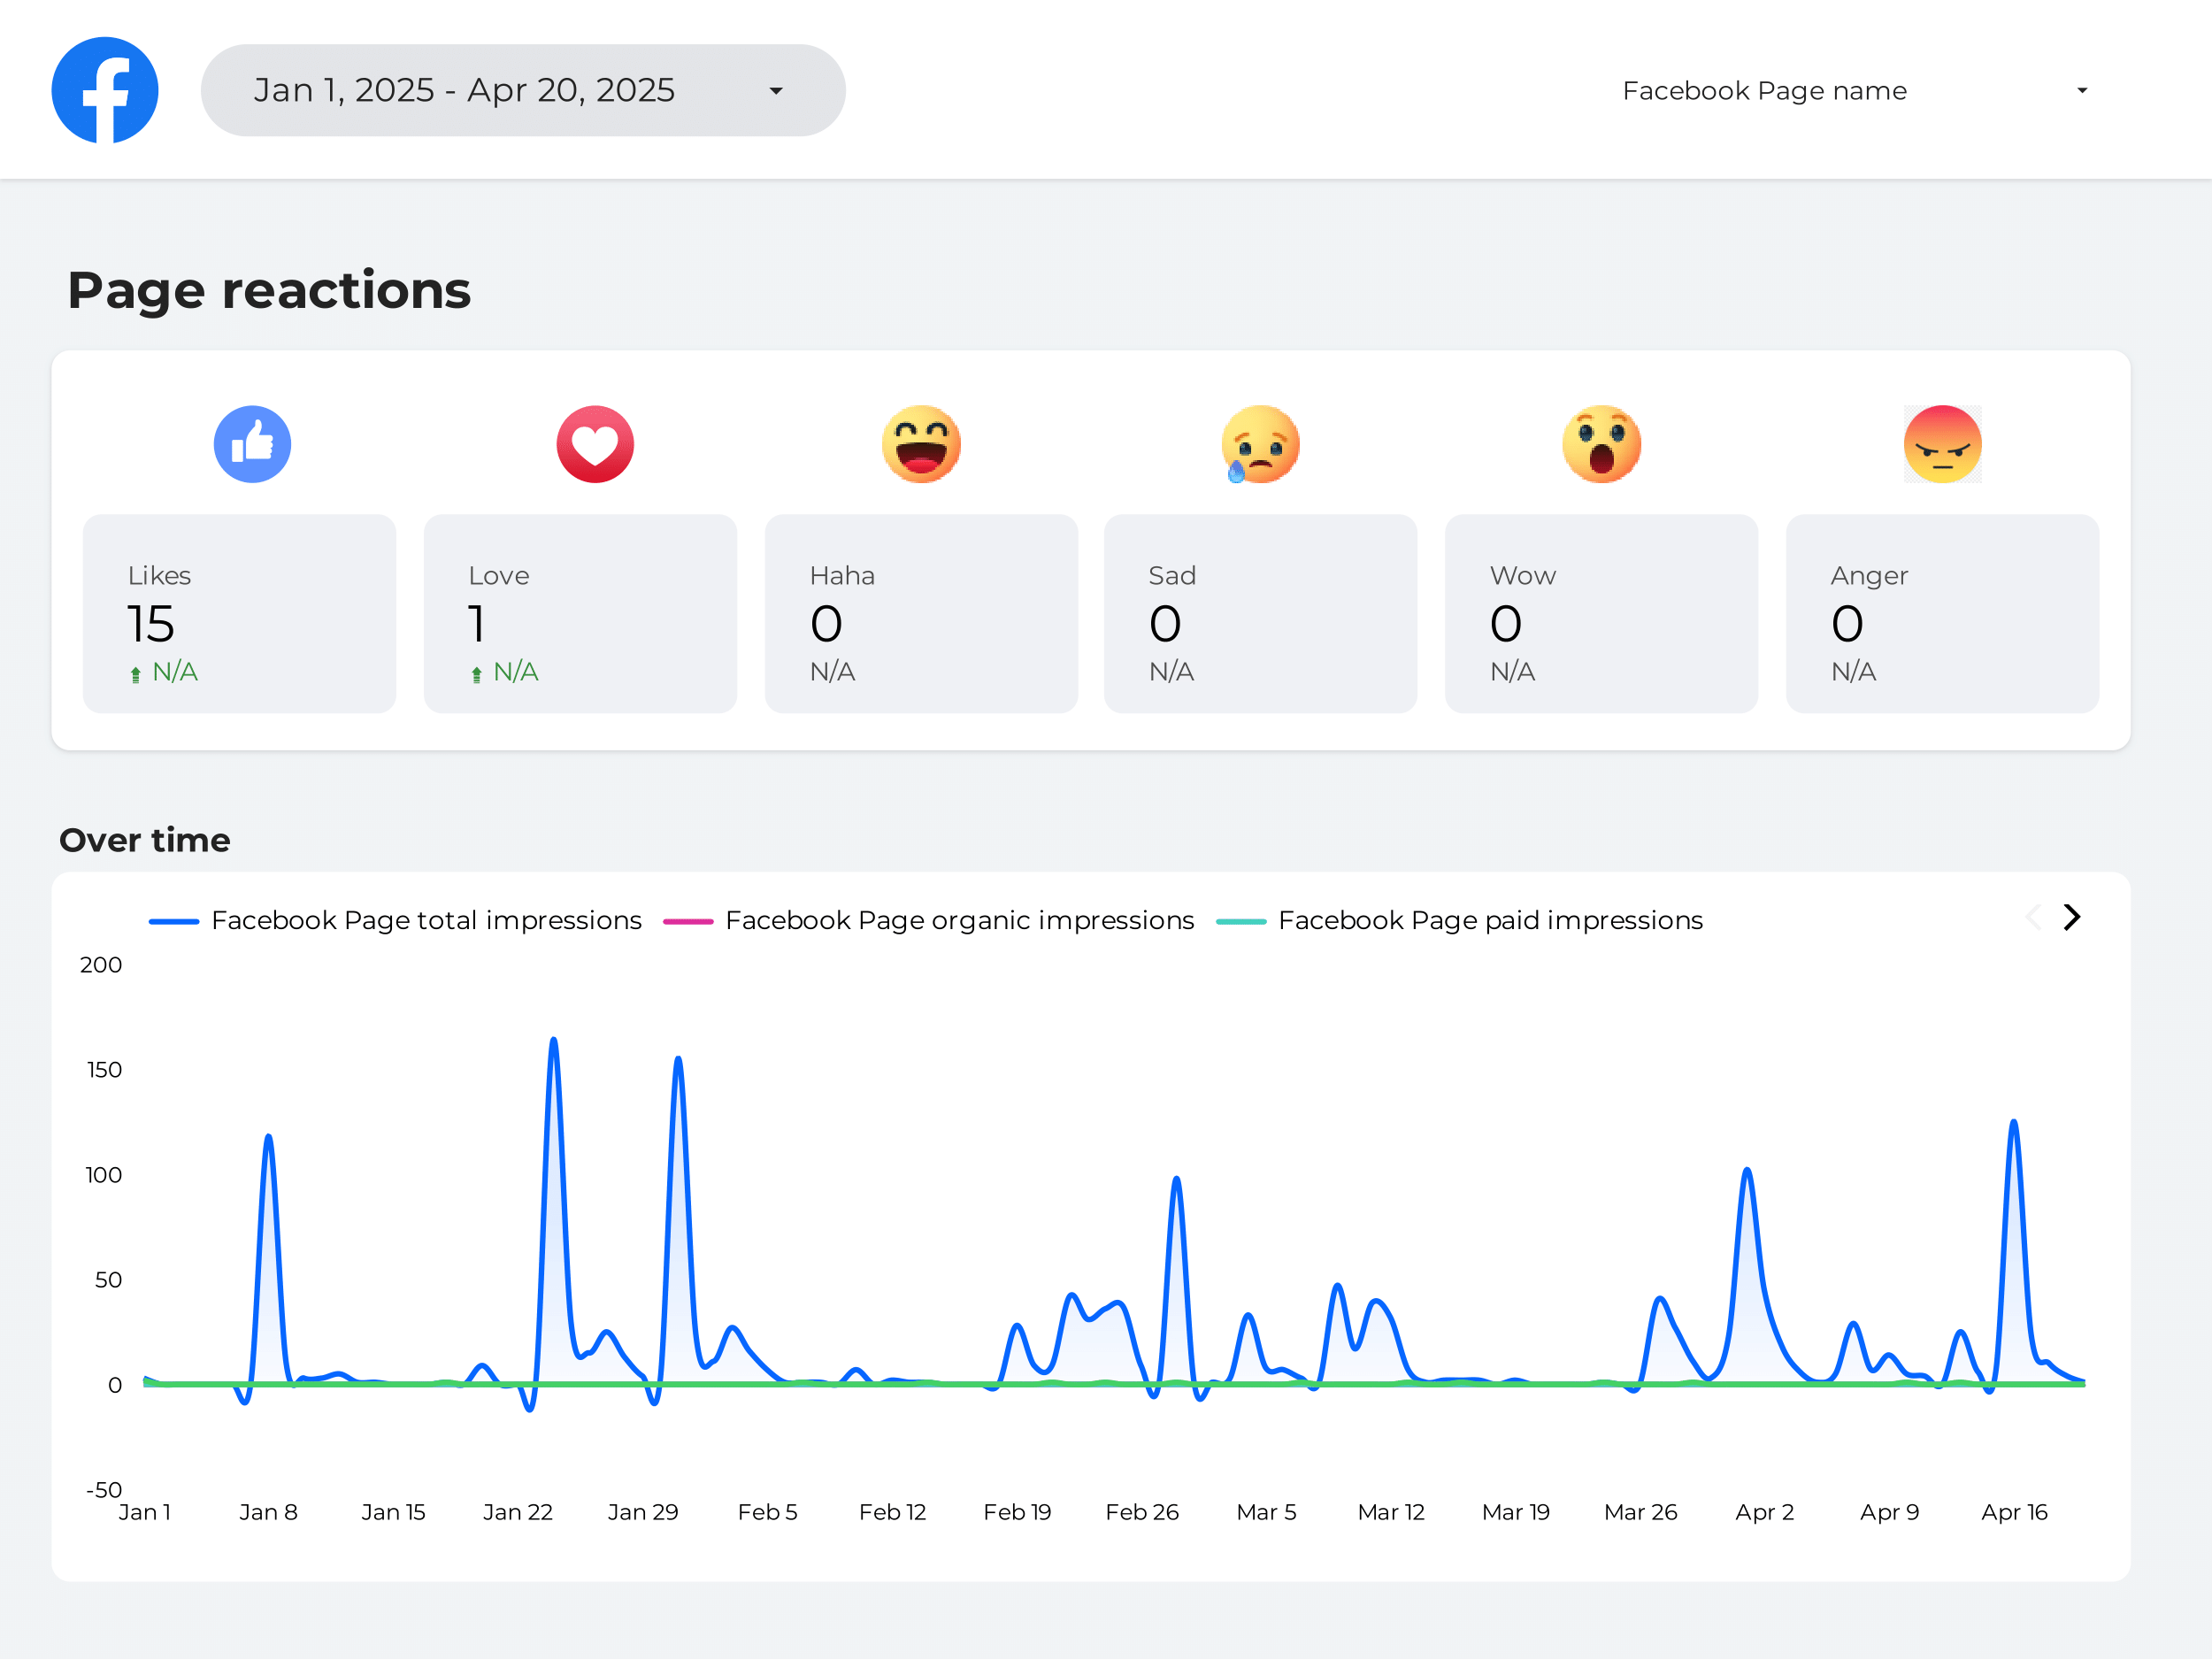
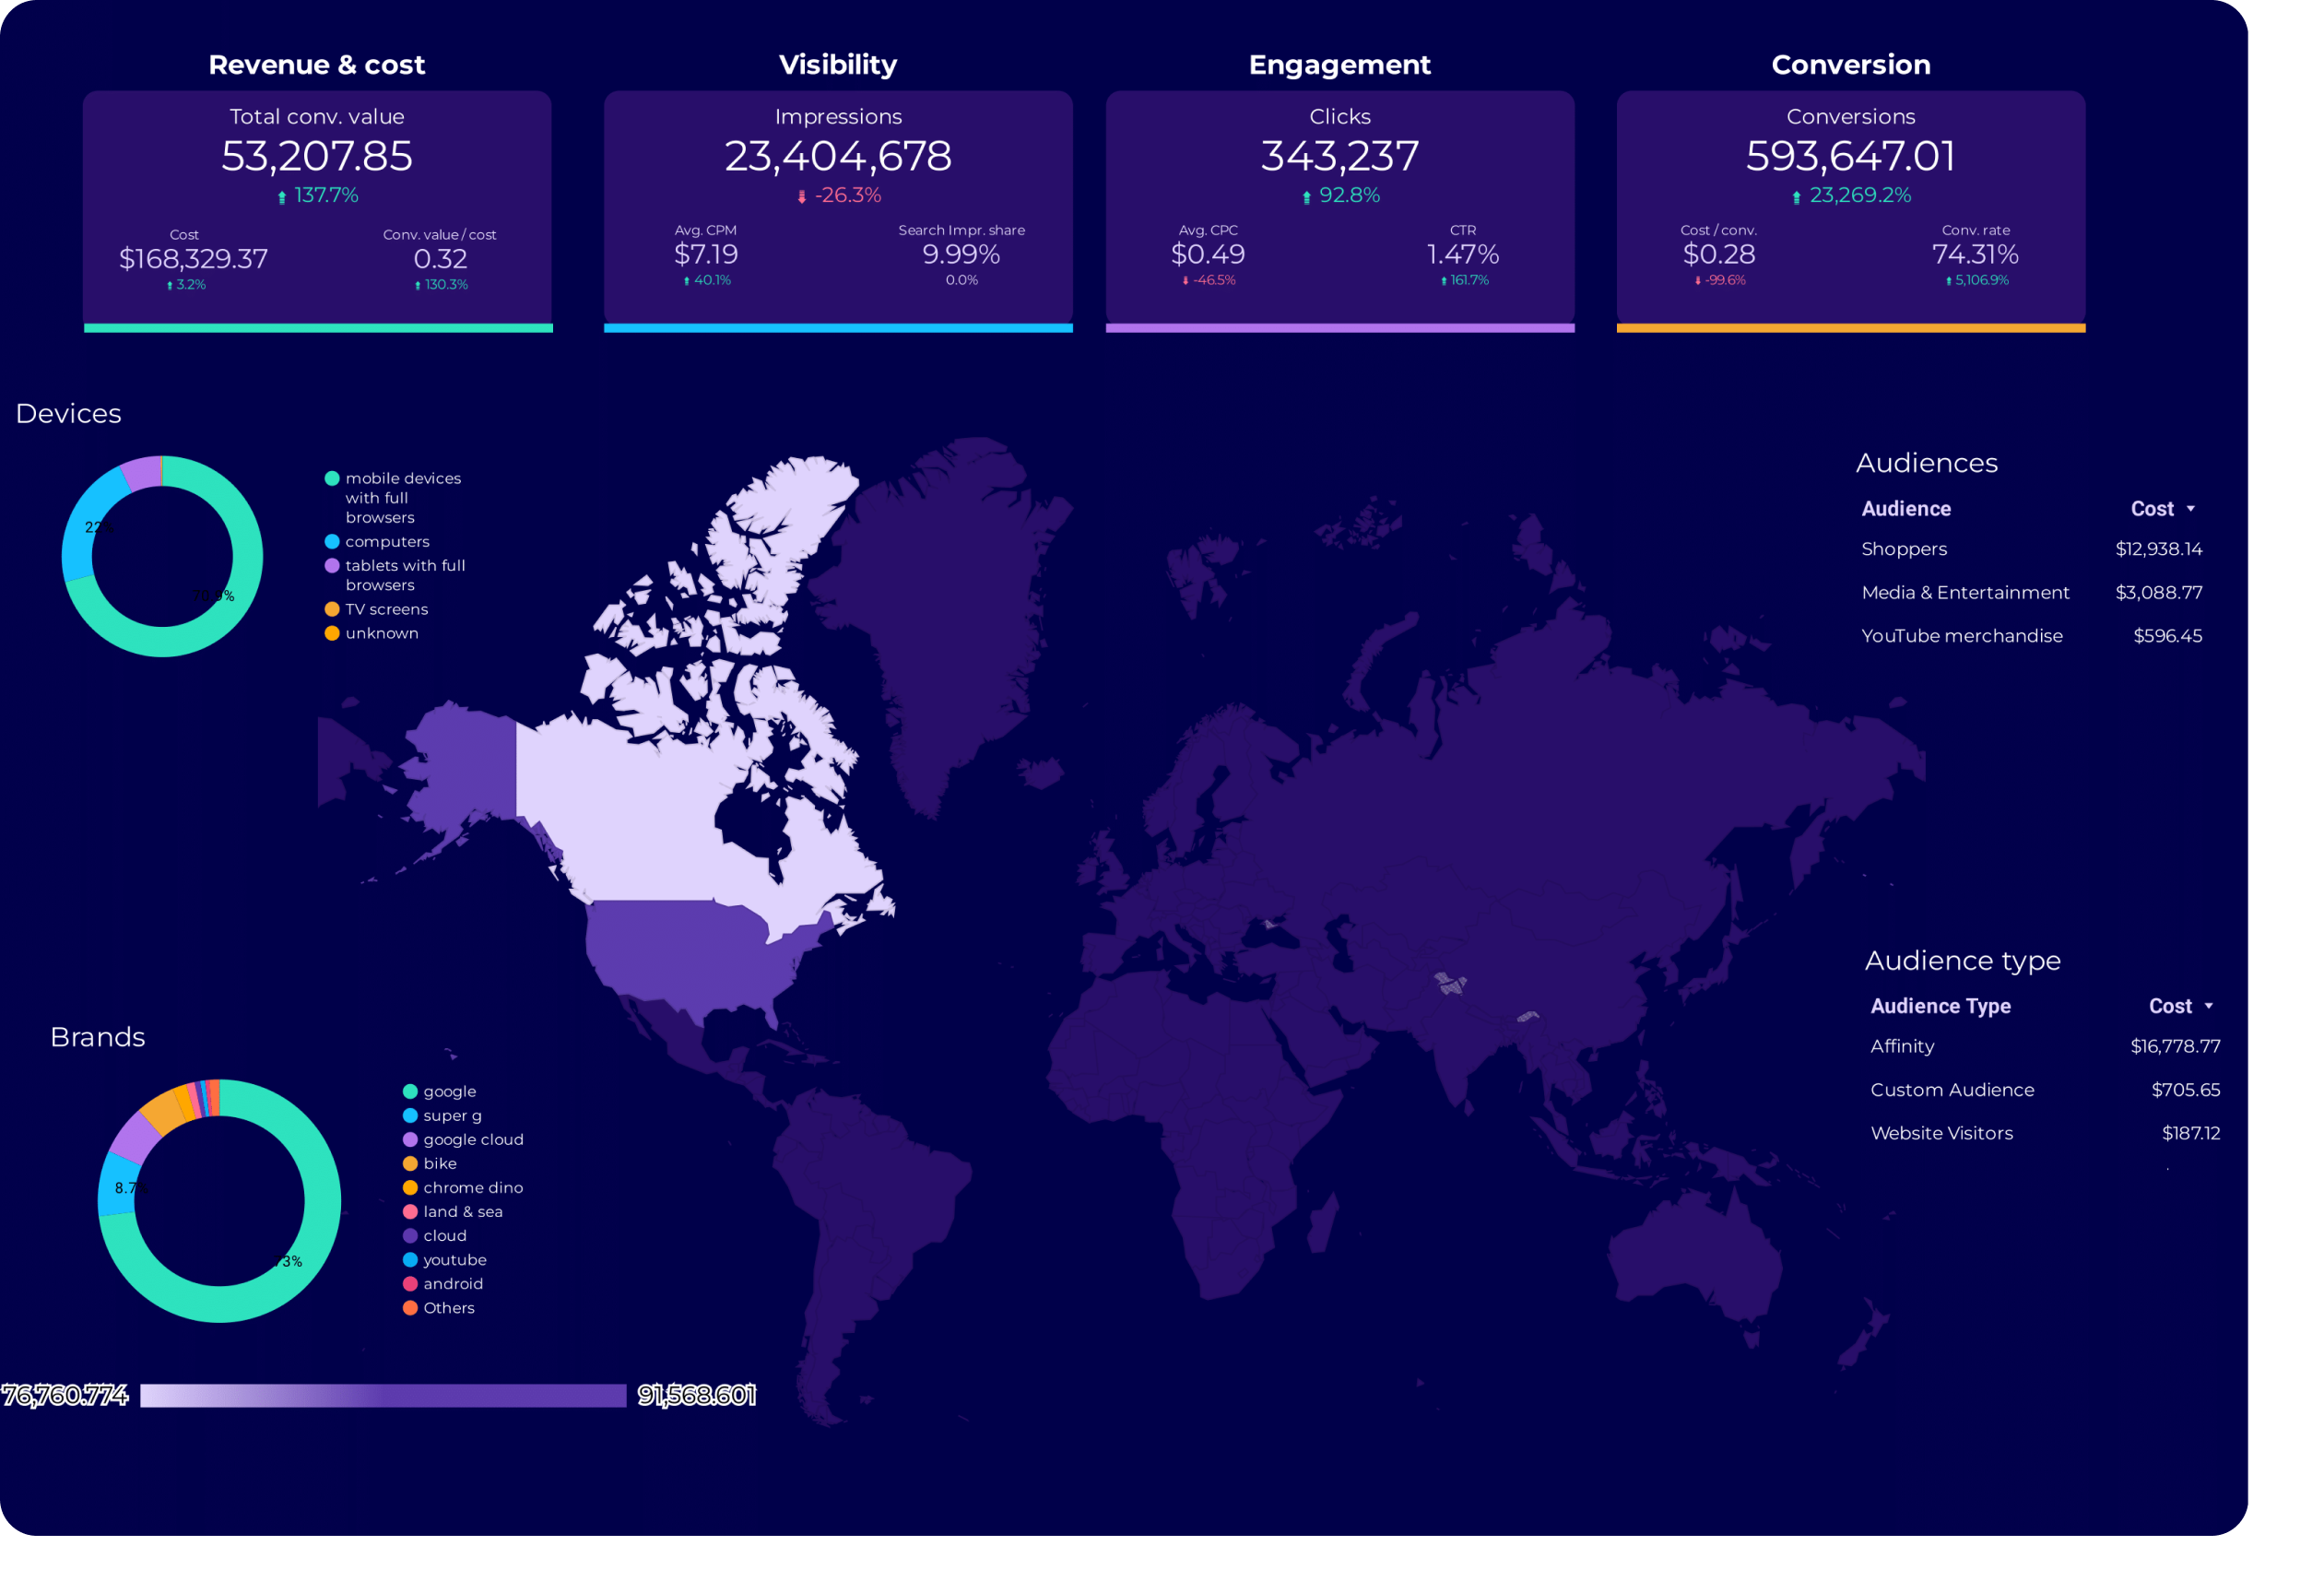
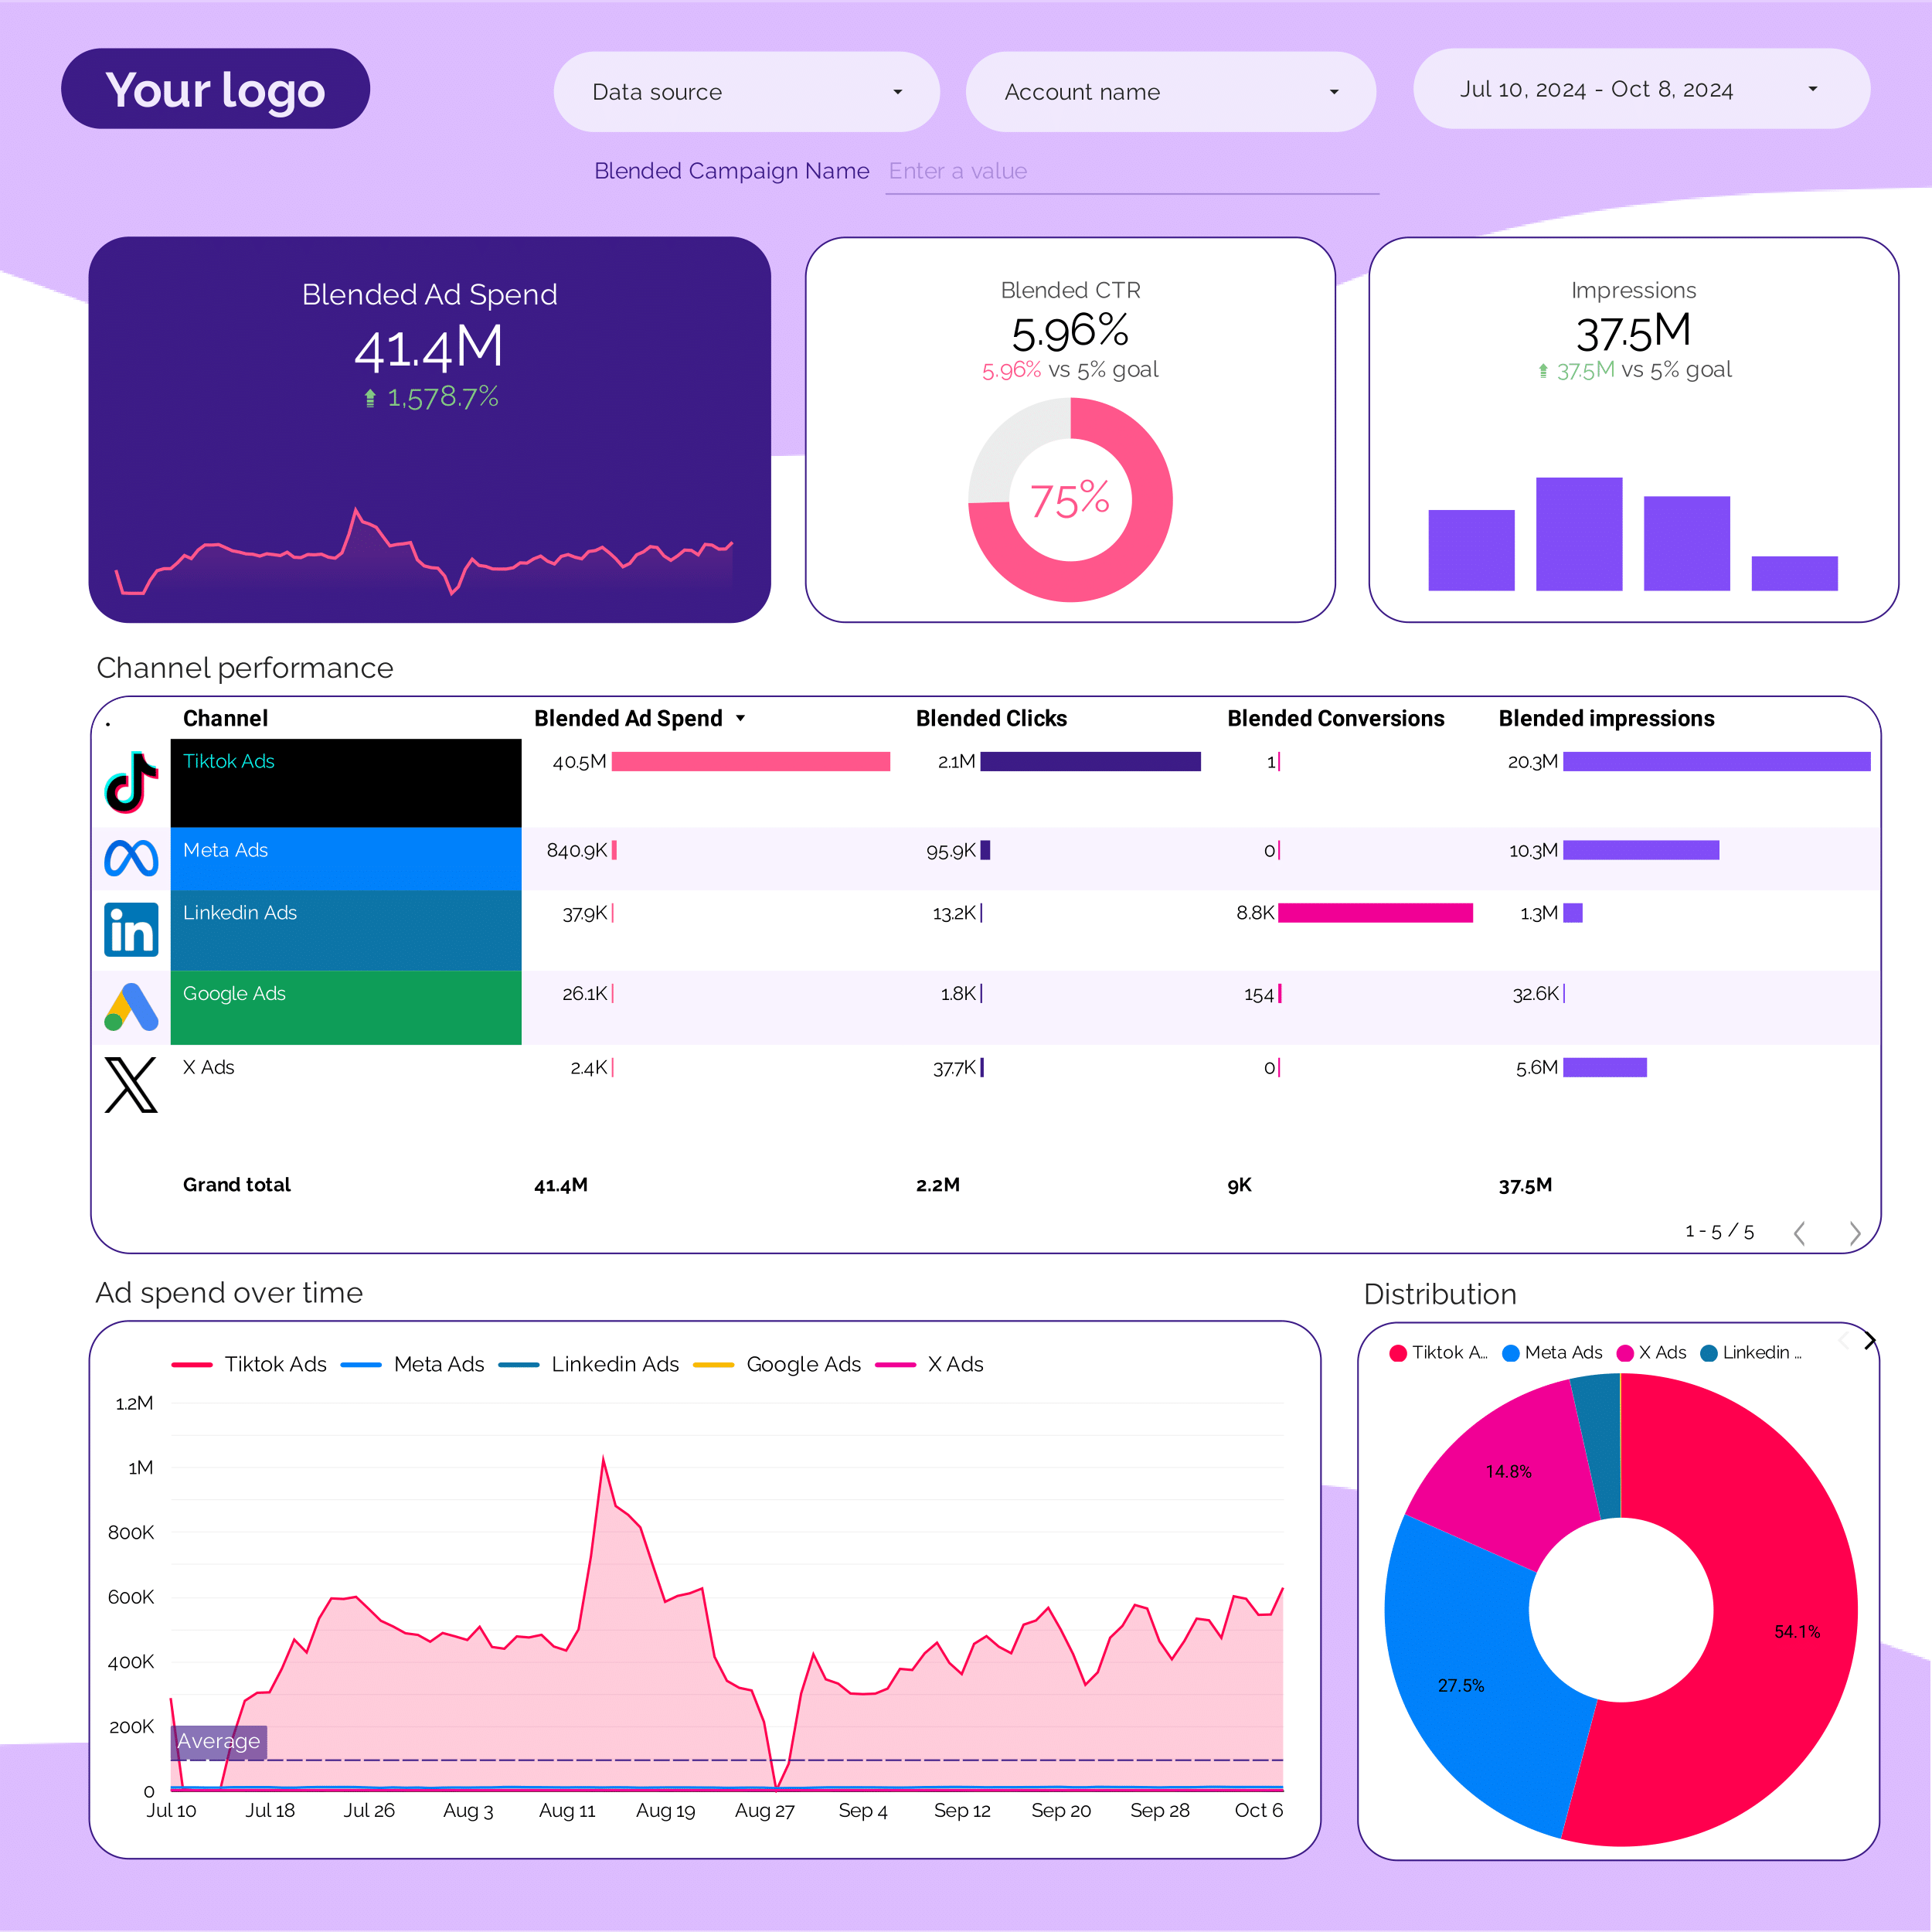
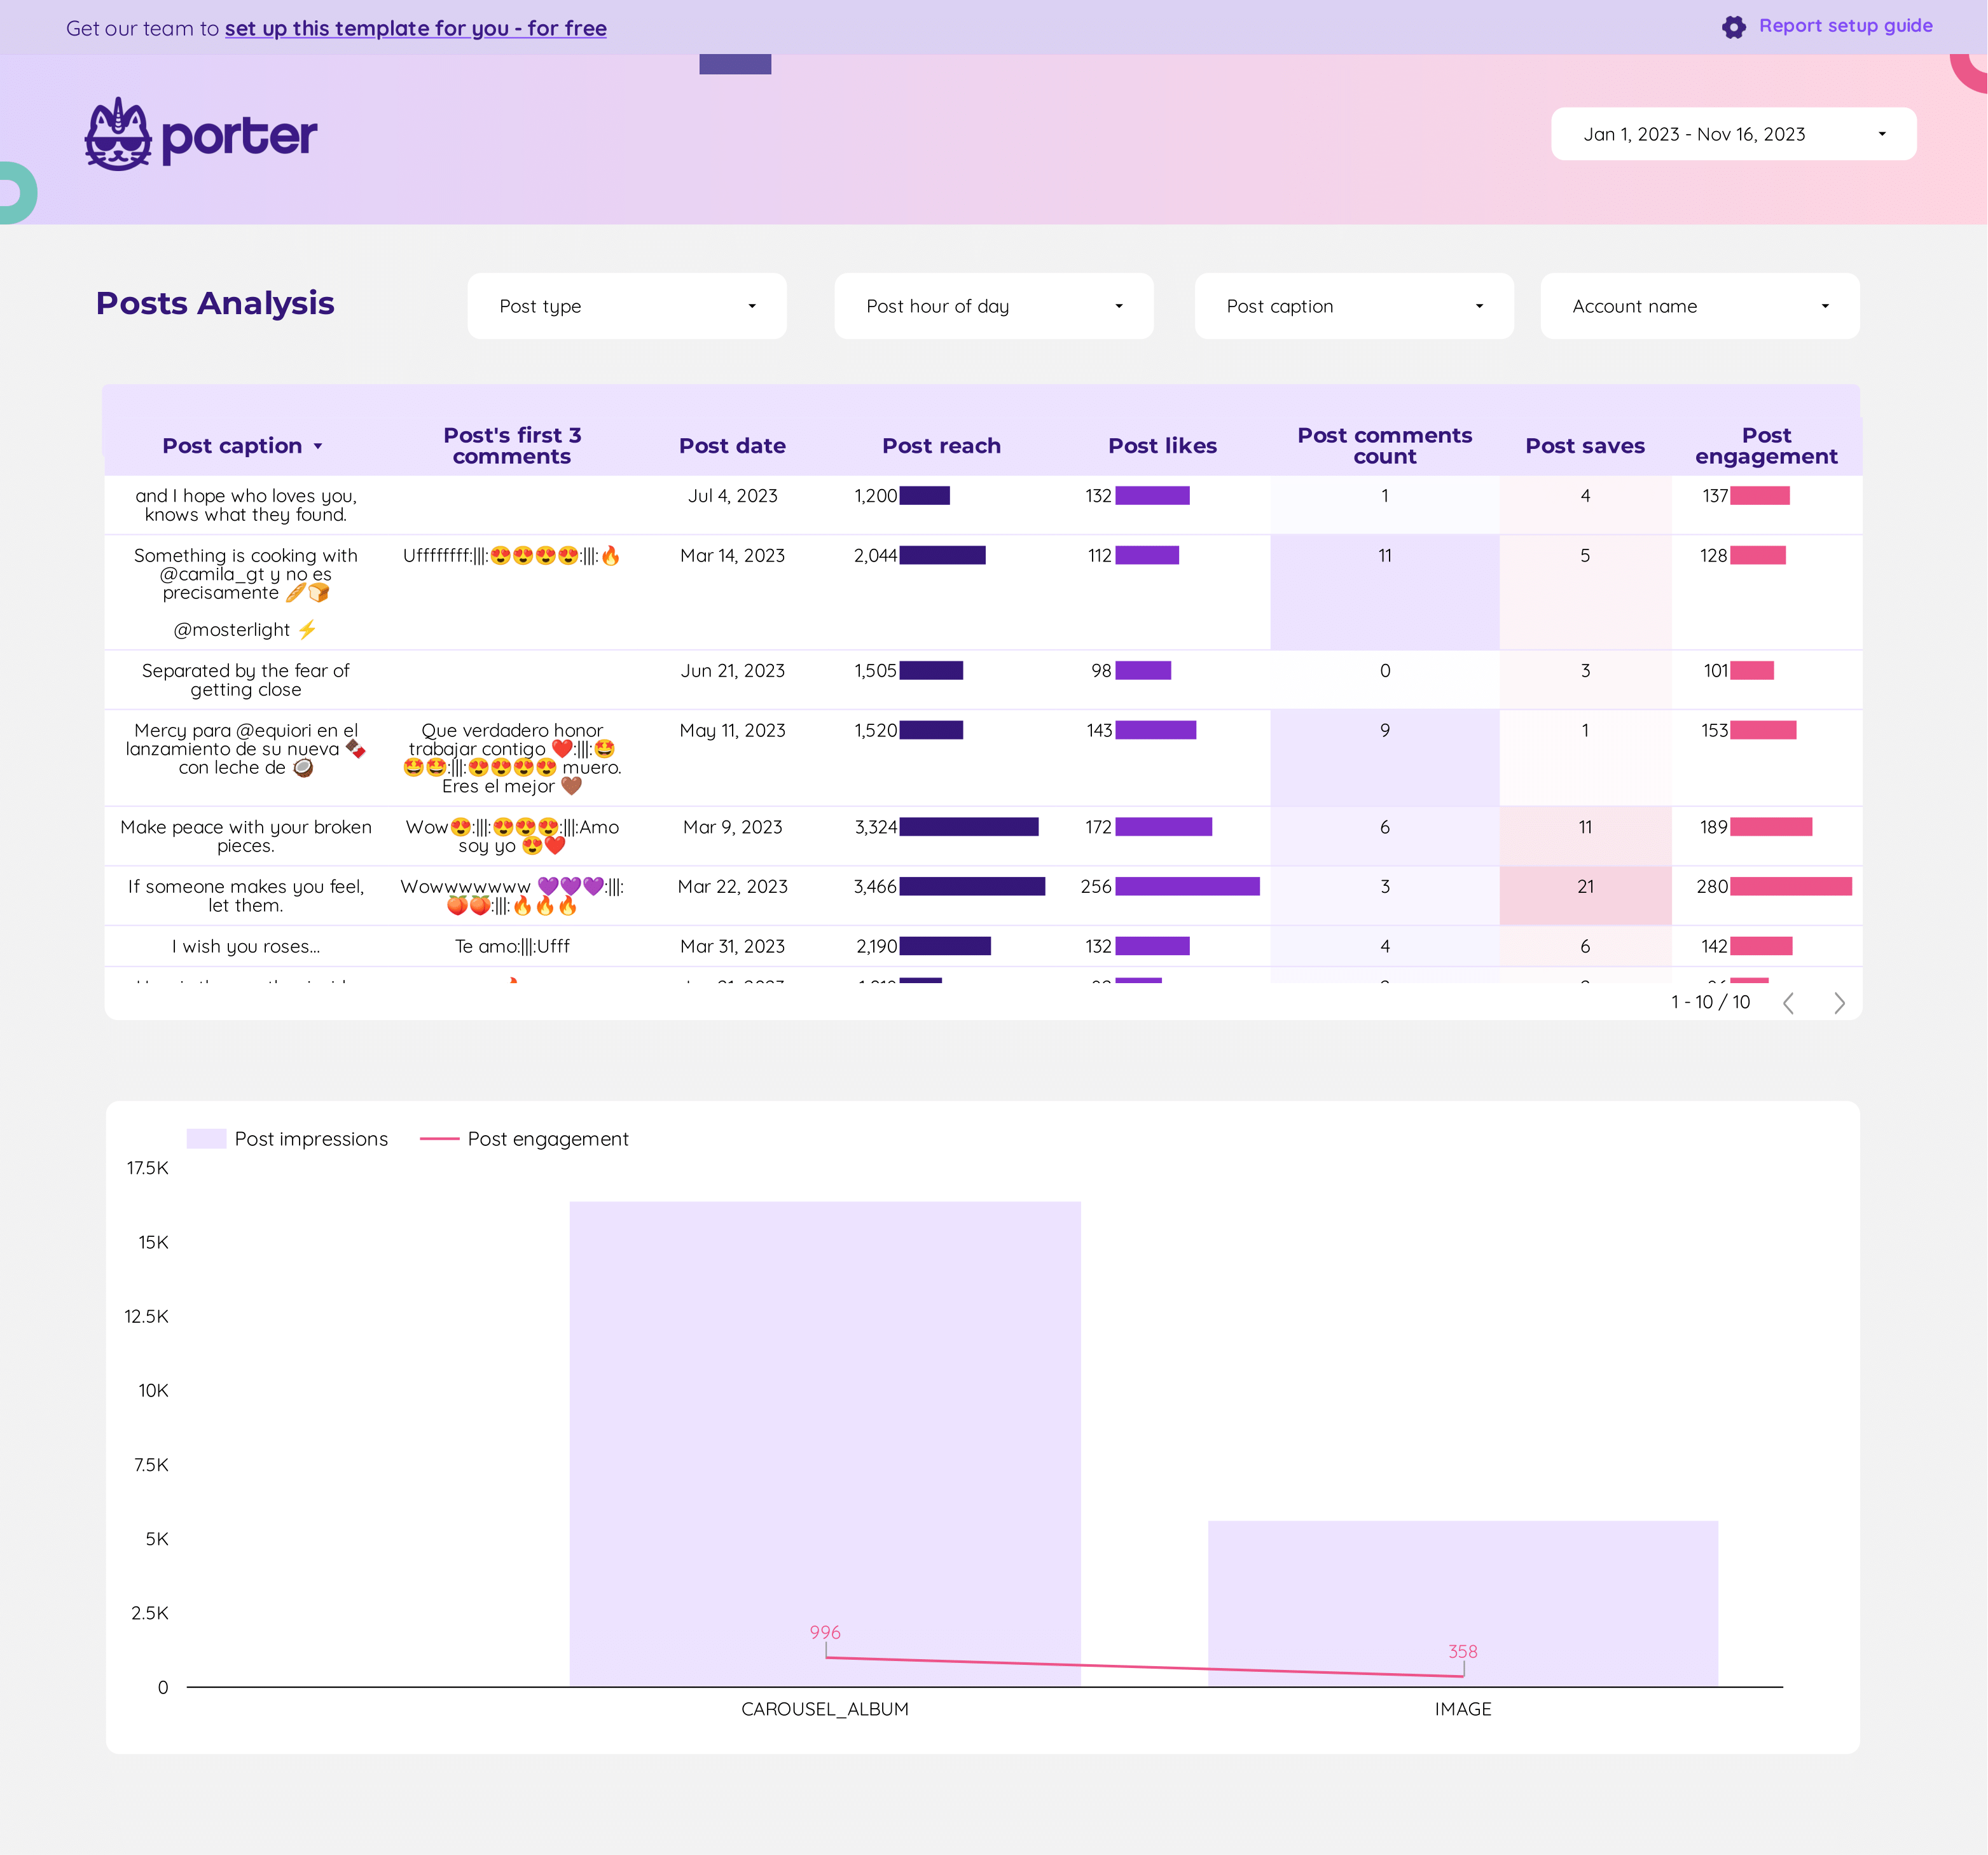
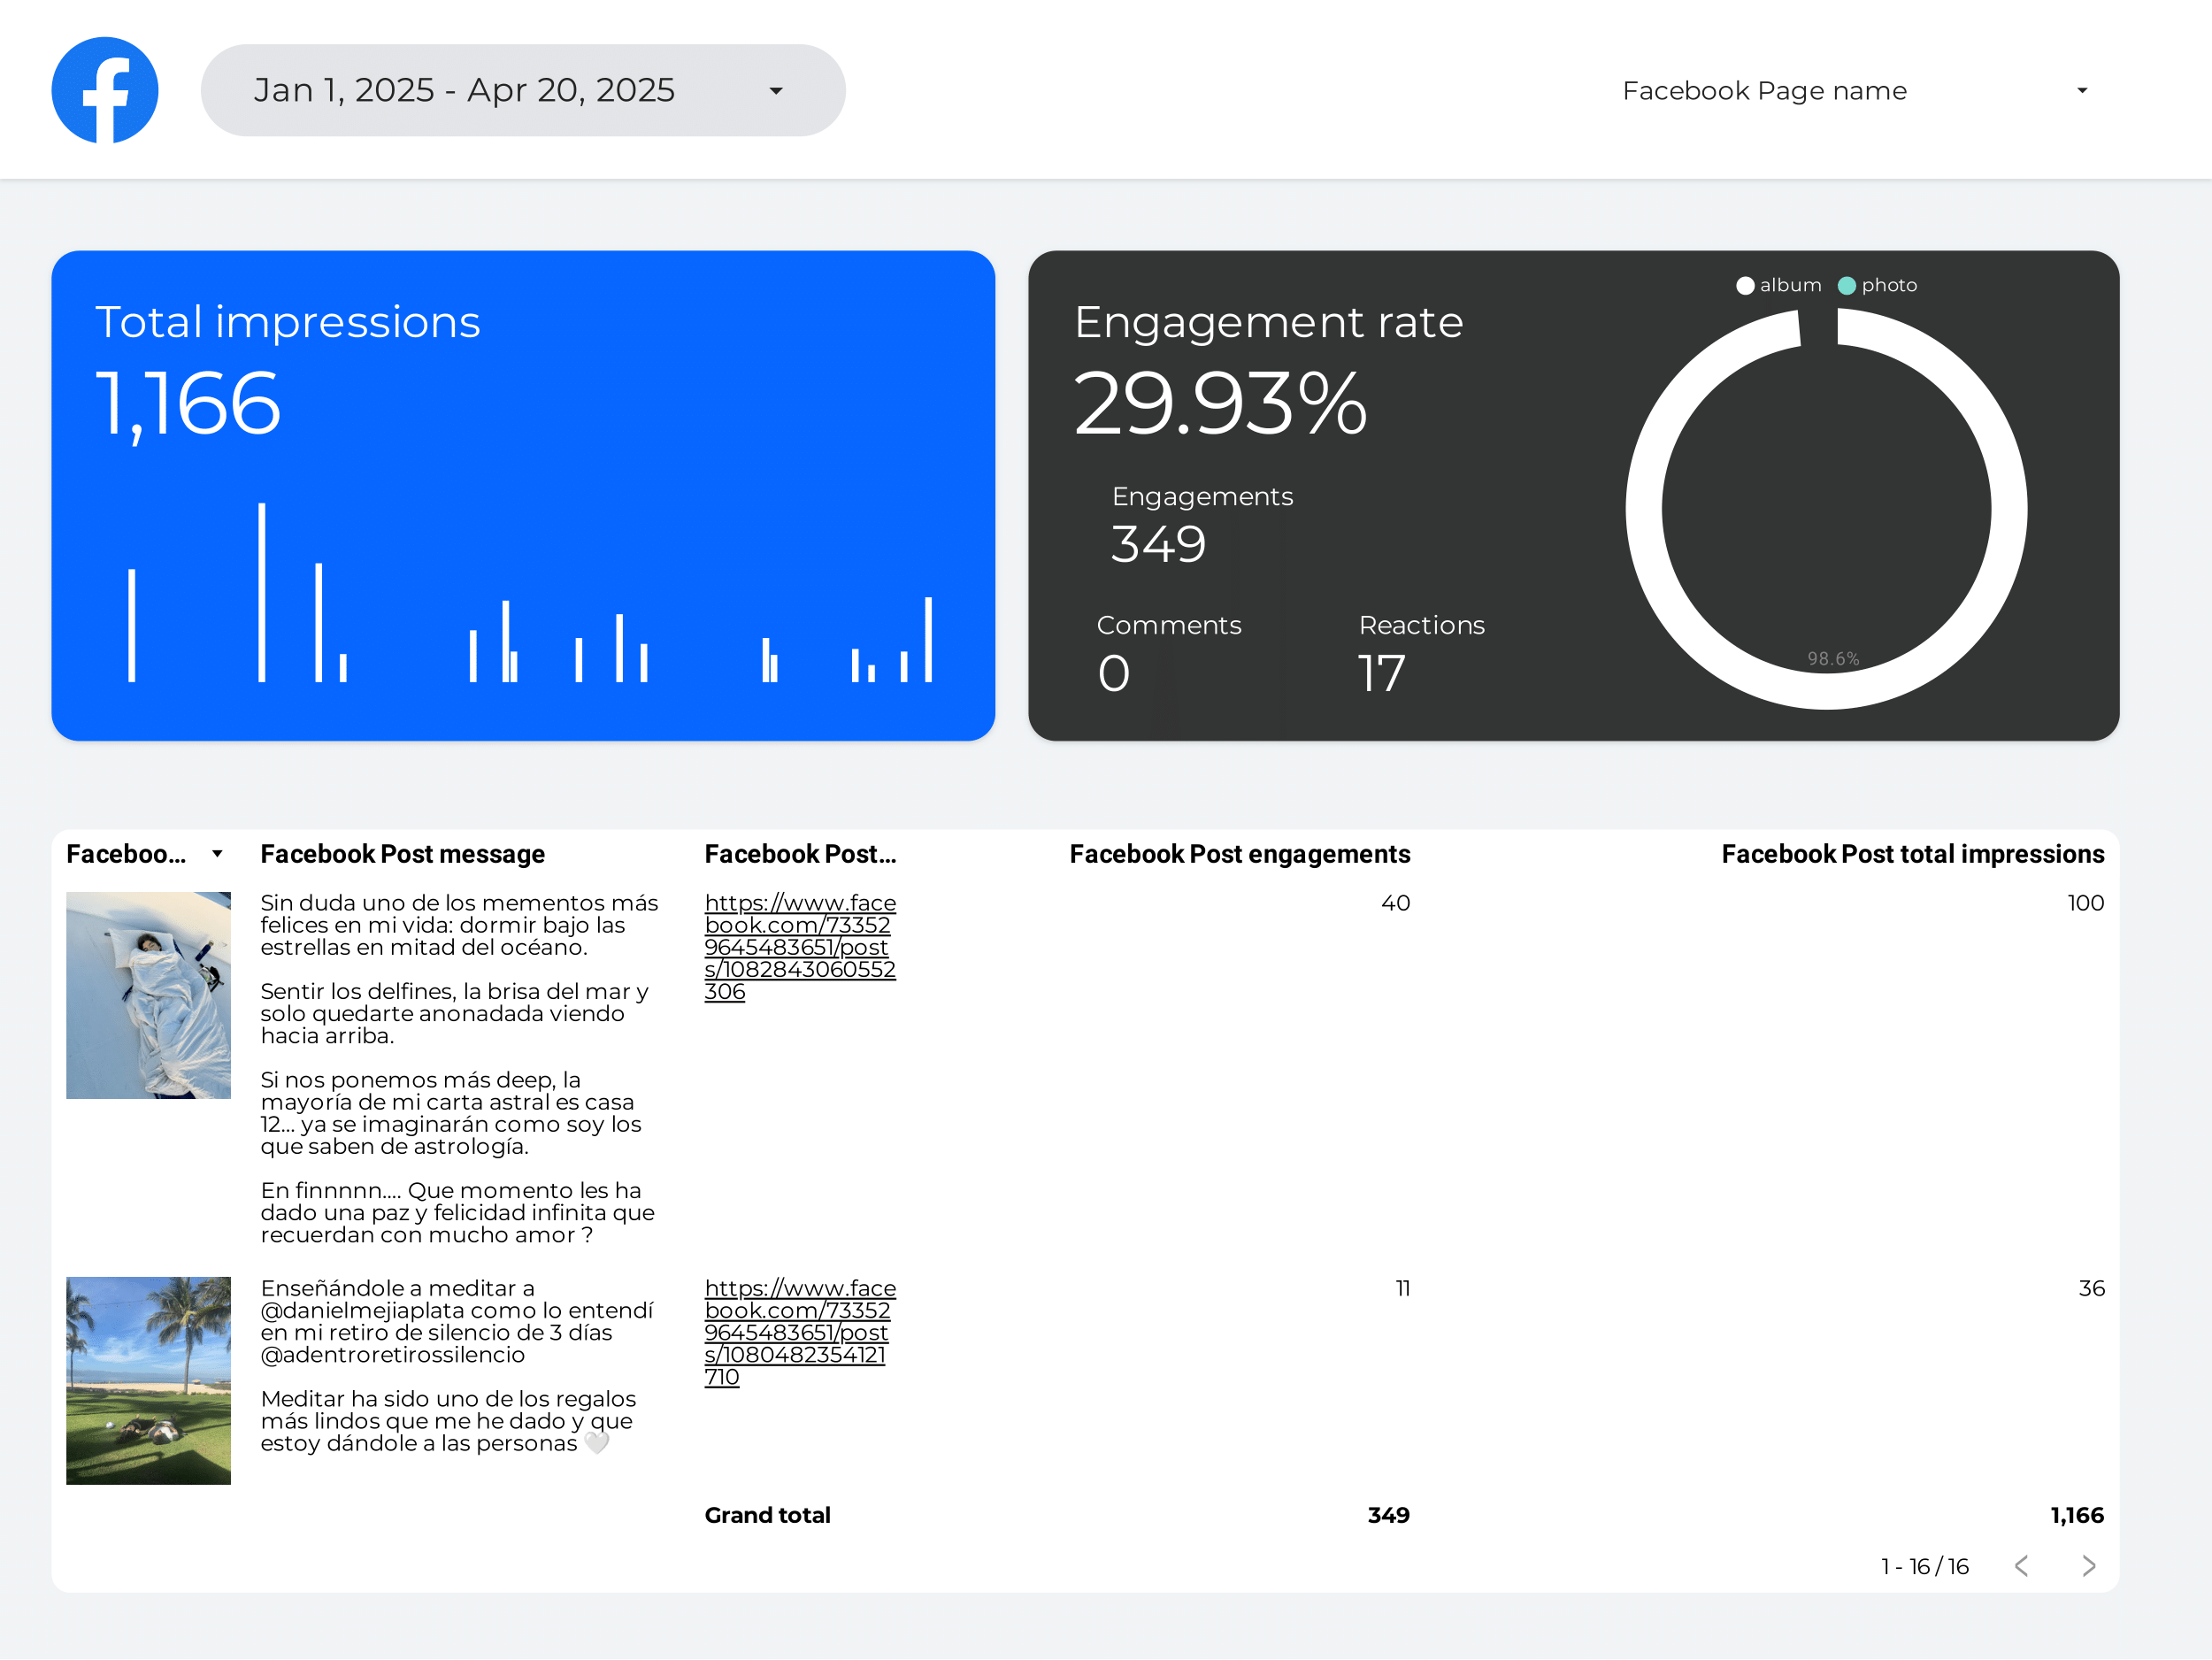
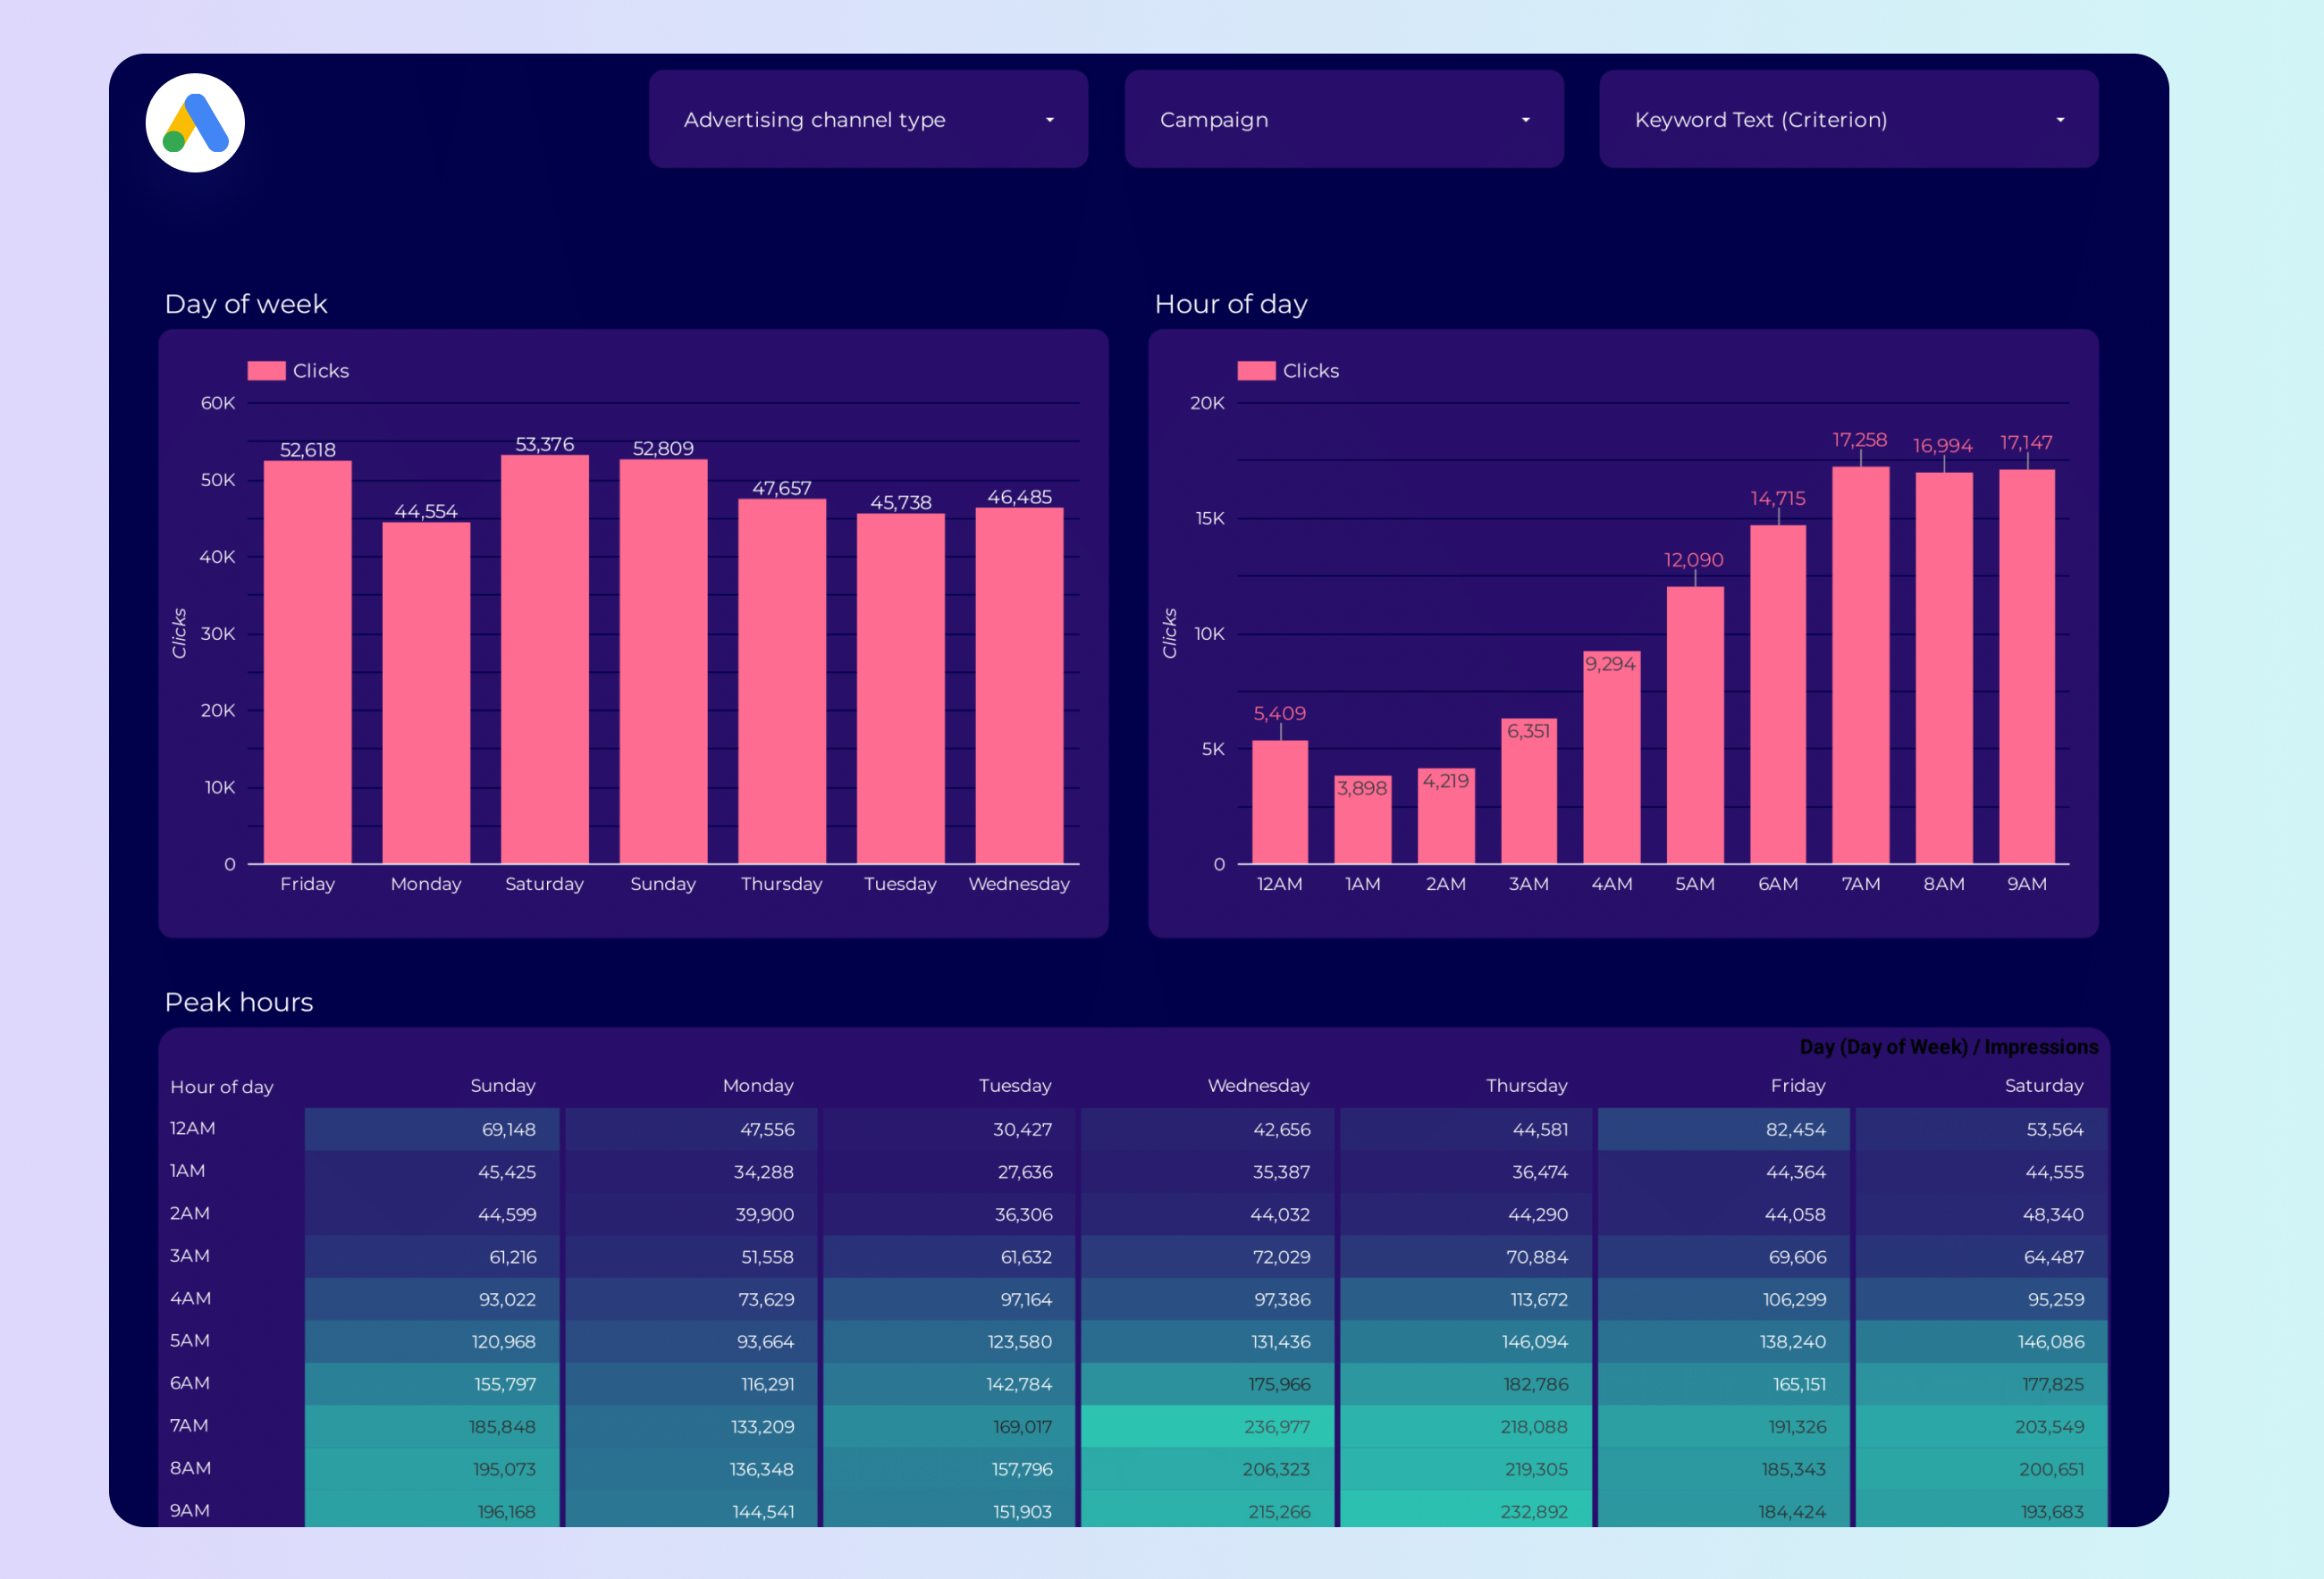
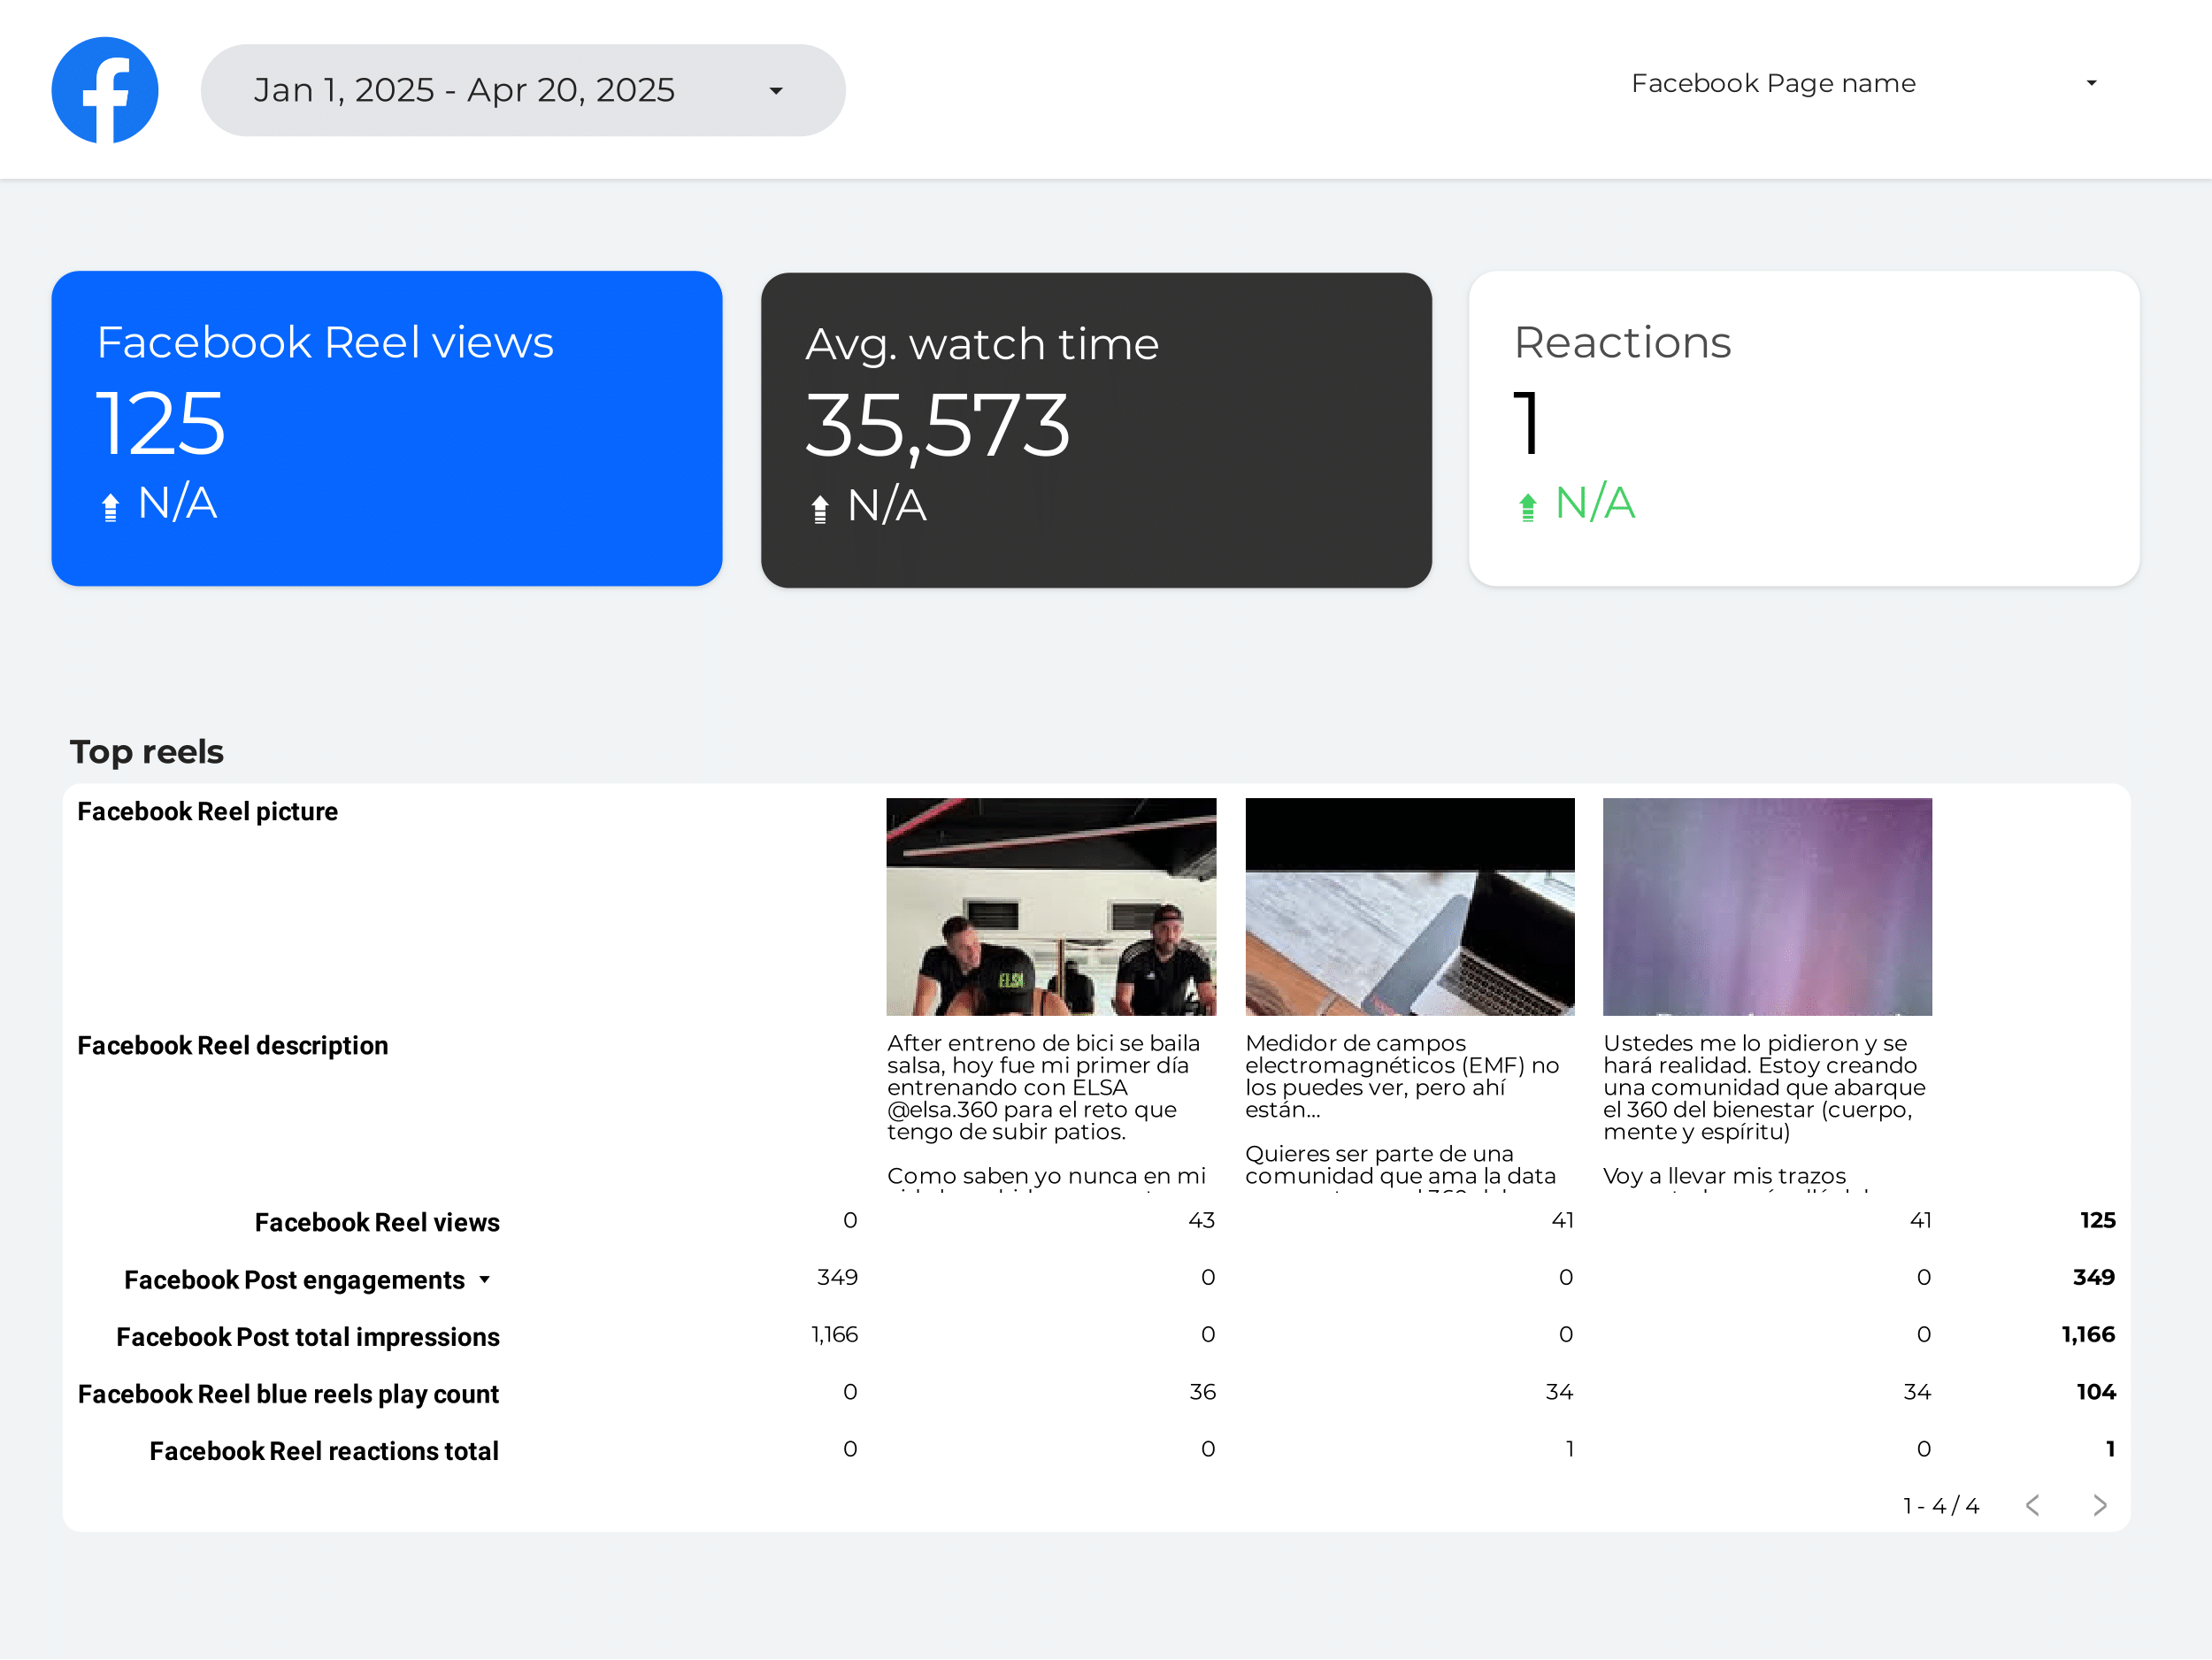
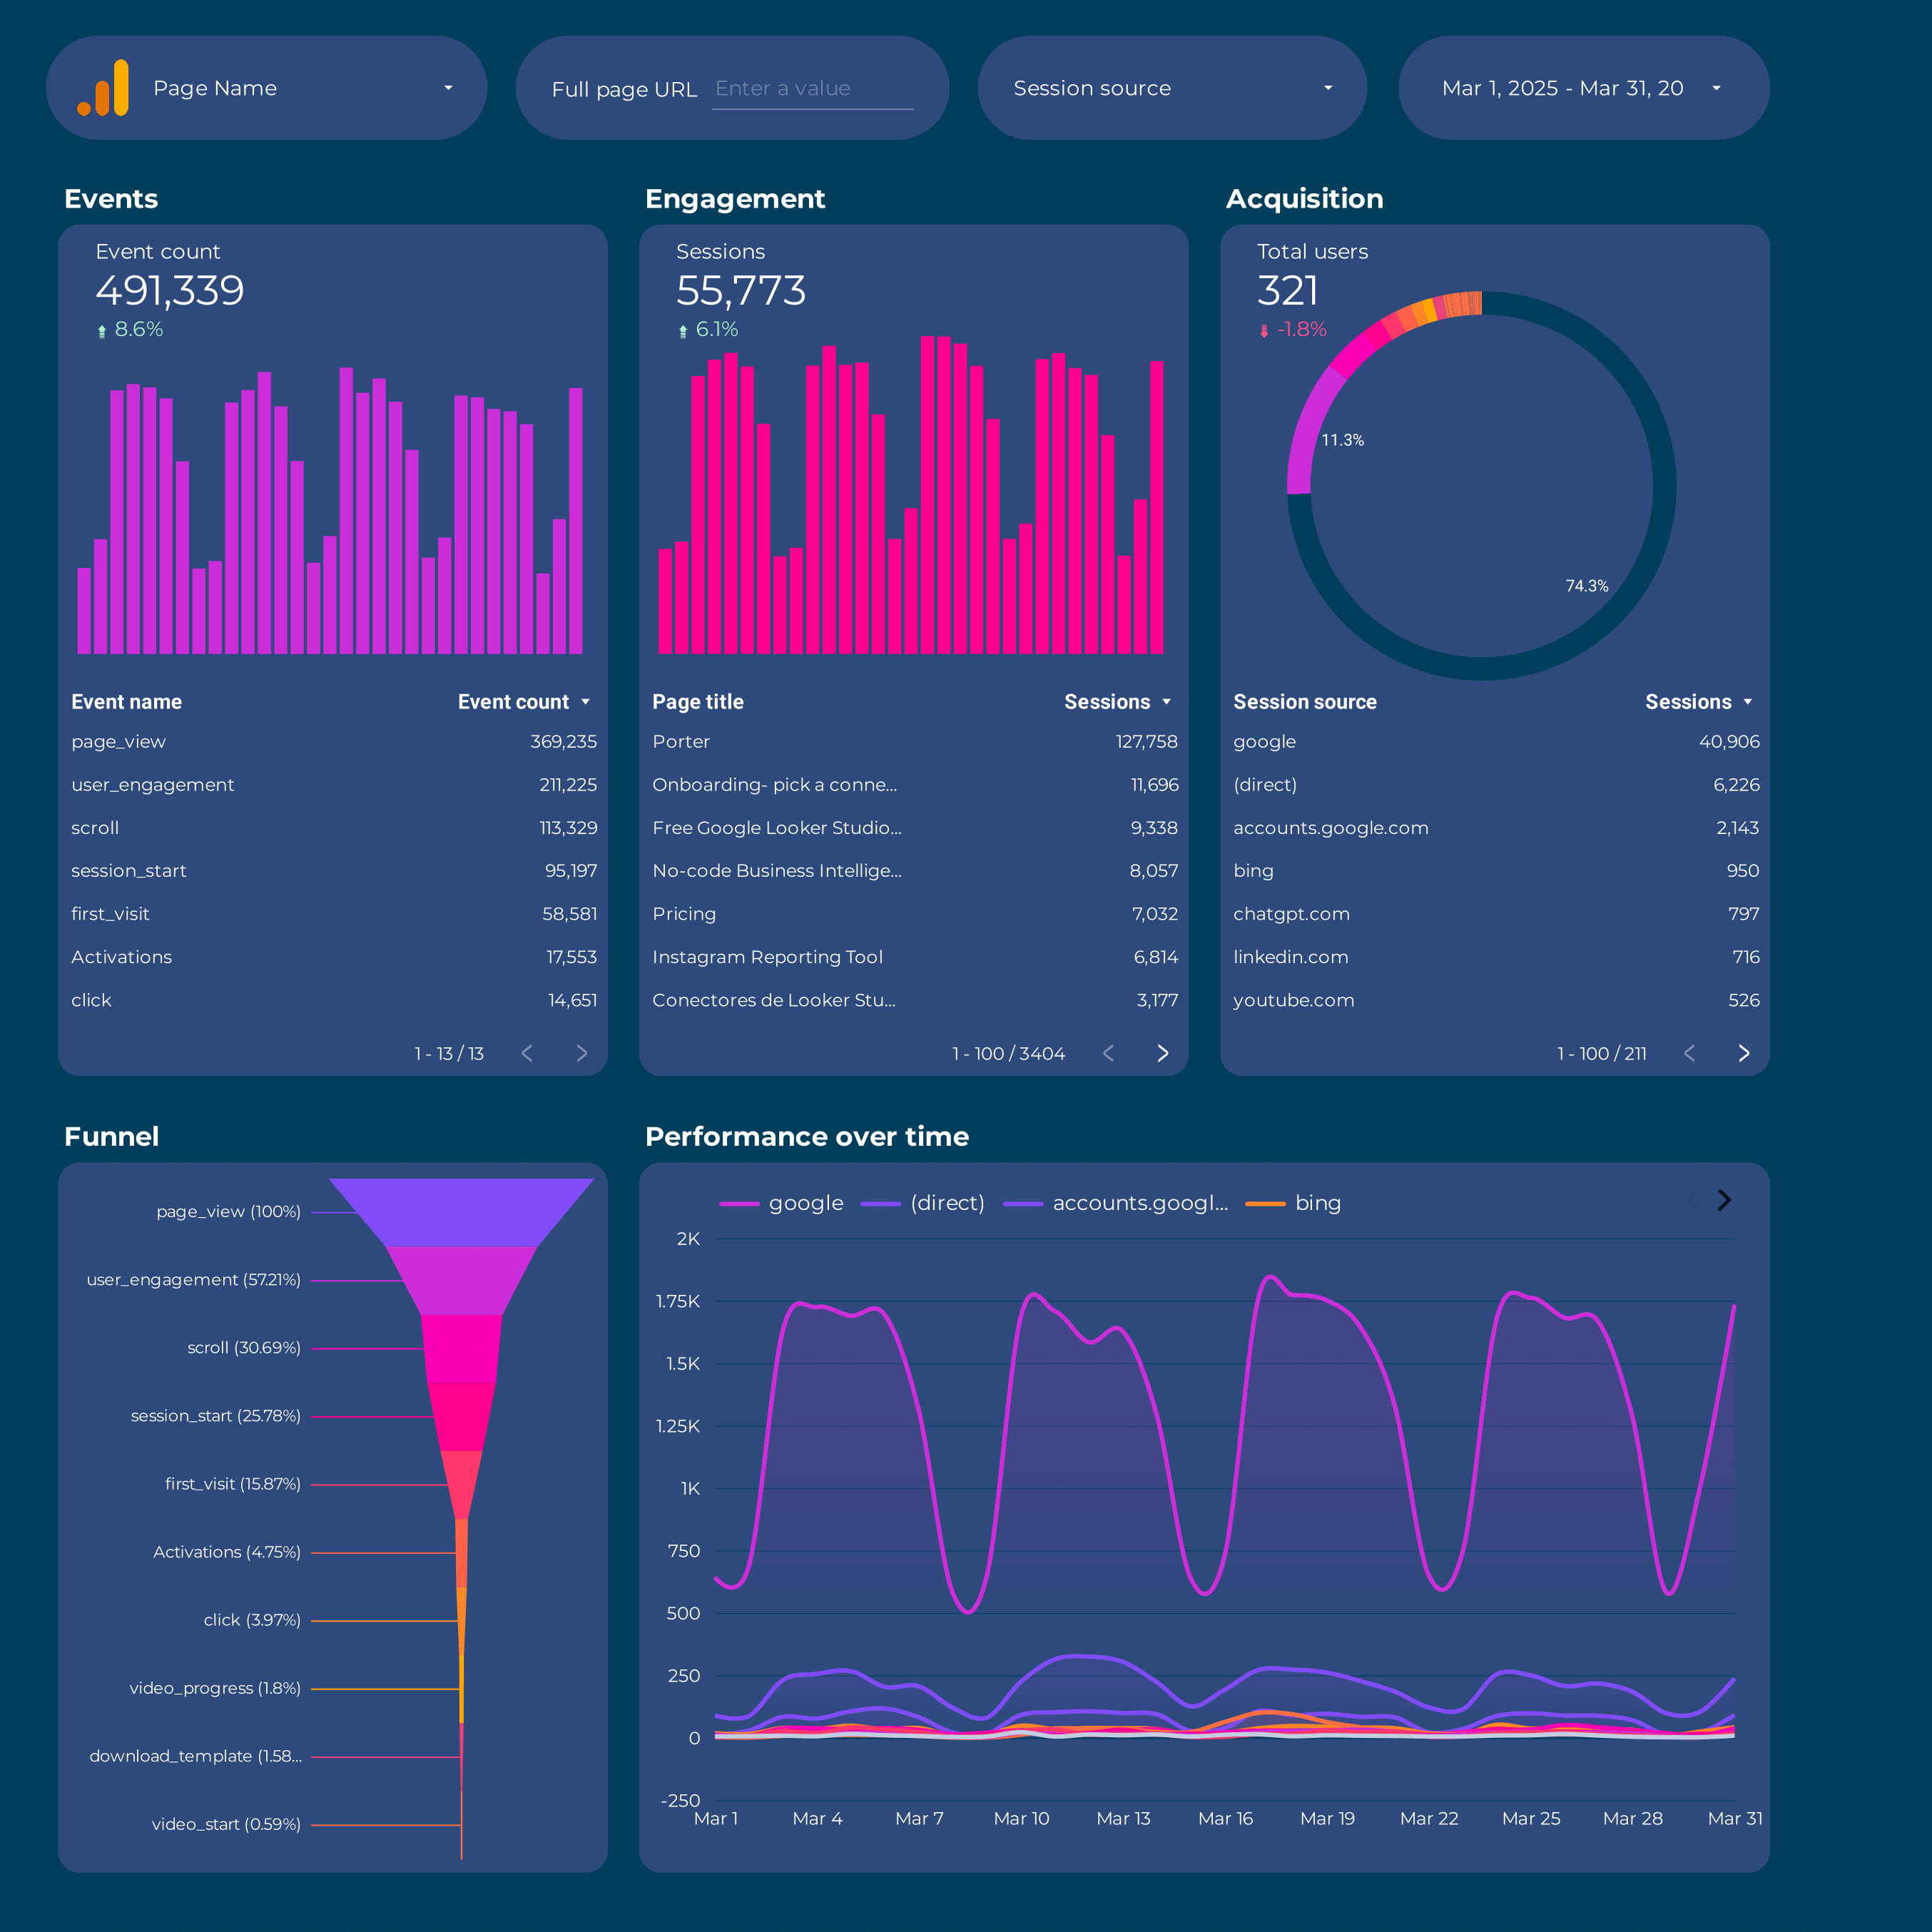
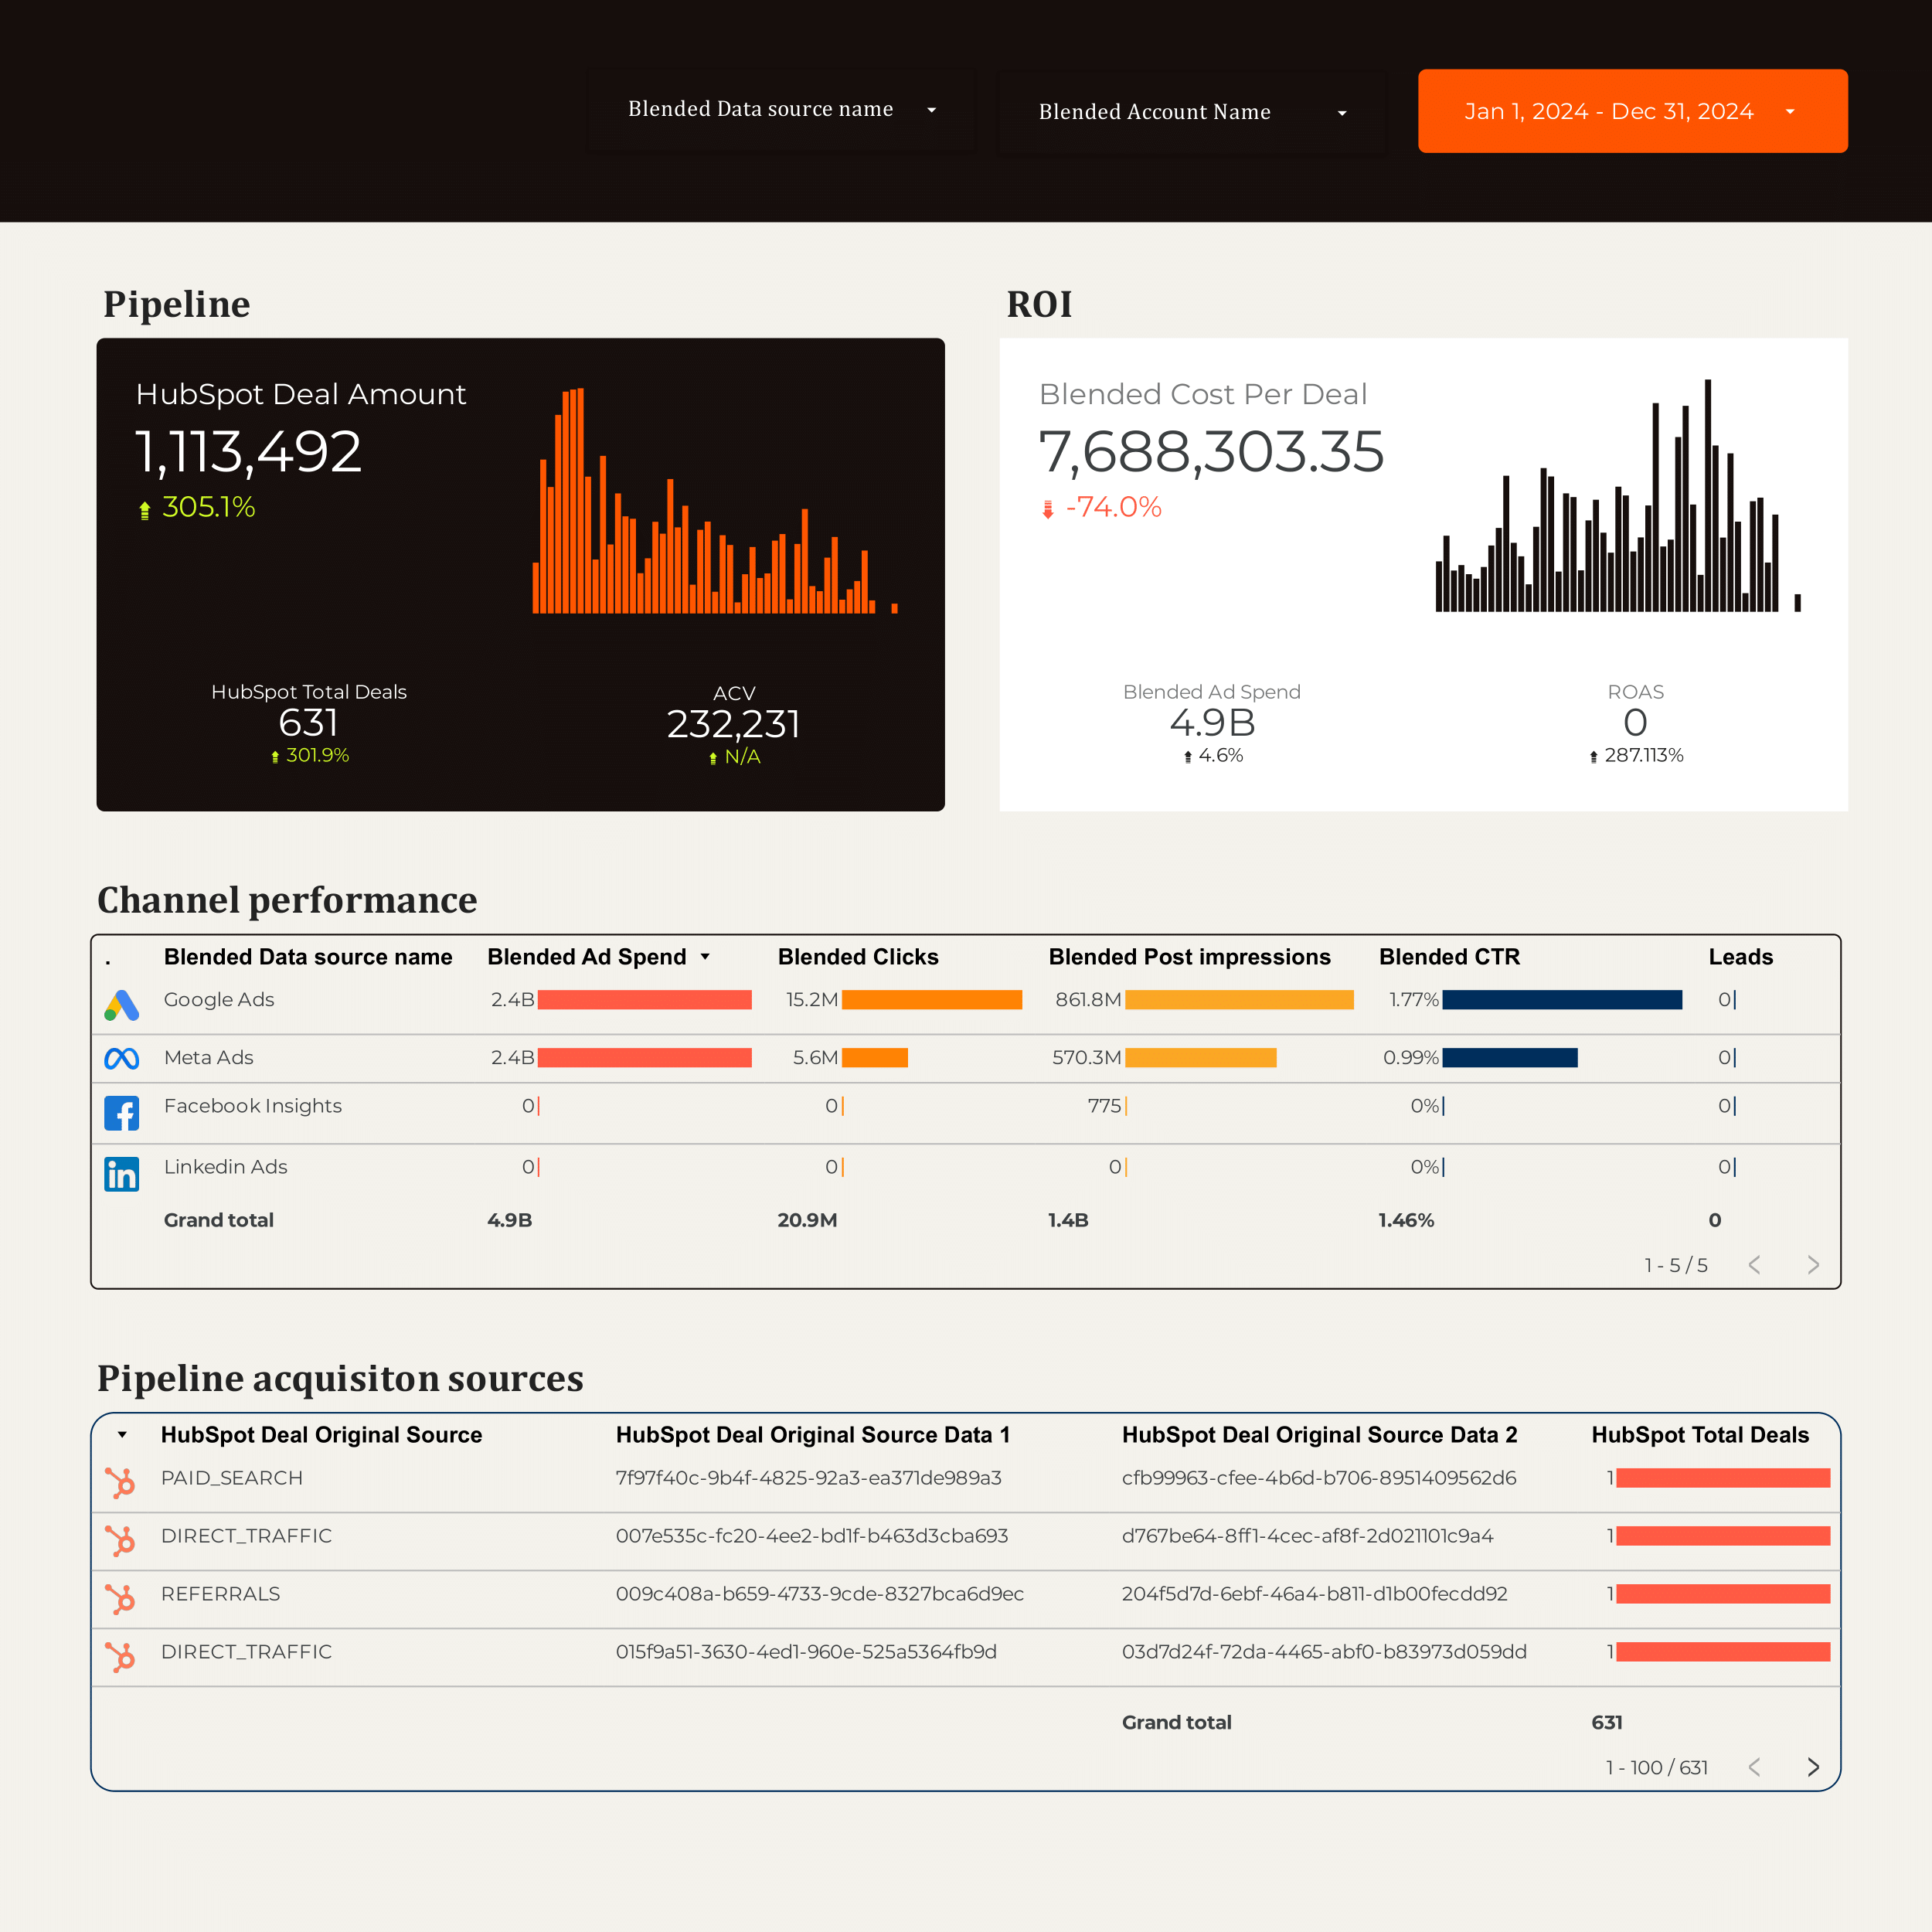
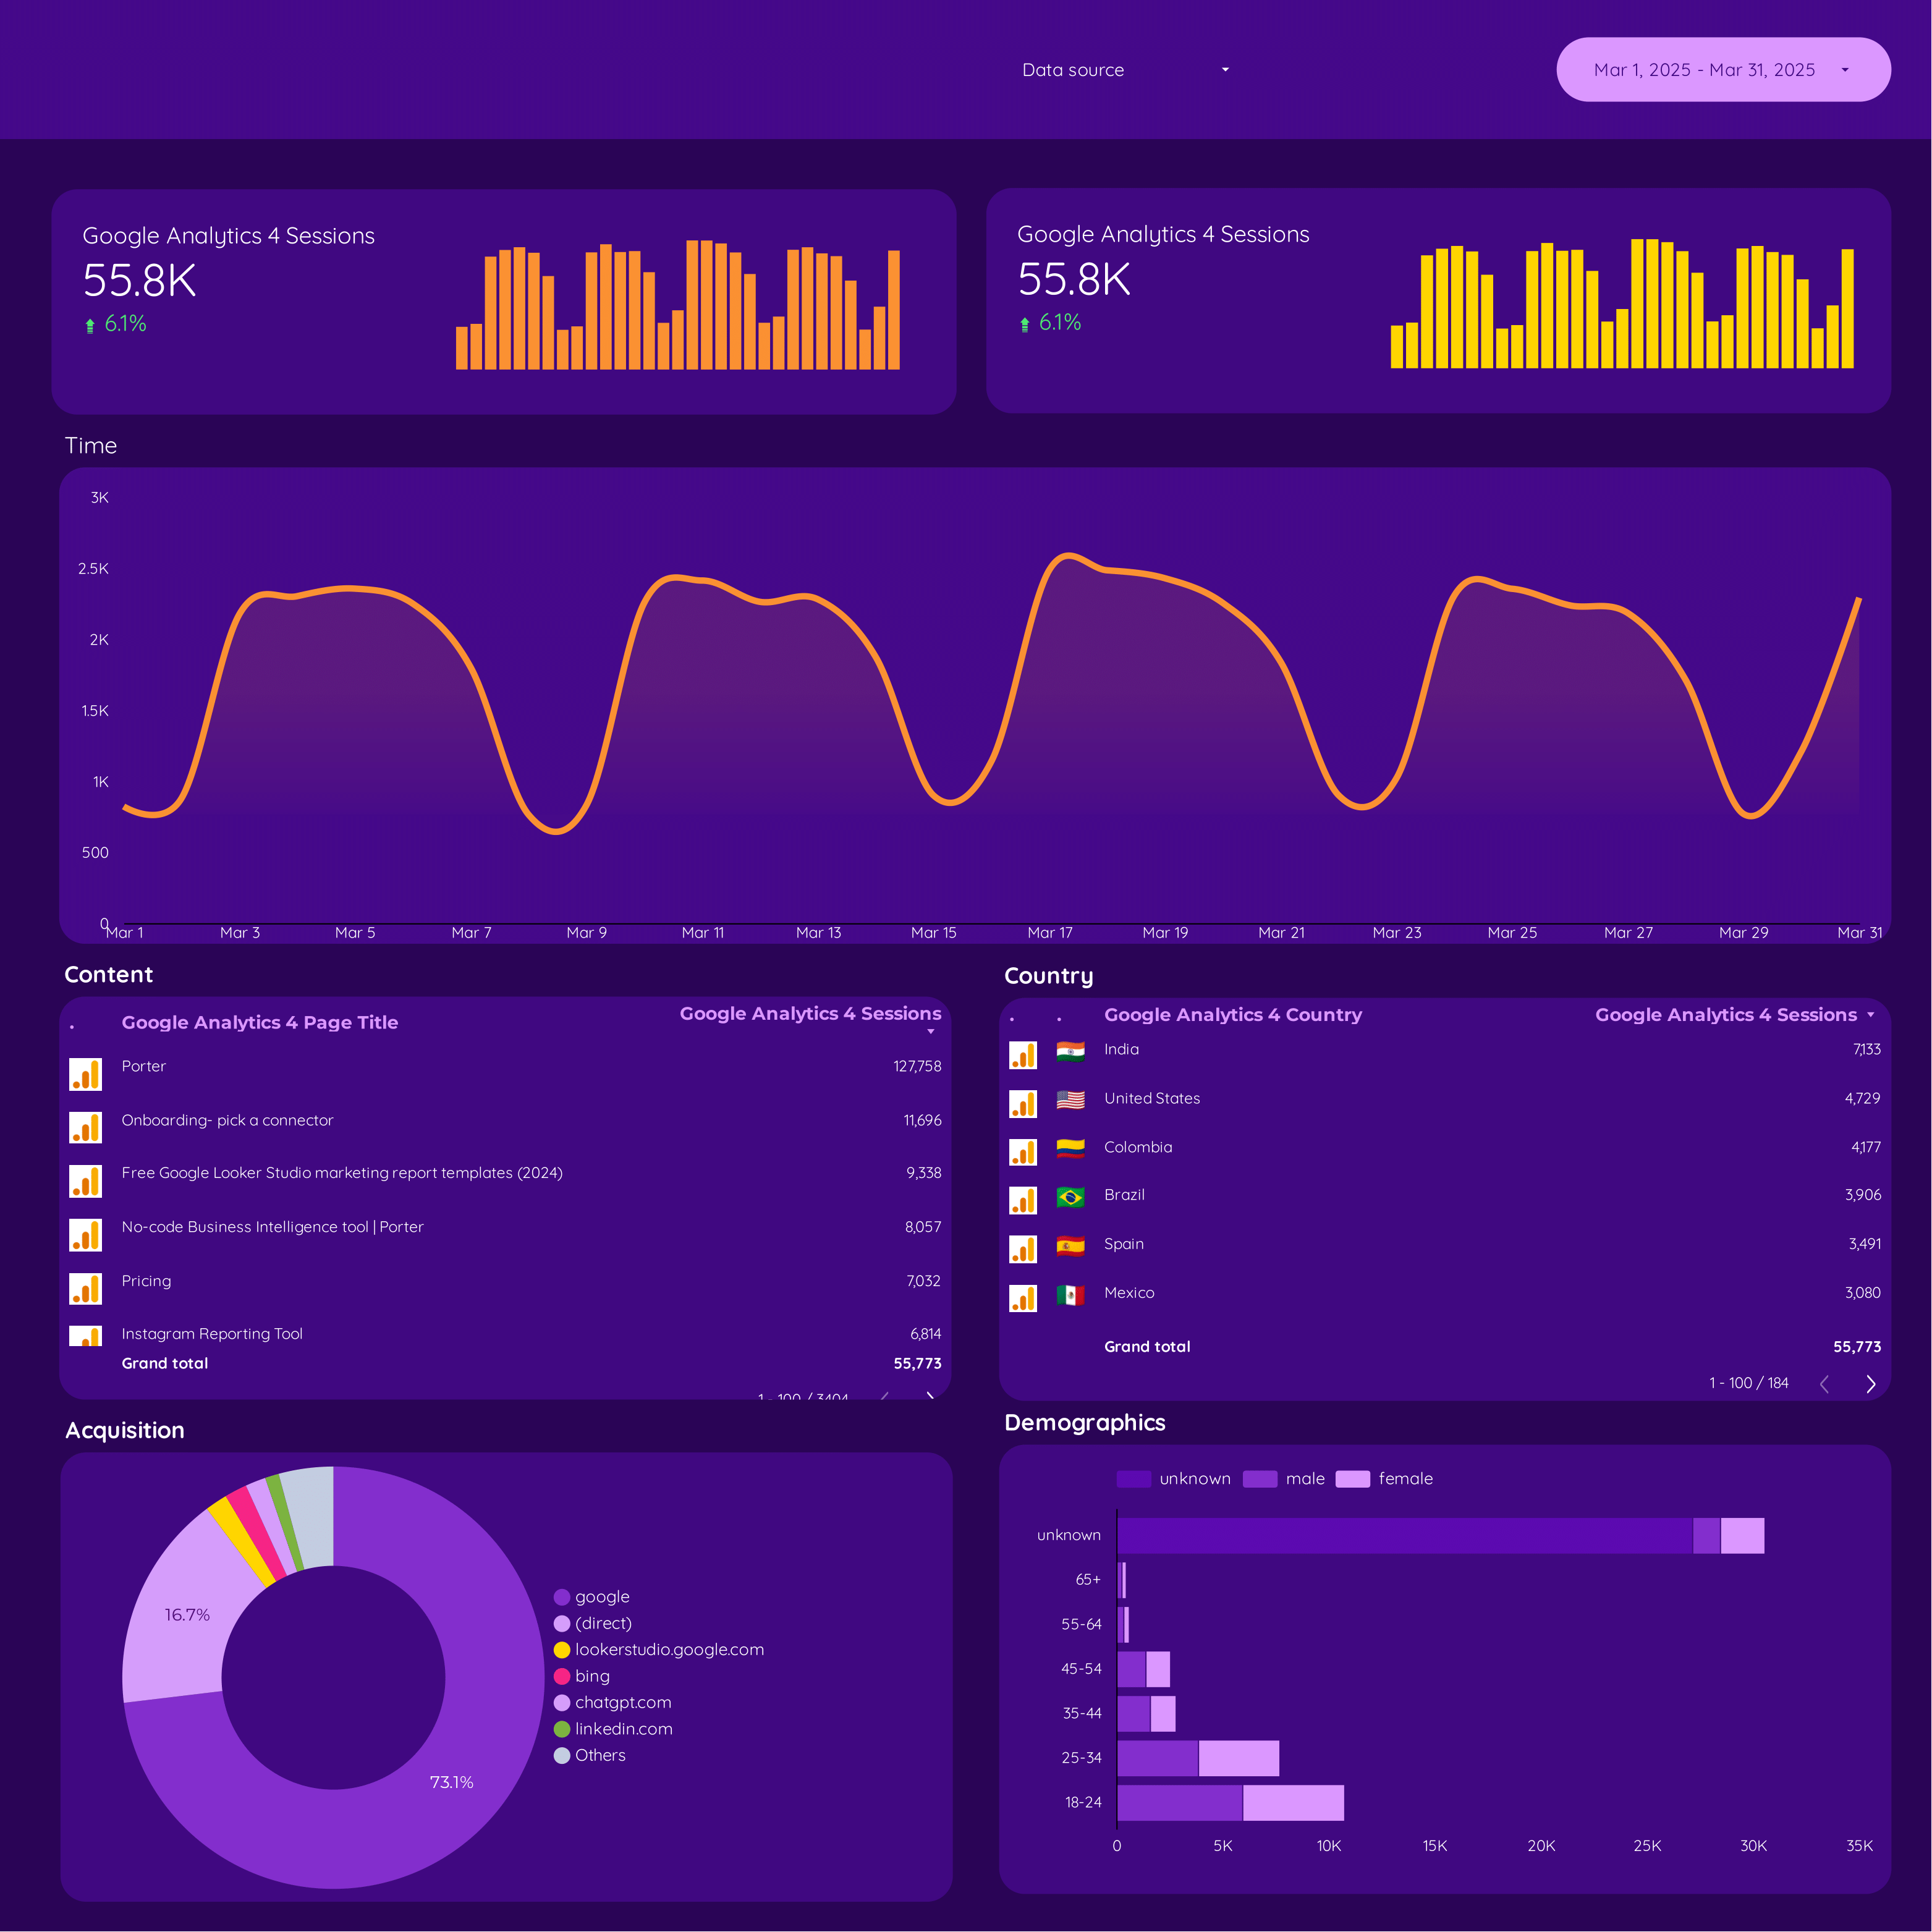
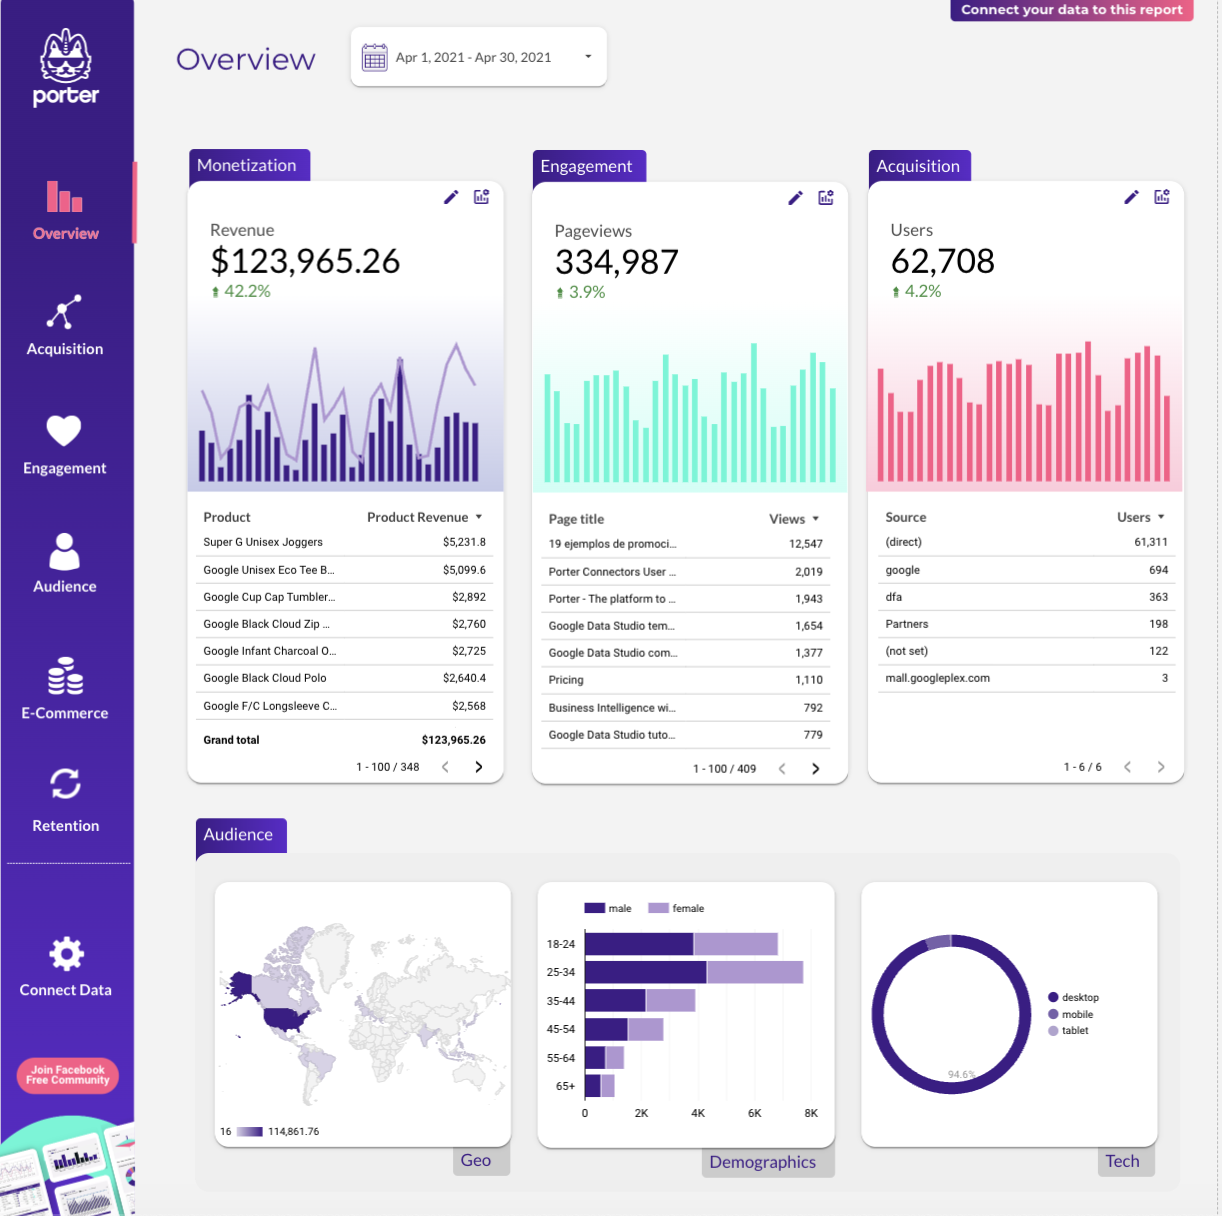
How to measure Content Performance in Data Studio

Marketing reporting made easy: Automated, code-free, and visually intuitive.

14-day free trial

We'll cover

How do you track your content performance has always been the predominant question asked by a lot of online marketers, including you.

Given this, how to measure database performance metrics has been restricted to a few different Google analytics indicators, like page views and page time.

And although these measures are essential, they do not fully illustrate how successful content commercialization has been.

In this well-detailed article, we will be going on a fun-filled read on how you can effectively measure your content performance in Data Studio.

But before we dive straight into it, let’s take a step back to understand key metrics in the analysis of content performance.

Below is a sneak peek at one of our SEO blog content dashboards, where we track URL clicks and impressions amidst other metrics important for tracking the performance of our landing pages and SEO blog articles.

We narrowed ours down to track a few key metrics that are important to us. Metrics such as Clicks, page views, and impressions, which we will be discussing with you shortly.

Analysis of Content Performance – Key Metrics

A few metrics are important for tracking your content performance and the easiest way to know this is to understand what you want to achieve in order to grow your business.

As earlier stated, we have a few you should keep in mind when considering these metrics and we’ll do well to talk about it below.

Pageview

Pageviews are a valuable indicator for evaluation and should always be measured along with other criteria. A pageview, for instance, is when you arrive at a specific page.

No matter how often you reload that website, it still counts as a pageview. The same user and page are being seen again even if you leave the page and immediately return.

Bounce Rate

We all know that a high bounce rate could indicate that website visitors are having trouble discovering what they’re looking for. And it could also suggest that you need to enhance your website’s user interface or content.

But what you may not be aware of is that with a free email marketing report template, you’ll be able to track your site’s bounce rate effectively.

You may also enhance the navigation, call to action (CTA) placement, and website content quality by thoroughly examining your bounce rate.

It’s beneficial when comparing several pages on your website to one another. For instance, an exceptionally low or high bounce rate on a particular topic could mean that your audience prefers or detests that subject.

Check out our free email marketing report template.

Average Session Duration

Did you know that when users visit your website, Google Analytics starts tracking their session? This tracking lasts until the session is over.

For instance, if a customer accesses the main page of an e-commerce site at 2:00 pm, moves on to a category page, like a product page; adds items to their cart.

And then leaves the checkout page at 2:30 pm, all of those actions take place during the same session, which started at 2:00 pm and ended at 2:30 pm.

This will help boost the relevance of your webpage. In essence, you should ensure that your average session duration falls between 2 — 3 minutes, by ensuring your content is engaging as well as reader-friendly.

Traffic

Online content depends on traffic to survive. No matter how fantastic your blog entries are, nobody will read them if no one is visiting your website; thus, they won’t be helpful to you.

Traffic is one metric you must track to get back to the fundamentals. Of course, there are other subcategories in which to divide this traffic.

Track your Facebook insights with our Free daily KPI report template.

Sales Or Conversions

Your content’s objective could vary depending on whether you want to generate a tangible sale or build authority for your company.

You may want to emphasize metrics like social shares and engagement in this situation.

Nevertheless, if your blog serves mainly as a sales tool, you’ll want to monitor the volume of purchases it brings in.

Viewing the page value of your content within the behavior section of Google Analytics after enabling e-commerce will allow you to achieve this. 

Check out our sales KPI templates.


This template shows you the session, average time on pages, bounce rate, sales, and conversion rate as well as other important metrics a good online marketer should know to ensure they are kept business afloat.

This will also show you the typical revenue each page has brought in from users who went directly to make a purchase or accomplish another objective you’ve specified.

Engagement

The volume of traffic your material receives can sometimes be used to gauge your success in persuading readers to click on your links rather than the quality of your content itself.

You must monitor how much time visitors spend on your site and how many pages they view throughout each session if you want to know whether they engage with your content.

For people to read more of your information, it is crucial to keep them on your website for as long as possible. In Google Analytics, this data is displayed under Audience Overview.

Visualize how people are engaging with your website content using Google Analytics with our Website content performance Google Data Studio report. 

Social Media Engagement

Looking at how well your content is performing on social media is another helpful technique to gauge how engaging it is.

The most significant measure here is the frequency with which your material has been shared across social media platforms.

However, there are other metrics you may monitor as well. Sharing your content demonstrates to other users how useful it is.

The number of times any piece of content has been shared on each platform will be displayed if you have social share buttons, even if this data isn’t available in Google Analytics.

Google Analytics showing Traffic as well as engagements.

SEO Performance

You must undoubtedly evaluate your Seo performance. You can track a variety of metrics in this area.

The position of your page in the search engine results for a specific keyword phrase, or SERP ranking, is likely the most significant factor.

Rankings aren’t constant and do tend to change a little over time.

Still, if you’re following your rating over that time, you want to see it either stays the same (if you’re already in a strong location) or go up, which indicates that you are acquiring credibility and authority.

To find out which search phrases you appear for and to track any changes in your ranking over time, utilise Google Search Console. More leads, more sales, and hopefully, more conversions will result from improved SEO. 

To find out more, check out our article on the top 10 SEO KPIs you need to track in 2022 or use our SEO report template for Data Studio.

Authority

Even if authority is more difficult to quantify than the majority of the other metrics, it’s still crucial to work on building it over time.

High authority can help you establish your brand, foster greater trust, and boost your conversion rate, enhancing your SEO, which will result in more search traffic.

Returning Visitors

This metric has a particular goal: it enables digital marketers to assess how effectively they are growing and retaining their audience. This will demonstrate the success of their content marketing efforts.

This measure will group their visits depending on how frequently a visitor returns. They may consist of two to three visits, four to nine visits, or ten or more.

This indicator will also tell you how often people visit your website on average and how long they stay there on average when they return.

Returning visitors vs New Visitors

Do you want to know how to track the number of visitors visiting your website? Check out our well-detailed guide on how to create an eCommerce report.

How to measure your content performance with Google data studio

Set the right KPIs for your content

As discussed earlier, what is important for your business might be an impression, it could be page views, link clicks or clicks in general. A number of things can be at the forefront of your deliverables.

Once you have these figured, all you’ll need to do is to get the connectors for them ready.

In our case we have the Google organics such as search console and analytics on lock and also have connectors such as Facebook Insights, LinkedIn Pages and Instagram Insights.

You’ll be able to access all these connectors via this link

Before choosing the KPIs you will employ, it is crucial to decide who needs to know more about your KPIs.

And knowing who will need to use these KPIs will give you essential insight into which kinds will be most advantageous to your campaign.

Use Data Studio & search console template.

Even though Google Data Studio is simple to use, there are specific pre-made templates you may utilise to save time. 

For instance, this design features a variety of useful metrics for tracking the performance of content in a bright and eye-catching interface.

A pre-built template is highly advised because it may be utilised as a starting point and further adjusted to meet your needs.

Analyse the “All Pages” and “Landing Pages” reports

Whether e-commerce monitoring is turned on or a value is added to your objectives, you will still be able to see the page value. This calculator shows how much a single page contributes to a goal or an online transaction.

Get precious insights from the “Pageviews”

Another possible cause for its poor conversion pages is their relative position in the conversion funnel. A page’s conversion rate should be below if it is near the top of the funnel.

Similarly, the transfer ratios in the pages towards the base of the funnel are significantly greater. To see whether this is the case on a particular page, you must look at the “Navigation Summary” in the “All Pages” report.

Track content-related user interactions

You can track content involvement by watching for social sharing clicks, message submissions, or page scrolls, even when they are not installed by default.

This can be utilised as performance indicators, making content management research crucial.

Collect post author, category, main keywords, and post format

If you are enthusiastic about content marketing, you will eventually need to ask performance-related questions like “Who is our best author?”

What formats would be more appropriate for our audience, or which forms of information convert better?

Well, custom dimensions, the collection of content, and the use of Google Analytics is used to accomplish this. After adding the monitoring, you will show the data in a customised Google Analytics report.

If not, you can utilise a tool like Google data Studio to present these data more appealingly.

You can use our Google Data Studio templates and/or examples, which are already customised for the most popular metrics if it initially seems too complicated to understand.

Analyse the bounce rate and time on page

Since they are relevant for the content, bounce rate and page time are crucial metrics for the sale of content. A low bounce rate usually indicates that the content is essential to the reader.

The same is true for a very long time on a list. Users frequently spend time reading your content while they are browsing the web.

How to create Google Data Studio reports tracking blog performance

Using Google Data Studio for blog performance

You must connect Google Data Studio to Google Analytics to see your website’s data. And if you’re interested in learning more, I highly suggest enrolling in Google Data Studio’s “Analytics Academy” — guide found in Porter Metrics.

The link “here”, should take you to the help centre page. If you’re still confused, you can navigate to the community page and describe your issue.

Still confused and you want to skip the class “Analytics Academy”, then check out our free Porter metrics crash course we provided for digital marketers.

Create a filter for the whole report

You must build a new report, and you will include blog data in it, not data from your entire website. You need to design a filter to accomplish this.

But before we get to that page, let’s slowly go through the process that got us there. Once you access the Google data studio page, you’ll click on create > report >

Next step: You either click on  “connect to data” or my “data sources”

For the sake of newbies, I’ll click on “data sources” which shows me the samples I already have

Then you’ll click on one of the samples and add to the report. You should have something like this:

The simplest method is adding a “filter” to your report. To do that, follow these steps:

Click on File > report settings > under ‘filter’, hit ‘add a filter’ [You should find it by your left]

The best scenario is to have sub-domains for your website. Your different blogs are grouped under a sub-domain, such as /blog if your URL looks like www.domainname/blog/blog-title. 

It will be challenging to access all of your blog’s data if you haven’t done this (you may have noticed if using Google Analytics).

If this hasn’t been done before, I’d advise you to talk to your CMS manager about getting it done. 

Return to Google Data Studio’s configuration

We must configure this filter to ensure that your reporting dashboard only displays blog entries. To accomplish this, create your filter to include pages that contain or begin with the word “blog” (or whatever your chosen sub-domain is).

Add in a date range

Press this toolbar icon to enter your date range. The data will appear when you create this delectable report and set this to the current year-to-date.

Show pageviews data

The total number of “sessions” and “pageviews” for a given time and how this data is distributed over time should be provided.

Both a graph that serves as an overview and a little table that lists the blog material according to page views are helpful. 

Pageview: It is a glimpse of that page on your website.

Unique Pageview: The same as Pageview, but without the individual seeing the page later or refreshing it.

Session: This is a browsing session on your website.

To display this data in the three ways, you must first Create a separate scorecard with the measure “Unique Pageviews” and set the metric to “Sessions”:

After that, make a Time Series chart. And although the breakdown dimension is set to “Page Title” and the metric is “Unique Pageviews,” the dimension is automatically configured as “Date.”

Set up a table. Choose “Page Title” as the dimension and “Unique Pageviews” as the metric.

Show users vs new users data

I’ll make a table with the raw data to compare new users to all users, along with a little pie chart showing the proportion of new users to all users.

New User: It is a user who hasn’t yet received a tracking cookie and is visiting your website.

Returning User: It is a visit from a user who already has a tracking cookie on their computer.

User: It merely consists of a new and returning user

It should be noted that the number of users doesn’t always equal the sum of new and returning visitors. This is because a single user could visit your website more than once and be recorded as a new visitor once, then a returning visitor each time.

To display the data:

Set up a table. Put “Page Title” as the dimension and “New Users” and “Users” as the metrics.

Build a pie chart. Create a distinct pie chart for “new users” and set the dimension to “Page Title,” “Users,” and “metrics.”

Show time spent on site page data

You’ve drawn a visitor to your website, but are they actually reading your content? Do they only arrive for a brief moment before leaving?

Low read times are a warning sign. Therefore you should make improving that copy a top goal. A straightforward table best demonstrates the statistics for this. Here are the guidelines:

Set up a table.

Put “Page Title” as the first dimension, followed by “Time on Page” and “Avg. Time on Page.”

Average Session Duration: The metric “average session duration” calculates the typical duration of visits to a website.

Once a user enters a website, Google Analytics starts tracking their session. This tracking lasts until the user leaves the website or is inactive for a specific duration.

Show bounce rate data

More individuals are leaving your website after only viewing one page, which frequently means they have had no engagement with your site, and the higher your bounce rate.

This undoubtedly indicates that the bounce rate is relatively poor. It’s always enticing to measure your bounce rate to that of others, but comparisons are useless.

Discovering your typical bounce rate and making an effort to lower it are the objectives here.

Want to view the Google Data Studio bounce rate statistics for your blog? Here’s how, and it’s easy:

Set up a table. Choose “Page Title” as the dimension and “Bounce Rate” as the metric.

Show referral source data

The sources of traffic that direct visitors to your blog are known as referral sources.

Typically, it includes the significant boys: Google, Email, and Social Media, as well as people using other search engines, visitors who come directly to your site, and other referrers like another blog that recommends yours.

You can illustrate this data as follows:

Construct a bar chart.

Set “Month of the Year” as the breakdown dimension and include “Source/Medium” as a breakdown dimension. The “Unique Pageviews” metric is then added.

To provide a quick comparison of the previous months, it’s preferable to include this breakdown dimension that divides the date by month. 

10 Ways to Align Your Content Strategy with Google Analytics

Google Analytics sample data report template

Collect the Right Data

I think we have transitioned to the third decade of web analytics.

IT departments and web admins held ownership of analytics for the first ten years. They used hits as a metric for success and referred to everything as “stats.”

The performance of their websites was unknown to website marketers. It’s understandable why so many businesses failed during the web 1.0 era. In terms of evaluating online success, it was the dark ages.

Insightful reports were produced for the second decade thanks to website tagging powered by JavaScript. Marketers all around the world became interested in this.

Perhaps using analytics to evaluate our website would be beneficial?

Although the execution was typically still in the hands of IT departments, marketers began to get access to the decision-making process. Analytics facilitated enduring corporate growth, and online commerce soared.

During this period of industrial expansion, many marketers entered the field. The widespread use of web analytics is taken for granted by many marketers.

Another change is taking place as web analytics enters its third decade. Website tracking no longer requires the skills to write code or set up servers.

Being technical undoubtedly helps, but many tracking requirements don’t call for coding. The technology that brought about the measurement revolution is Google Tag Manager.

Understand The Possible

Technology advancements have made it possible for us to measure more than before.

Though you might not be aware of all the developments, if staying current on analytics trends is not part of your job description.

This is particularly valid for people who have been utilising Google Analytics for a long time. You may review a report of your traffic/ page views, but do not look at more than one or two reports.

Turn Data into Knowledge

A story, a plan, or an insight cannot be created solely from data. The facts of what transpired are just data. We must use our thoughts to convert data into knowledge that other people may use.

When forming knowledge, we employ data and information. Data must be used to illustrate what transpired with our visitors. As content creators, we should know that the story hooks our audience.

The same is true of our tale. Tell a story using the data you have collected. For instance, a lot of people find your posts through organic search.

However, they only view one page before leaving. Come up with a narrative explaining why that is occurring before formulating a strategy for improvement.

A Customer is not a Device

Every device that visits our website is tracked using traditional web analytics. Every computer that accesses our website is given a unique cookie that enables us to determine whether we have already seen it.

Years ago, this strategy was effective when most visitors had just one device. Today, however, that is not the situation we face as marketers.

Before making a purchase, our prospects may visit us on several different platforms. On numerous devices, our clients can access their accounts.

Be Goal Oriented

To use these features, you don’t need to be technical. Finding a technical ally, however, might be necessary to assist with some implementation.

Let’s move on to the exciting bit, the reports we can access in Google Analytics to gauge the success of our content strategies. It would be best if you first defined goals in your Google Analytics account to monitor your progress.

Your Content Must Perform – Use Content Grouping

How many people visited the page, how long they stayed on it, and how many goal conversions did this action affect? These should be constant questions.

You may track performance by category in Google Analytics by grouping your content. This is extremely helpful for huge websites that span various themes.

This can be configured in Google Analytics using rules, URL extraction, or website tags. And the outcomes let you know which subjects you cover to do the best.

What is the Big Draw?

Use the report on landing pages to determine what material is currently popular with your visitors. Then, go to those pages on your website and brainstorm improvements you could make.

The most significant opportunities for improvement are on the pages of your website that receive the most traffic. Because visitors already find them appealing.

A slight change for many users can have a greater impact than a significant change for a page no one visits. Analytics aids in identifying potential growth areas.

Content marketers can only think of a unique approach to take advantage of such chances.

Shamelessly Self Promote

Making content for the web can take content marketers days, weeks, or even months. Our natural reaction is to applaud the launch and hurry on to the next project when the content is finally published.

This is incorrect. I’ve discovered that your material’s promotion strategy will considerably impact its success more than the content itself.

On the internet, there is a tonne of excellent stuff. This is especially true in a world without penguins. You can create amazing stuff that is ignored.

I am aware because it did occur to me. For this reason, you must follow some basic guidelines when promoting stuff, and you have to spend time advertising content until you get enough traffic to justify these efforts.

Prove Top of Funnel Value – Attribution Modeling

Advertising initiatives at the top of the funnel include content marketing and organic search. It is unfair to evaluate them compared to bottom-of-the-funnel efforts that result in sales (like PPC).

Every piece of content won’t always result in a sale right away, so don’t hold your breath. Mainly when selling expensive products, this is true.

But each piece of content you produce should guide your target audience toward the following action. Google has, however, made available a fantastic tool that enables us to gauge the effect our efforts are having on sales.

It is called attribution modelling and is open to any Google Analytics account with goals or e-commerce tracking set up.

Calculate Return on Investment

Evidence of your investment’s return is another requirement for obtaining funding for content marketing. Securing a budget shouldn’t be a problem if you can demonstrate the earnings you generate from your marketing initiatives.

Google Analytics may be used to retrieve content marketing income statistics. To find this information, use attribution modelling or the multi-channel funnels tool.

Then you may include data from your own company to demonstrate a profitable return on your investment.

Conclusion

You can measure content performance in data studio google analytics with these reviews and targeted monitoring in your analytics toolkit.

As such you will better understand your brand promotion and you can plan and carry out your content management strategy with greater knowledge.

And for an even better view, you may use the data analysis functionality of Google Data Studio templates. With them, you’ll turn down the volume to focus on what matters to your business.

Frequently Asked Questions

How is Data Studio bounce rate calculated?

Your bounce rate is determined by dividing the total number of sessions by the number of users who had single-page sessions.

What are the 4 key types of content metrics?

Consumption, sharing, lead generation, and sales metrics.

What is content performance analysis?

It observes how effective content marketing campaigns, specific assets, and distribution methods perform compared to predetermined targets.

What is a good bounce rate?

A range of 26% to 40%

Is engagement rate the same as bounce rate?

No. Websites, mobile apps, blogs, and news sources use Engagement Rate instead of Bounce Rate. This is because the engagement rate is the opposite of the bounce rate, so the number will probably differ from what you’re used to.