A Social Media Competitors report should include a breakdown of metrics by visibility (e.g., reach, impressions), engagement (e.g., likes, comments), and conversion (e.g., click-through rates, conversions) metrics. The data should be segmented by campaign, channel, audience, content, objective, and date. For example, providing data on the most successful campaign in terms of reach, the channel with the highest engagement rate, and the date with the highest conversion rate.
To analyze social media competitors’ data, follow these steps:
1) Choose metrics such as visibility (number of impressions, reach), engagement (likes, comments, shares), and conversion metrics (click-through rates, conversions).
2) Add context by comparing data against cost (e.g., cost per impression), date range (e.g., weekly or monthly performance), goals (e.g., increasing brand awareness), rates (e.g., engagement rate), and benchmarks for industry standards.
3) Segment data by campaign (e.g., specific ad campaigns), channel (e.g., Facebook, Twitter), audience (e.g., age, gender), content (e.g., images, videos), objective (e.g., lead generation), and date (e.g., performance over time). For example, compare the engagement rates of different Facebook ad campaigns targeting different age groups to understand which campaign resonates better with the target audience.
To build a Social Media Competitors dashboard, 1) connect your social media accounts and competitor data. 2) Select metrics such as engagement rate, follower growth, and post frequency to monitor performance. 3) Segment data by campaign, social media channel, audience demographics, product promoted, customer content, objective, and date. 4) Add filters or buttons for metrics like ‘Top Performing Posts’ or ‘Audience Growth’ to make your report interactive. 5) Share your dashboard via PDF, scheduled emails, or links.
A Social Media Competitors dashboard is a tool that visually tracks, analyzes, and displays key performance indicators (KPIs), metrics, and key data points to monitor the health of a business, department, or specific process. It is significant for businesses as it provides insights into competitors’ social media strategies, helping to inform and improve their own strategies. Tools like Looker Studio are commonly used to create these dashboards, which typically include elements like competitor follower counts, engagement rates, and content performance. Real-time data monitoring is crucial to react promptly to market changes. For learning how to create a marketing dashboard using Looker Studio, visit our YouTube channel: https://www.youtube.com/@porter.metrics.


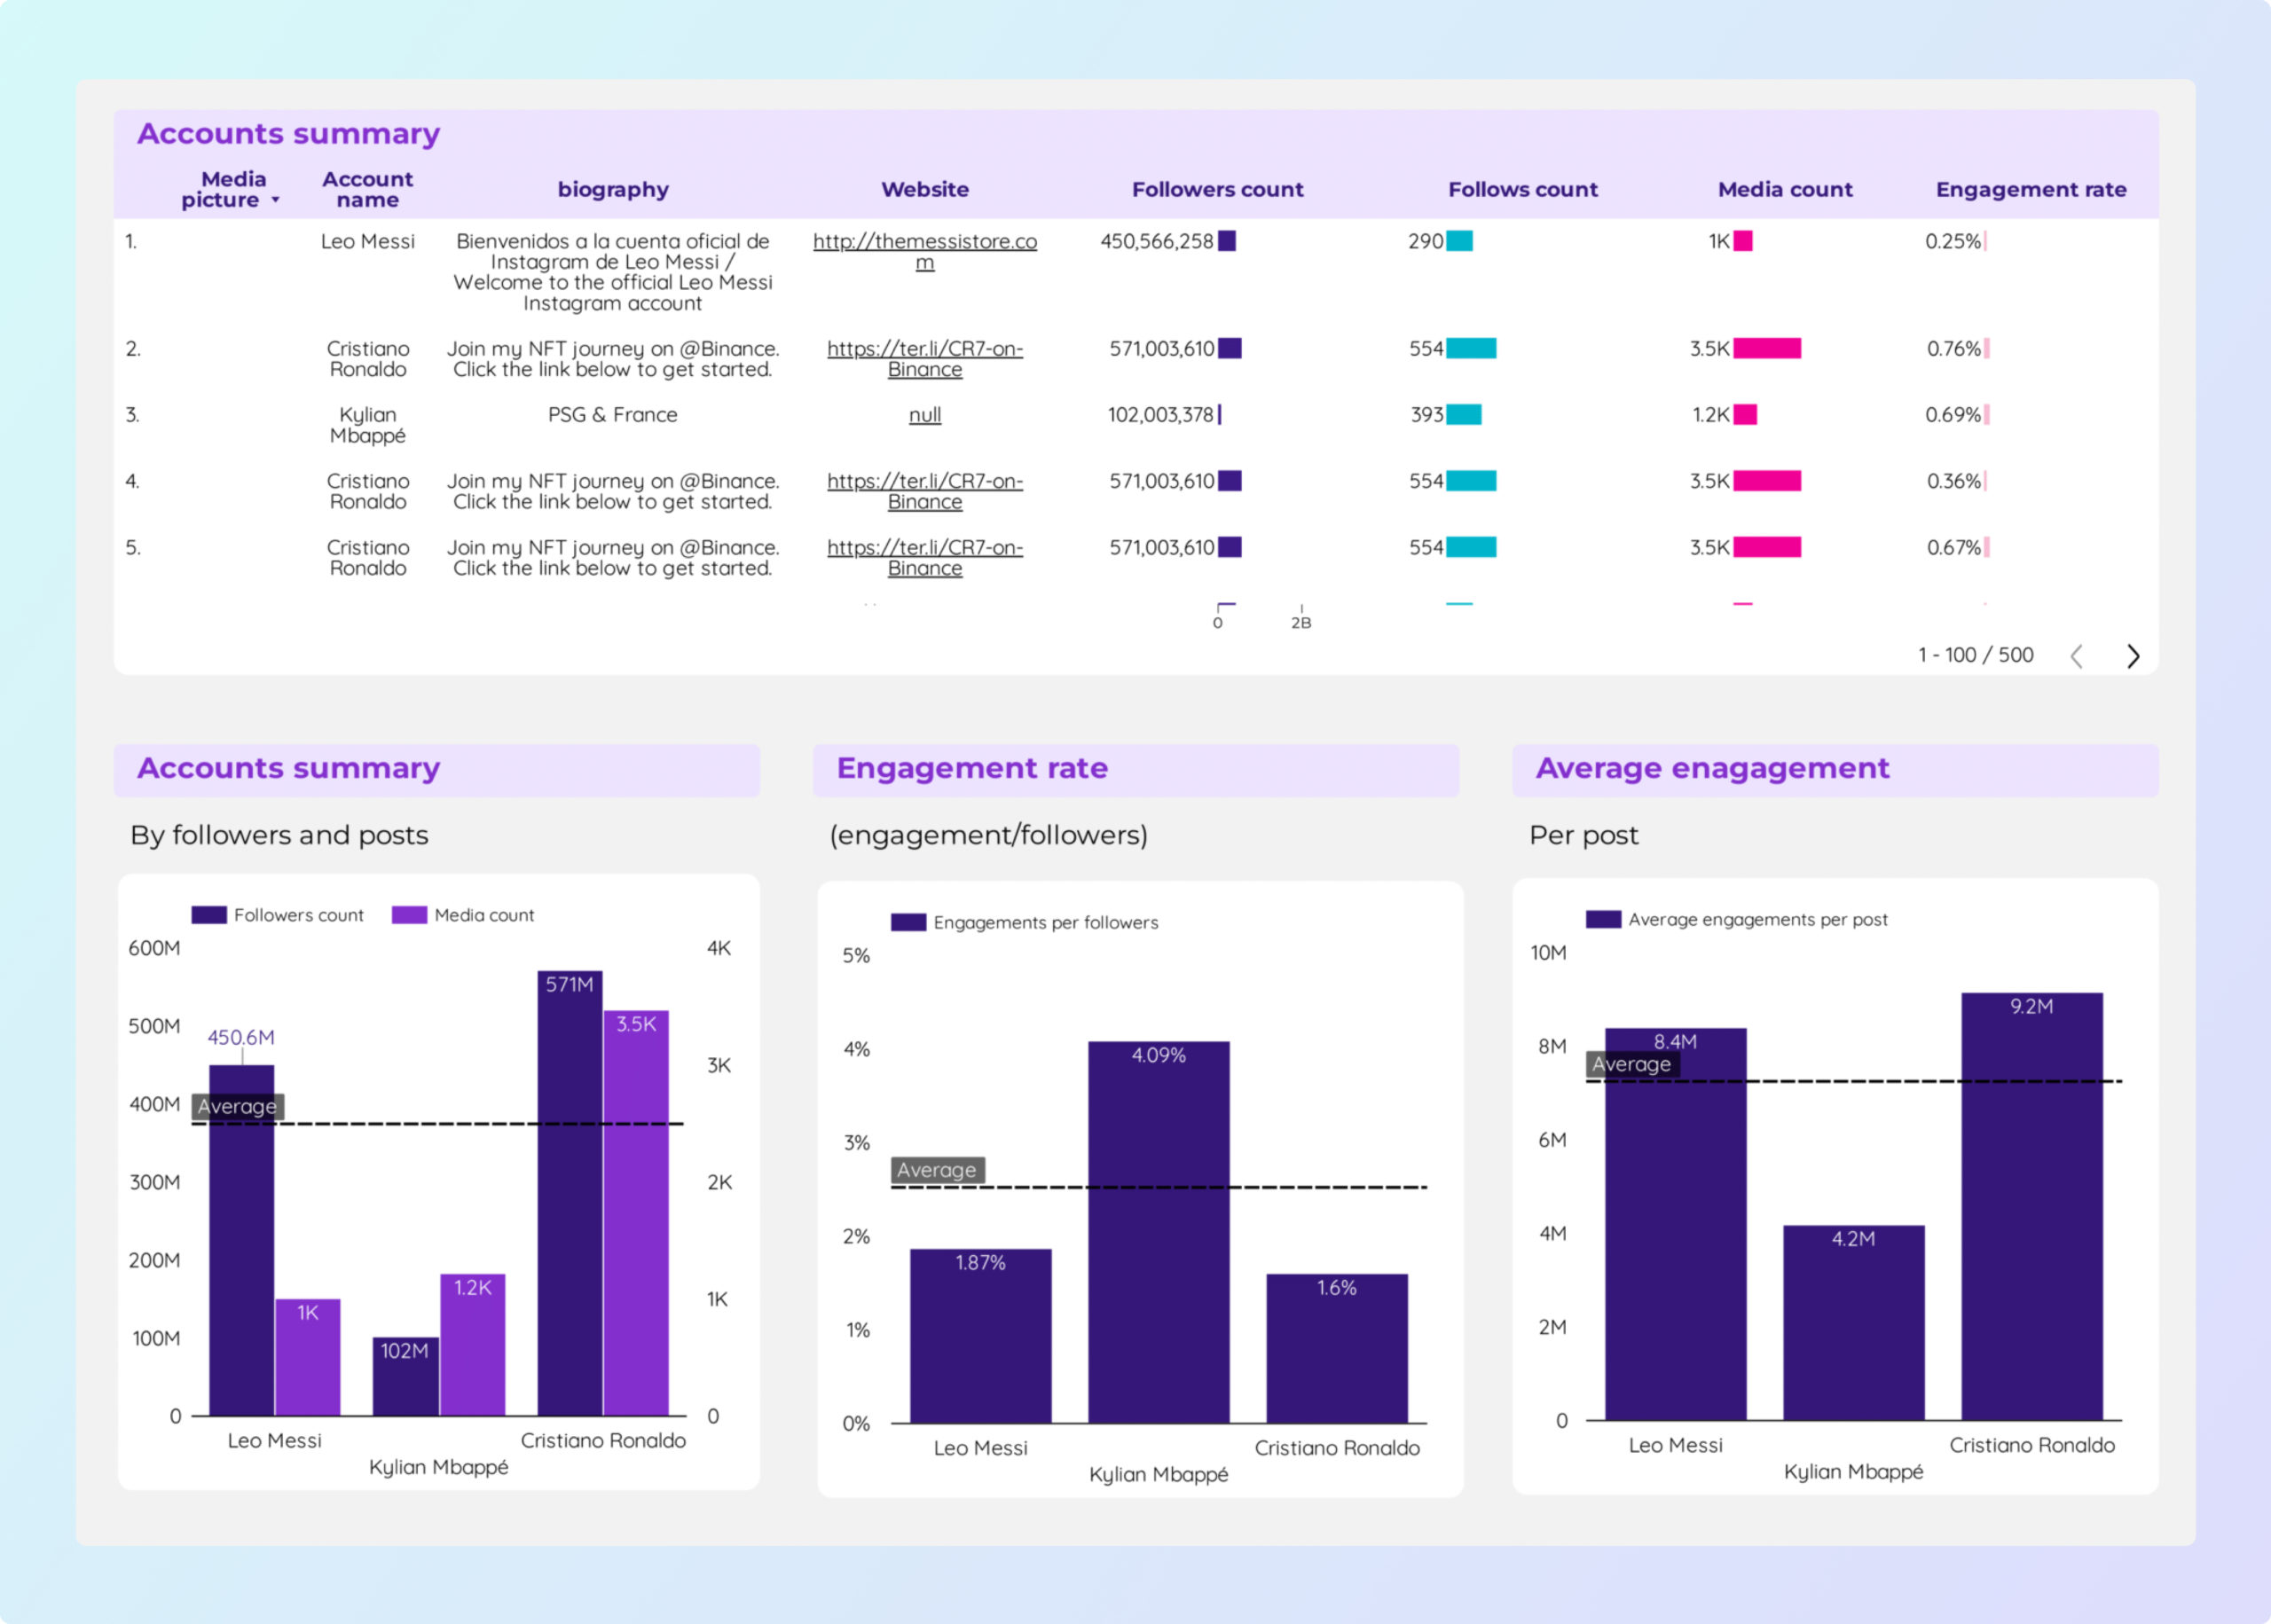
 Instagram Insights
 Facebook Insights
 LinkedIn Pages
 Google Business Profile
 Pinterest
 TikTok
 Impressions
 Profile Visits