A Facebook Insights report should include a breakdown of metrics by visibility, engagement, and conversion metrics. The data should be segmented by campaign, channel, audience, content, objective, and date. For example, visibility metrics could include reach and impressions, engagement metrics could include likes, comments, and shares, and conversion metrics could include click-through rates and conversions.
To analyze Facebook Insights data, start by choosing visibility metrics such as reach and impressions, engagement metrics like likes, comments, and shares, and conversion metrics including click-through rates and conversion rates. Break down these metrics into categories of visibility, engagement, and conversion.
Next, add context by comparing them against the cost of running the campaign or ad, date ranges to analyze trends, goals set for the campaign, and industry benchmarks. For example, compare the reach of a recent campaign against its cost to evaluate its efficiency.
Segment the data by various factors such as campaigns, channels, target audiences, content types, objectives of the campaign, and specific dates to understand performance variations. For instance, compare the engagement metrics of a video ad targeting millennials versus a static image ad targeting baby boomers.
Remember to be concise, providing relevant examples without mentioning the benefits of the analysis.
To build a Facebook Insights dashboard, 1) connect your Facebook account and data. 2) Select metrics such as page views, likes, reach, and engagement to monitor performance. 3) Segment data by campaign, channel, audience, post type, objective, or date for a detailed analysis. 4) Add filters or buttons like time period or post type to make your report interactive. 5) Share your dashboard via PDF, scheduled emails, or links for easy access and review.
A Facebook Insights dashboard is a tool that visualizes data from Facebook’s native analytics platform, providing businesses with key metrics about their audience, content performance, and engagement. It is significant for businesses as it helps them understand their audience behavior, optimize their content strategy, and measure their social media ROI. The dashboard typically includes elements like page views, likes, reach, post engagements, and demographic data. Real-time data monitoring is crucial as it allows businesses to react quickly to changes and make data-driven decisions. For learning how to create a marketing dashboard using Looker Studio, visit our YouTube channel: https://www.youtube.com/@porter.metrics.


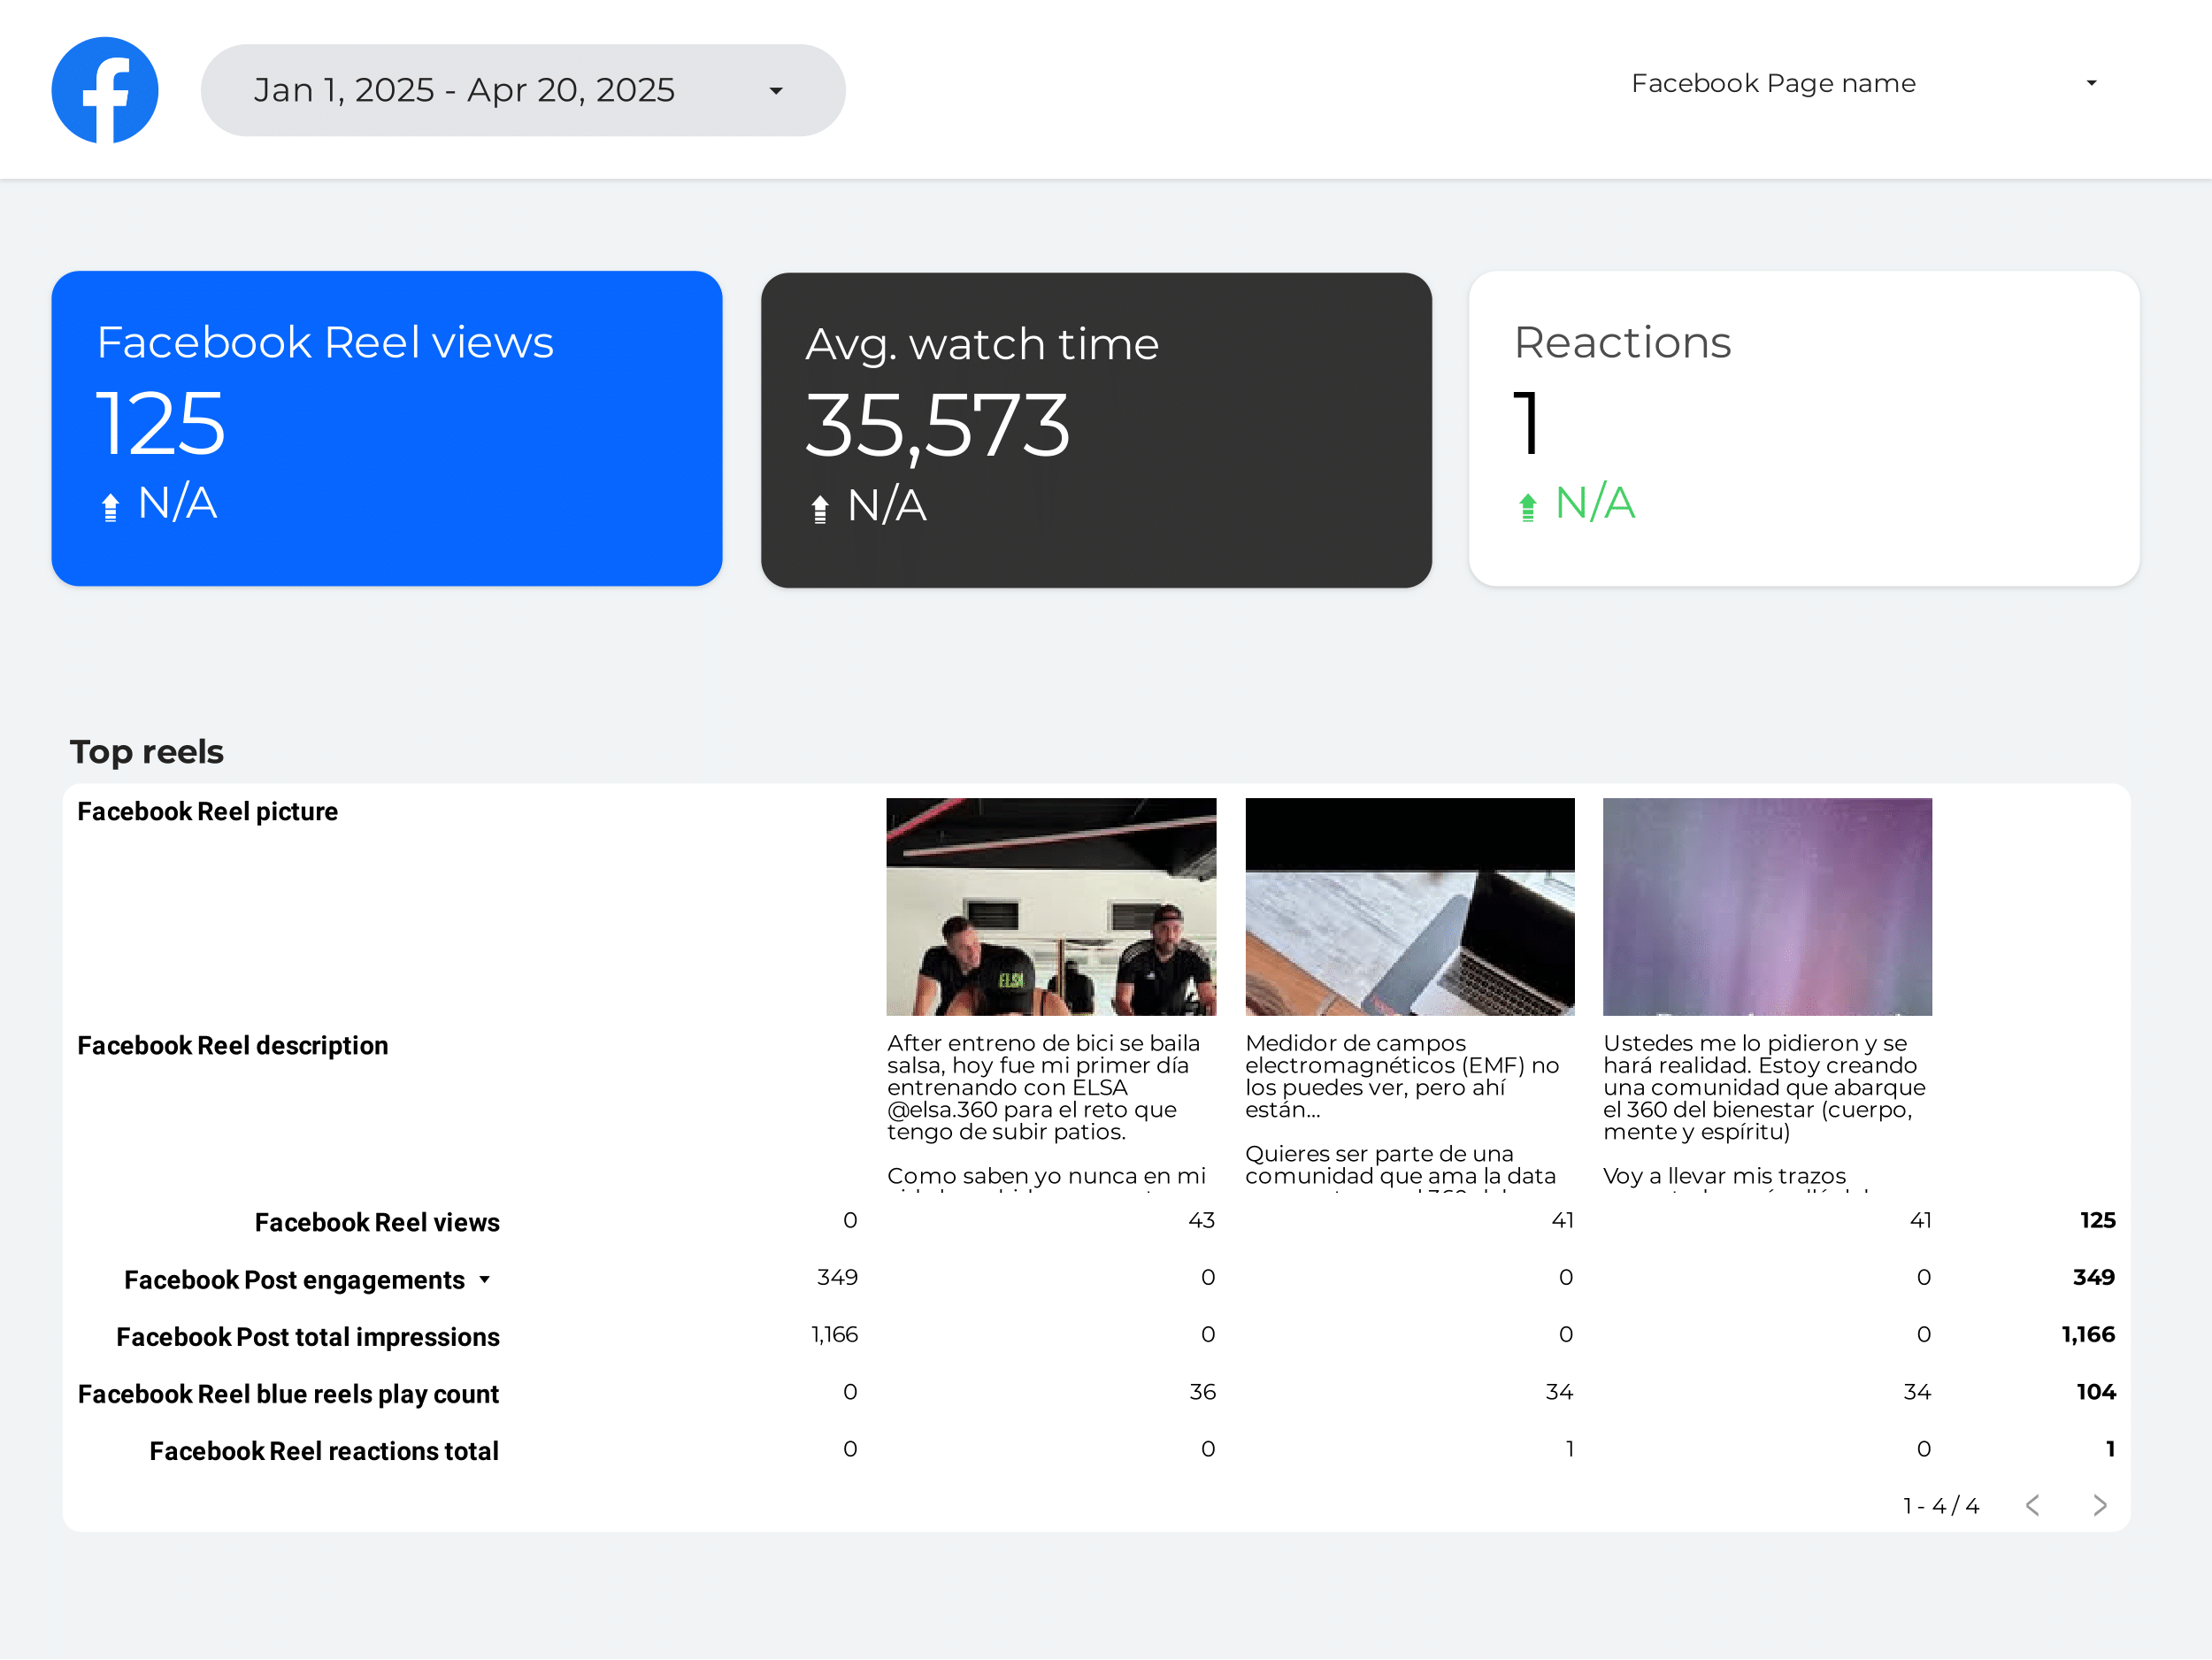
 Facebook Insights
 Impressions