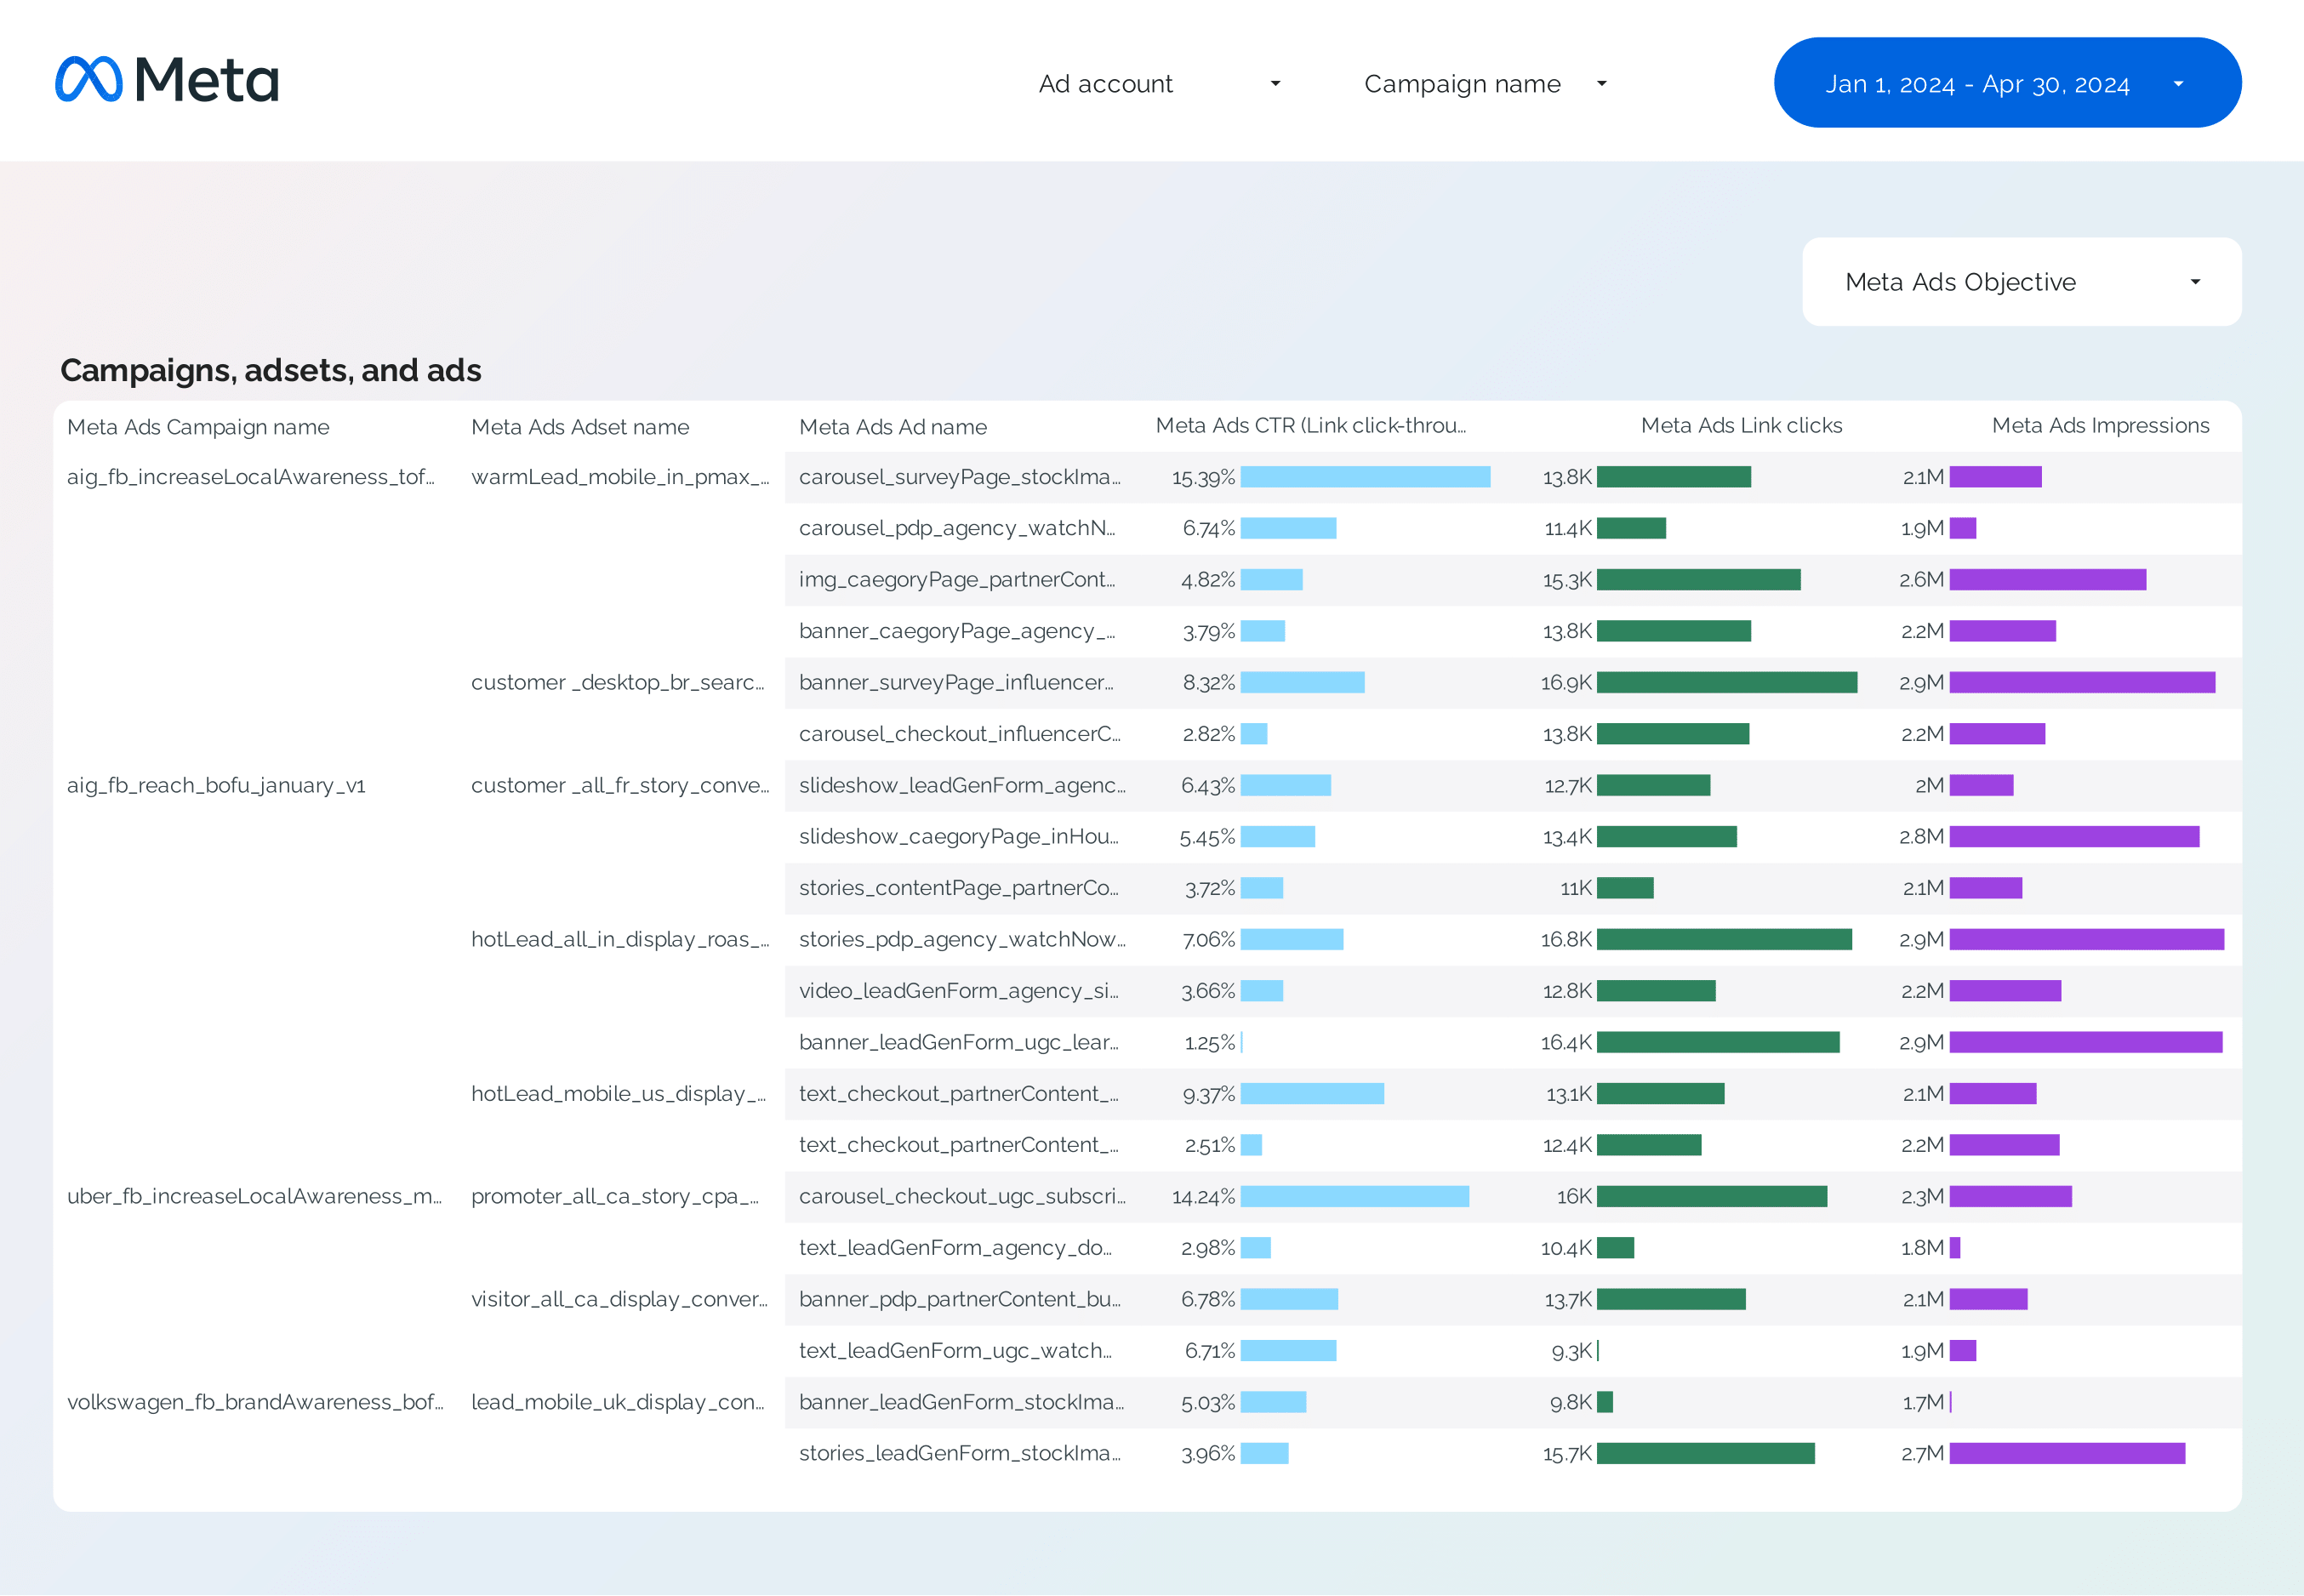
A Facebook Ads Campaign performance report should include the following metrics and details:
1. Campaign Name
2. Ad Set Name
3. Ad Name
4. Ad ID
5. Date
6. Objective
7. Impressions
8. Reach
9. Frequency
10. Clicks
11. CTR (Click-Through Rate)
12. CPC (Cost Per Click)
13. CPM (Cost Per Thousand Impressions)
14. Ad Spend
15. Conversions
16. Conversion Rate
17. Placement
18. Age
19. Gender
20. Location
These elements provide a comprehensive overview of the campaign’s performance, helping to assess effectiveness and optimize future strategies.
To analyze Facebook Ads Campaign performance data, focus on key metrics:
1. Impressions: Number of times your ad was displayed.
2. Clicks: Number of times users clicked on your ad.
3. Ad Spend: Total amount spent on the campaign.
4. CTR (Click-Through Rate): Percentage of impressions that resulted in clicks. Higher CTR indicates effective ads.
5. CPC (Cost Per Click): Average cost for each click. Lower CPC is generally better.
6. CPM (Cost Per Thousand Impressions): Cost for 1,000 impressions. Useful for brand awareness campaigns.
7. Conversions: Number of desired actions (e.g., purchases, sign-ups) completed.
8. Conversion Rate: Percentage of clicks that resulted in conversions. Higher rates indicate effective targeting and ad content.
9. Reach: Number of unique users who saw your ad.
10. Frequency: Average number of times each user saw your ad. High frequency can lead to ad fatigue.
11. Analyze by demographics (age, gender, location) and ad placements to optimize targeting.
Regularly review these metrics to adjust strategies and improve campaign performance.
To build a Facebook Ads Campaign performance dashboard, follow these steps:
1. **Data Collection**: Use Facebook Ads Manager to export data or connect to a data visualization tool like Google Data Studio or Tableau. Ensure you have access to metrics such as Impressions, Clicks, Ad Spend, CTR, CPC, CPM, Conversions, Conversion Rate, Reach, and Frequency.
2. **Define Metrics**: Identify key performance indicators (KPIs) relevant to your campaign goals, such as CTR, CPC, CPM, and Conversion Rate.
3. **Dashboard Design**: Organize the dashboard layout to display metrics clearly. Group related metrics together, such as engagement metrics (Impressions, Clicks, CTR) and cost metrics (Ad Spend, CPC, CPM).
4. **Visualization**: Use charts and graphs to represent data visually. Line charts can show trends over time, while bar charts can compare different campaigns or ad sets.
5. **Filters and Segmentation**: Implement filters for dimensions like Campaign Name, Ad Set Name, Ad Name, Date, Objective, Placement, Age, Gender, and Location to allow detailed analysis.
6. **Automate Updates**: Set up automated data refreshes to keep the dashboard up-to-date with the latest campaign performance data.
7. **Review and Iterate**: Regularly review the dashboard to ensure it meets your needs and make adjustments as necessary to improve clarity and usefulness.
A Facebook Ads Campaign performance dashboard is a tool that provides a comprehensive overview of the performance of your Facebook advertising campaigns. It typically includes key metrics such as impressions, clicks, ad spend, click-through rate (CTR), cost per click (CPC), cost per thousand impressions (CPM), conversions, conversion rate, reach, and frequency. The dashboard may also display details like campaign name, ad set name, ad name, ad ID, objective, placement, and demographic information such as age, gender, and location. This dashboard helps advertisers analyze and optimize their pay-per-click (PPC) campaigns on Facebook by providing insights into how well their ads are performing.


 Facebook Ads
 Impressions