An Engagement rate report should include the breakdown of metrics by visibility, engagement, and conversion. The data should be segmented by campaign, channel, audience, content, objective, and date. For example, it should show the engagement rate of a specific campaign on different channels, with various audiences, based on different types of content, and measured against different objectives, for specific dates.
To analyze engagement rate data, the following steps can be followed:
1) Choose metrics:
– Visibility metrics: Impressions, reach, click-through rate (CTR).
– Engagement metrics: Likes, comments, shares, time spent.
– Conversion metrics: Conversion rate, bounce rate, average session duration.
2) Add context:
– Compare metrics against the cost of the campaign. Example: Compare the engagement rate to the cost per click or cost per acquisition.
– Compare metrics within a specific date range to identify any trends or patterns. Example: Compare the engagement rate of the current month with the previous month.
– Set goals and compare metrics to those goals. Example: Analyze the engagement rate against the objective of achieving a 5% increase in engagement.
– Benchmark metrics against industry standards or competitor performance. Example: Compare the engagement rate with the industry average or competitor benchmarks.
3) Segment data:
– Analyze data by campaign to identify which campaigns perform better in terms of engagement rate.
– Break down data by channel to determine which channels drive higher engagement.
– Segment data by audience demographics to understand if different audiences have varying engagement rates.
– Analyze engagement rate by content type (e.g., images, videos, articles) to see what content resonates better with the audience.
– Compare engagement rates based on different campaign objectives (e.g., brand awareness, lead generation) to evaluate the effectiveness of each objective.
– Segment data by date to identify any seasonal or temporal trends in engagement rate.
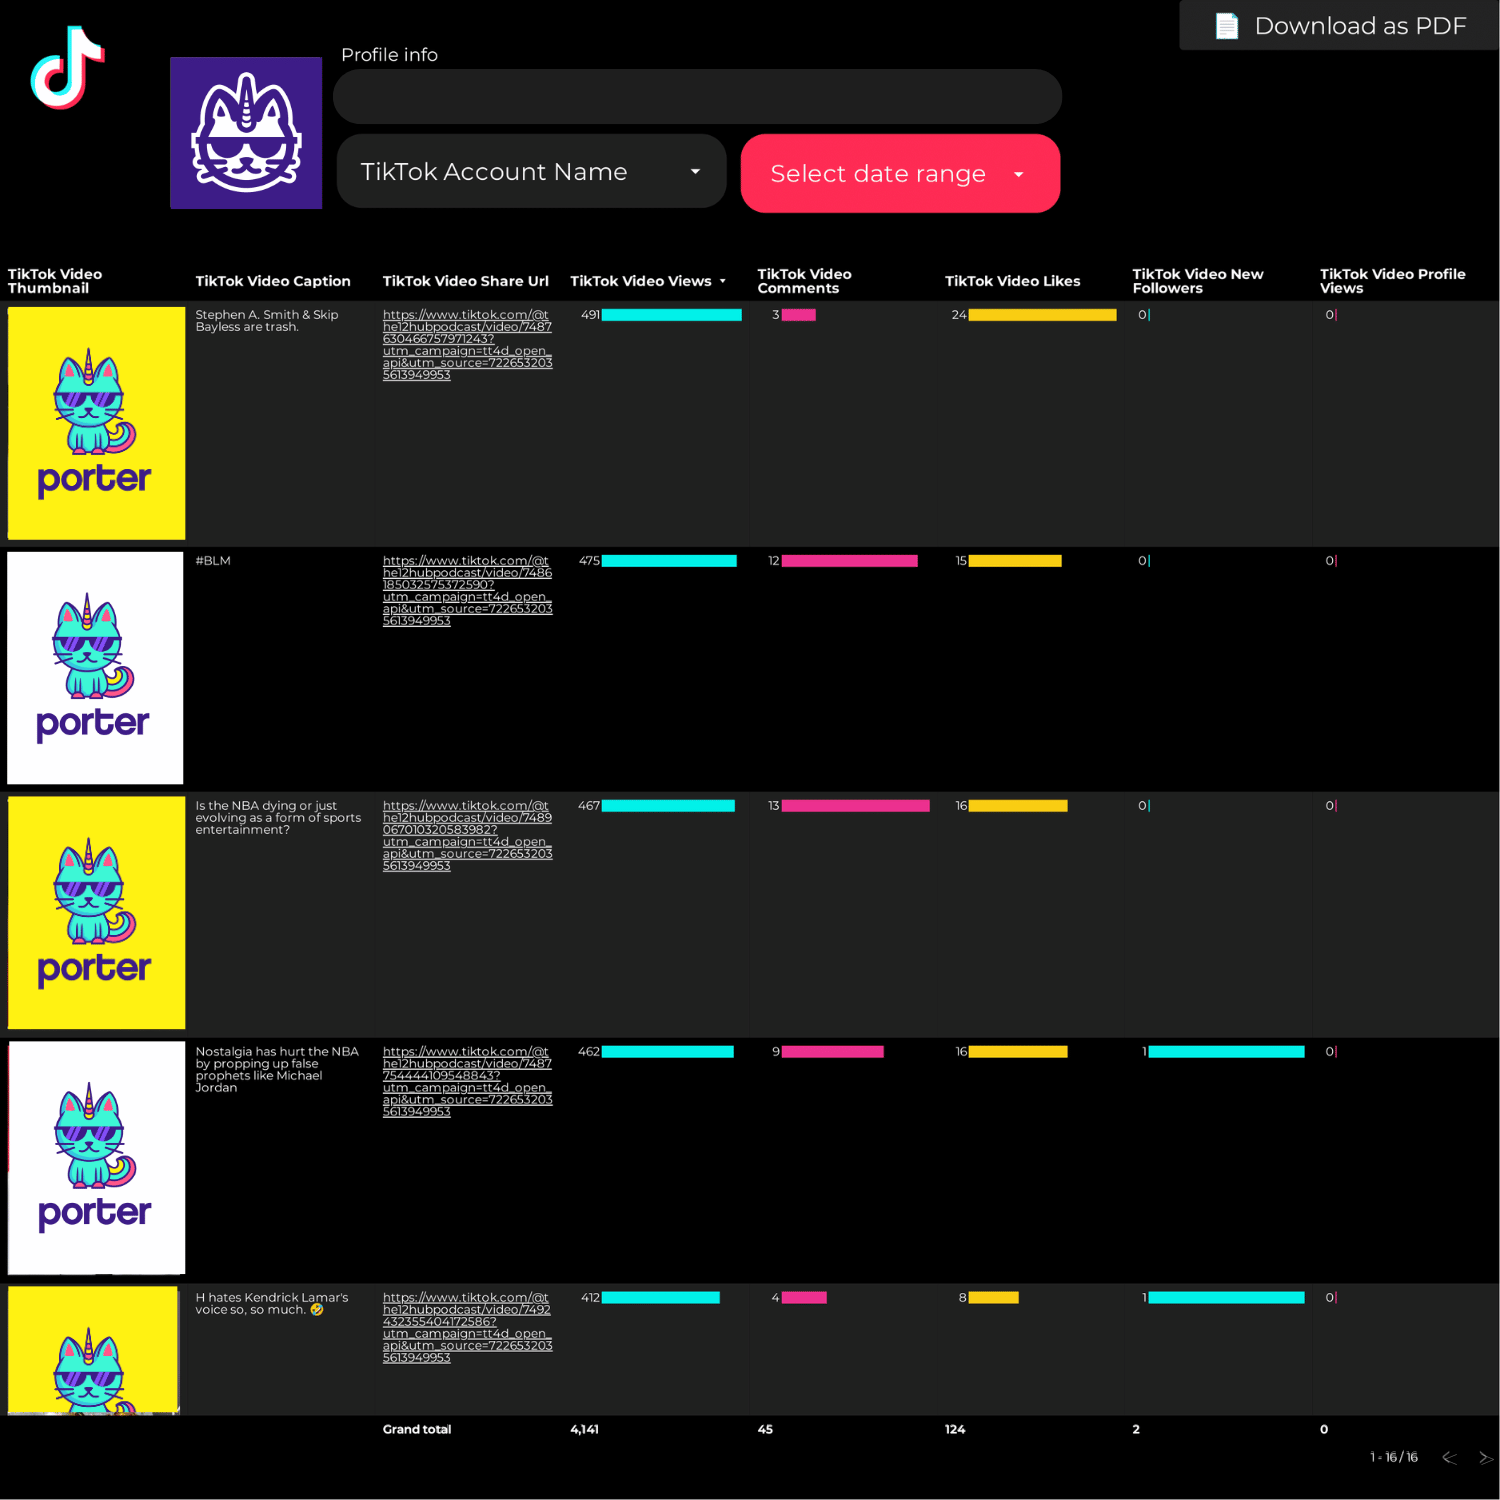
To build an engagement rate dashboard, 1) connect your social media and website accounts to gather data. 2) Select metrics such as likes, shares, comments, and click-through rates to monitor performance. 3) Segment data by campaign, channel, audience, product, customer content, objective, and date for a comprehensive view. 4) Add filters or buttons for interactivity, such as sorting by highest engagement or specific time periods. 5) Share your findings via PDF, scheduled emails, or links for easy access and review.
An Engagement Rate Dashboard is a visual tool that tracks and analyzes the level of interaction users have with a company’s content or product. It is significant for businesses as it helps them understand their audience’s behavior, improve their marketing strategies, and increase customer retention. Tools like Looker Studio are commonly used to create these dashboards, which typically include key elements like click-through rates, likes, shares, comments, and time spent on a page. Real-time data monitoring is crucial as it allows businesses to make immediate adjustments based on current trends or issues. For a comprehensive guide on creating a marketing dashboard using Looker Studio, visit our YouTube channel: https://www.youtube.com/@porter.metrics.


 Instagram Insights
 Facebook Insights
 LinkedIn Pages
 Google Business Profile
 Pinterest
 TikTok
 Impressions
 Ad Spend