A creatives analysis report should include breaking down metrics by visibility, engagement, and conversion metrics. It should segment data by campaign, channel, audience, content, objective, and date. For example, providing the number of impressions, click-through rates, and conversions for each campaign, channel, or audience helps identify the performance of creatives at different stages. Additionally, analyzing engagement metrics like likes, shares, and comments provides insights into the effectiveness of different types of content. Lastly, conversion metrics such as lead generation or sales can highlight the impact of creatives.
To analyze this array of creatives data, follow these steps:
1) Choose metrics like visibility (impressions, reach), engagement (clicks, interactions), and conversion (conversions, ROI).
2) Add context by comparing against cost metrics, date range (e.g. weekly or monthly performance), goals (e.g. click-through-rate target), rates (e.g. engagement rate), and benchmarks for the industry or previous campaigns.
3) Segment the data by campaign (e.g. different ad sets), channel (e.g. Facebook, Instagram), audience (e.g. age groups), content (e.g. image vs. video), objective (e.g. brand awareness vs. lead generation), and date (e.g. analyze performance over time). For example, compare the engagement rate of video ads on Facebook vs. Instagram, or the conversion rate of different age groups.
To build an ad creatives analysis dashboard, 1) connect your data and accounts from platforms like Google Ads, Facebook Ads, or LinkedIn Ads. 2) Select metrics such as click-through rates, conversion rates, or cost per click to monitor performance. 3) Segment or break down data by campaign, channel, audience, product, customer content, objective, or date. For example, you might want to compare the performance of a Facebook campaign targeting millennials with a LinkedIn campaign targeting professionals. 4) Add filters or buttons to make your report interactive, such as a date range filter or a button to switch between different campaigns. 5) Share your dashboard via PDF, scheduled emails, or links to relevant stakeholders.
An Ad creatives analysis dashboard is a visual representation tool that provides insights into the performance of advertising campaigns, including metrics like click-through rates, impressions, and conversions. It is significant for businesses as it helps in making data-driven decisions, optimizing ad performance, and maximizing ROI. Tools like Looker Studio are commonly used to create these dashboards, which typically include key elements like ad spend, audience demographics, and engagement metrics. Real-time data monitoring is crucial as it allows businesses to quickly adjust their strategies based on current performance. For learning how to create a marketing dashboard using Looker Studio, check out our YouTube channel: https://www.youtube.com/@porter.metrics.
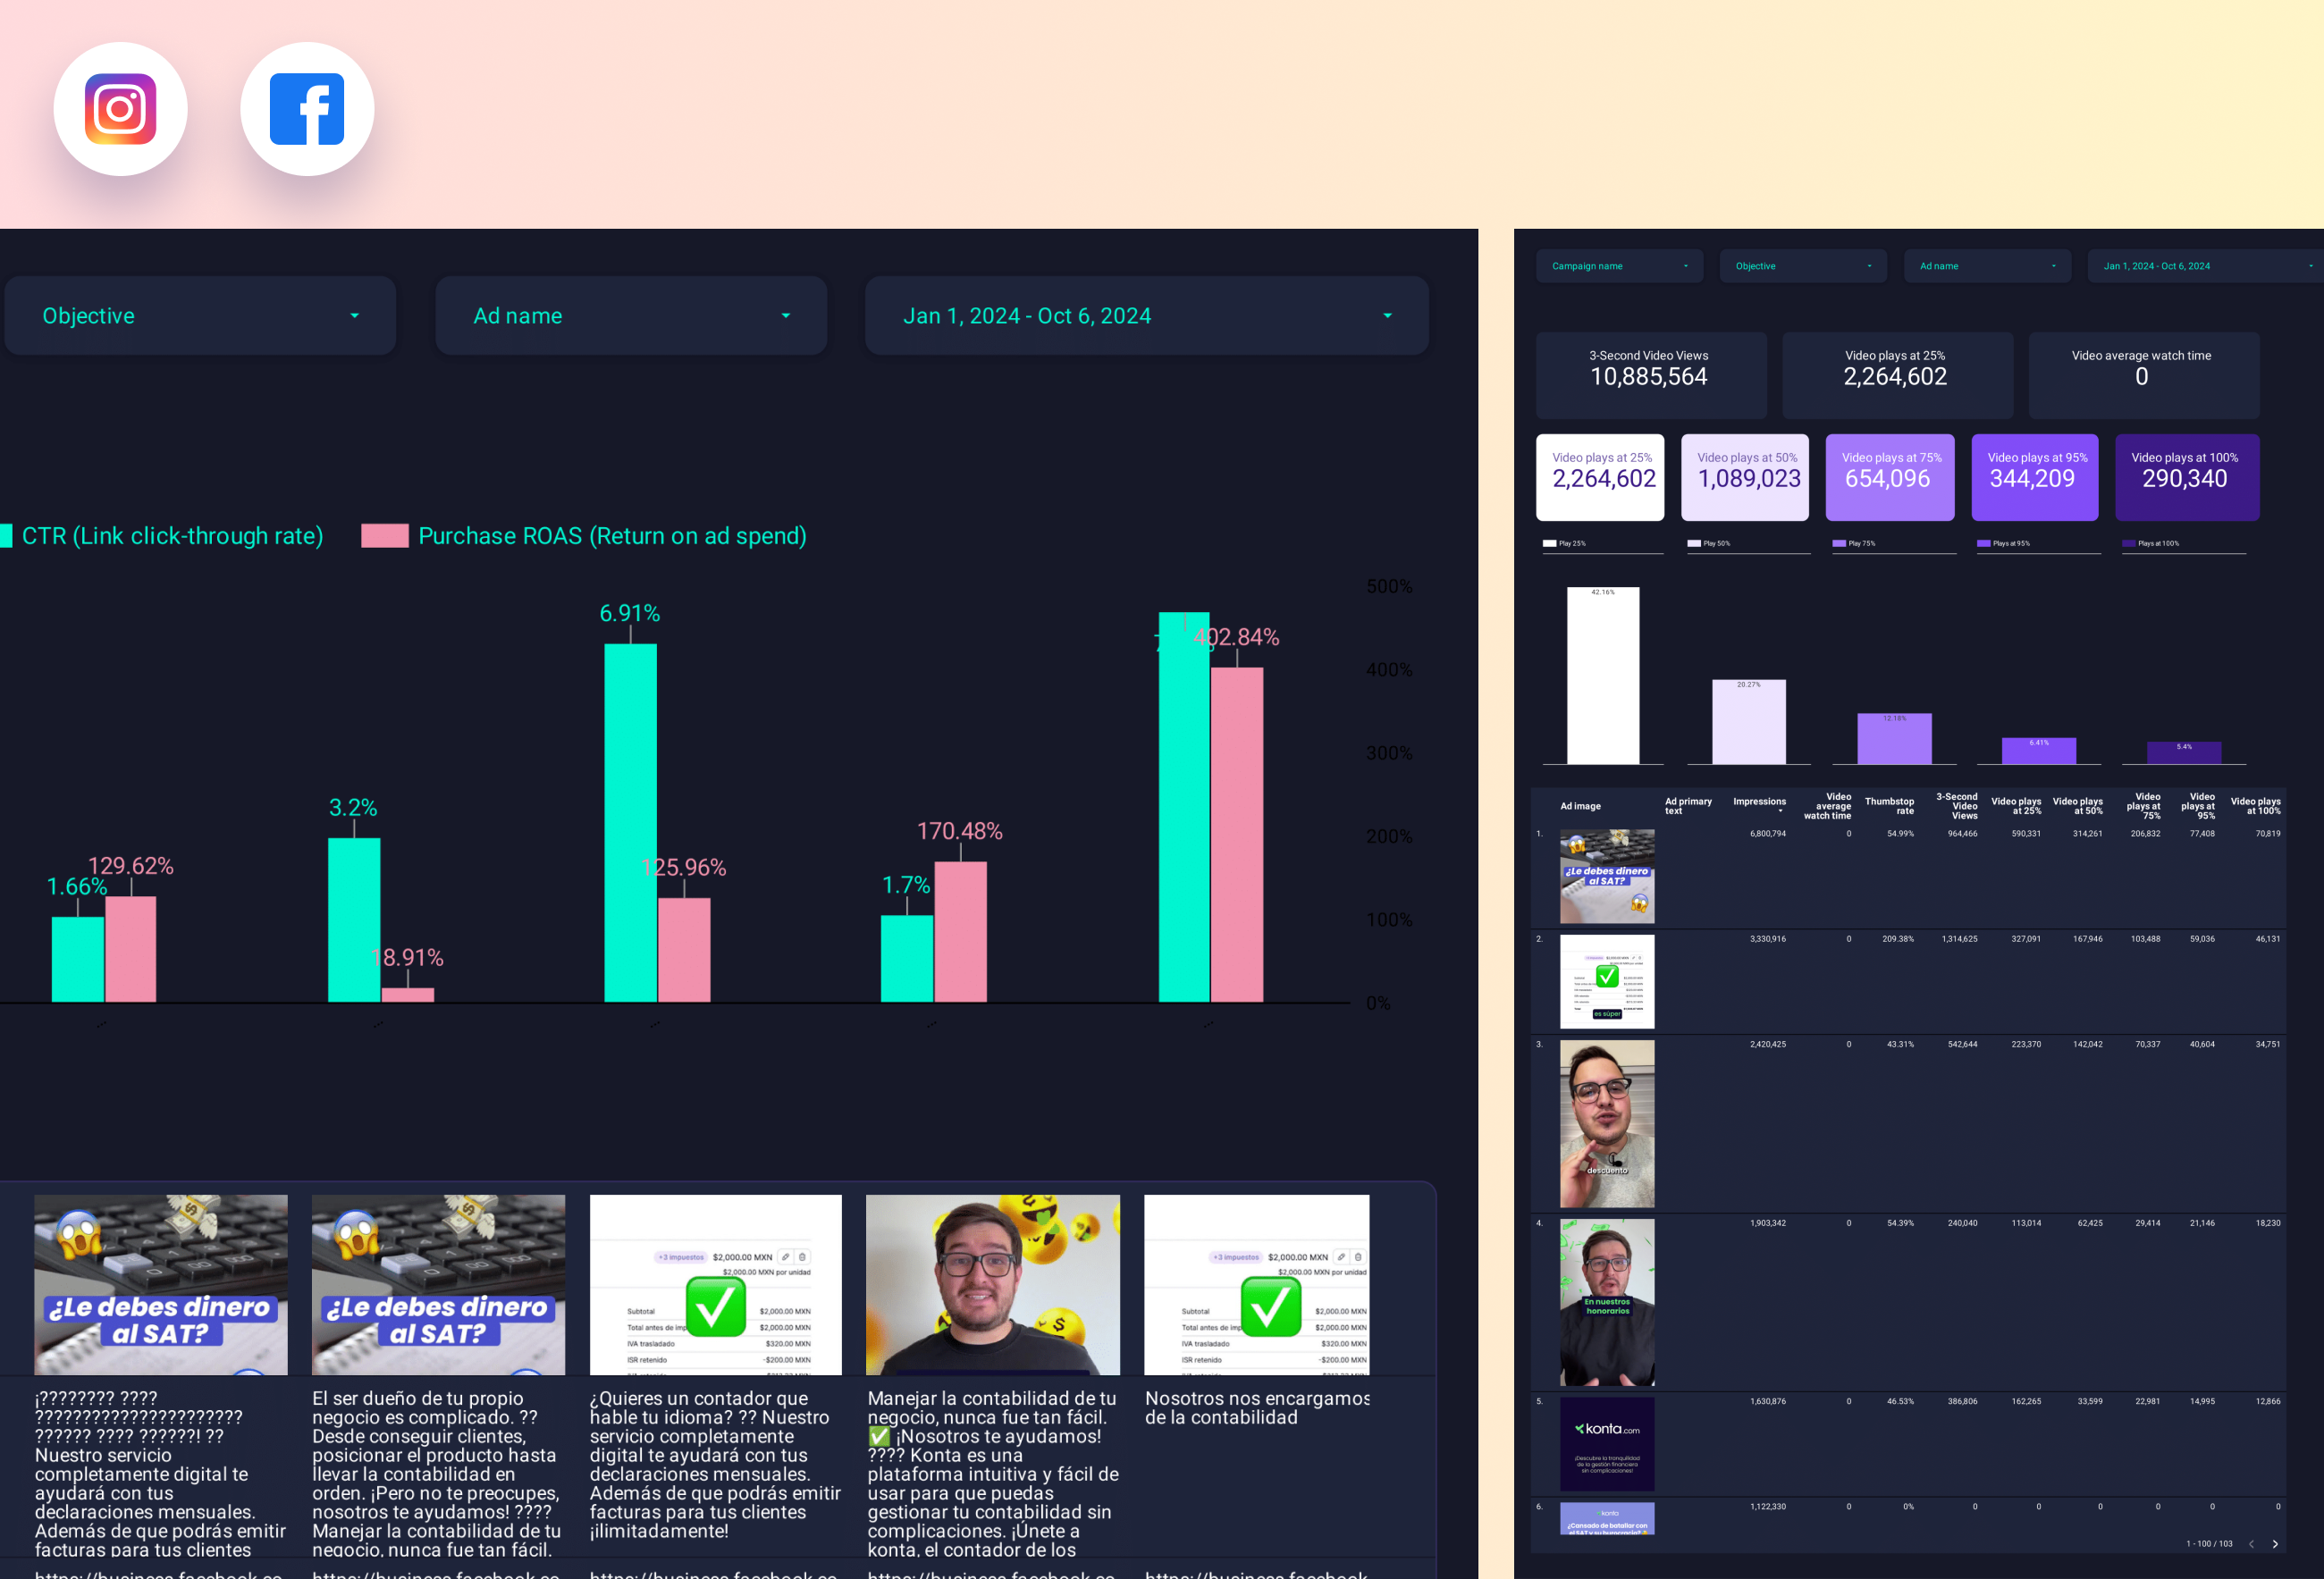
 Facebook Ads
 LinkedIn Ads
 TikTok Ads
 Twitter Ads
 Impressions
 Ad Group Name

