A AOV report should include breaking down metrics by visibility (number of impressions, reach), engagement (click-through rate, average session duration), and conversion metrics (conversion rate, average order value). It should segment data by campaign (e.g., Summer Sale, Black Friday), channel (e.g., website, social media), audience (demographics, interests), content (e.g., blog posts, product descriptions), objective (e.g., brand awareness, lead generation), and date. For example, the report may provide visibility metrics for the Summer Sale campaign on social media targeting younger audience, engagement metrics for blog posts related to new product launches, and conversion metrics for lead generation objective through email marketing.
To analyze the data on this array, you should consider the following steps:
1) Choose metrics: Break down visibility metrics by impressions, reach, and click-through rates. Break down engagement metrics by likes, shares, and comments. Break down conversion metrics by conversion rate, cost per conversion, and return on ad spend.
2) Add context: Compare metrics against the goals set for each campaign, evaluate the cost per conversion in relation to the allocated budget, assess the data within a specific date range to identify trends, and compare the metrics against industry benchmarks to determine performance.
3) Segment data: Segment the data by campaign type (e.g., awareness, consideration, conversion), channel (e.g., Facebook, Instagram), audience demographics (e.g., age, gender), specific content or ad creative, objective (e.g., brand awareness, lead generation), and date to analyze the performance variations across different segments. For example, analyze the conversion rate for a lead generation campaign targeted at millennial females on Instagram during a specific date range.
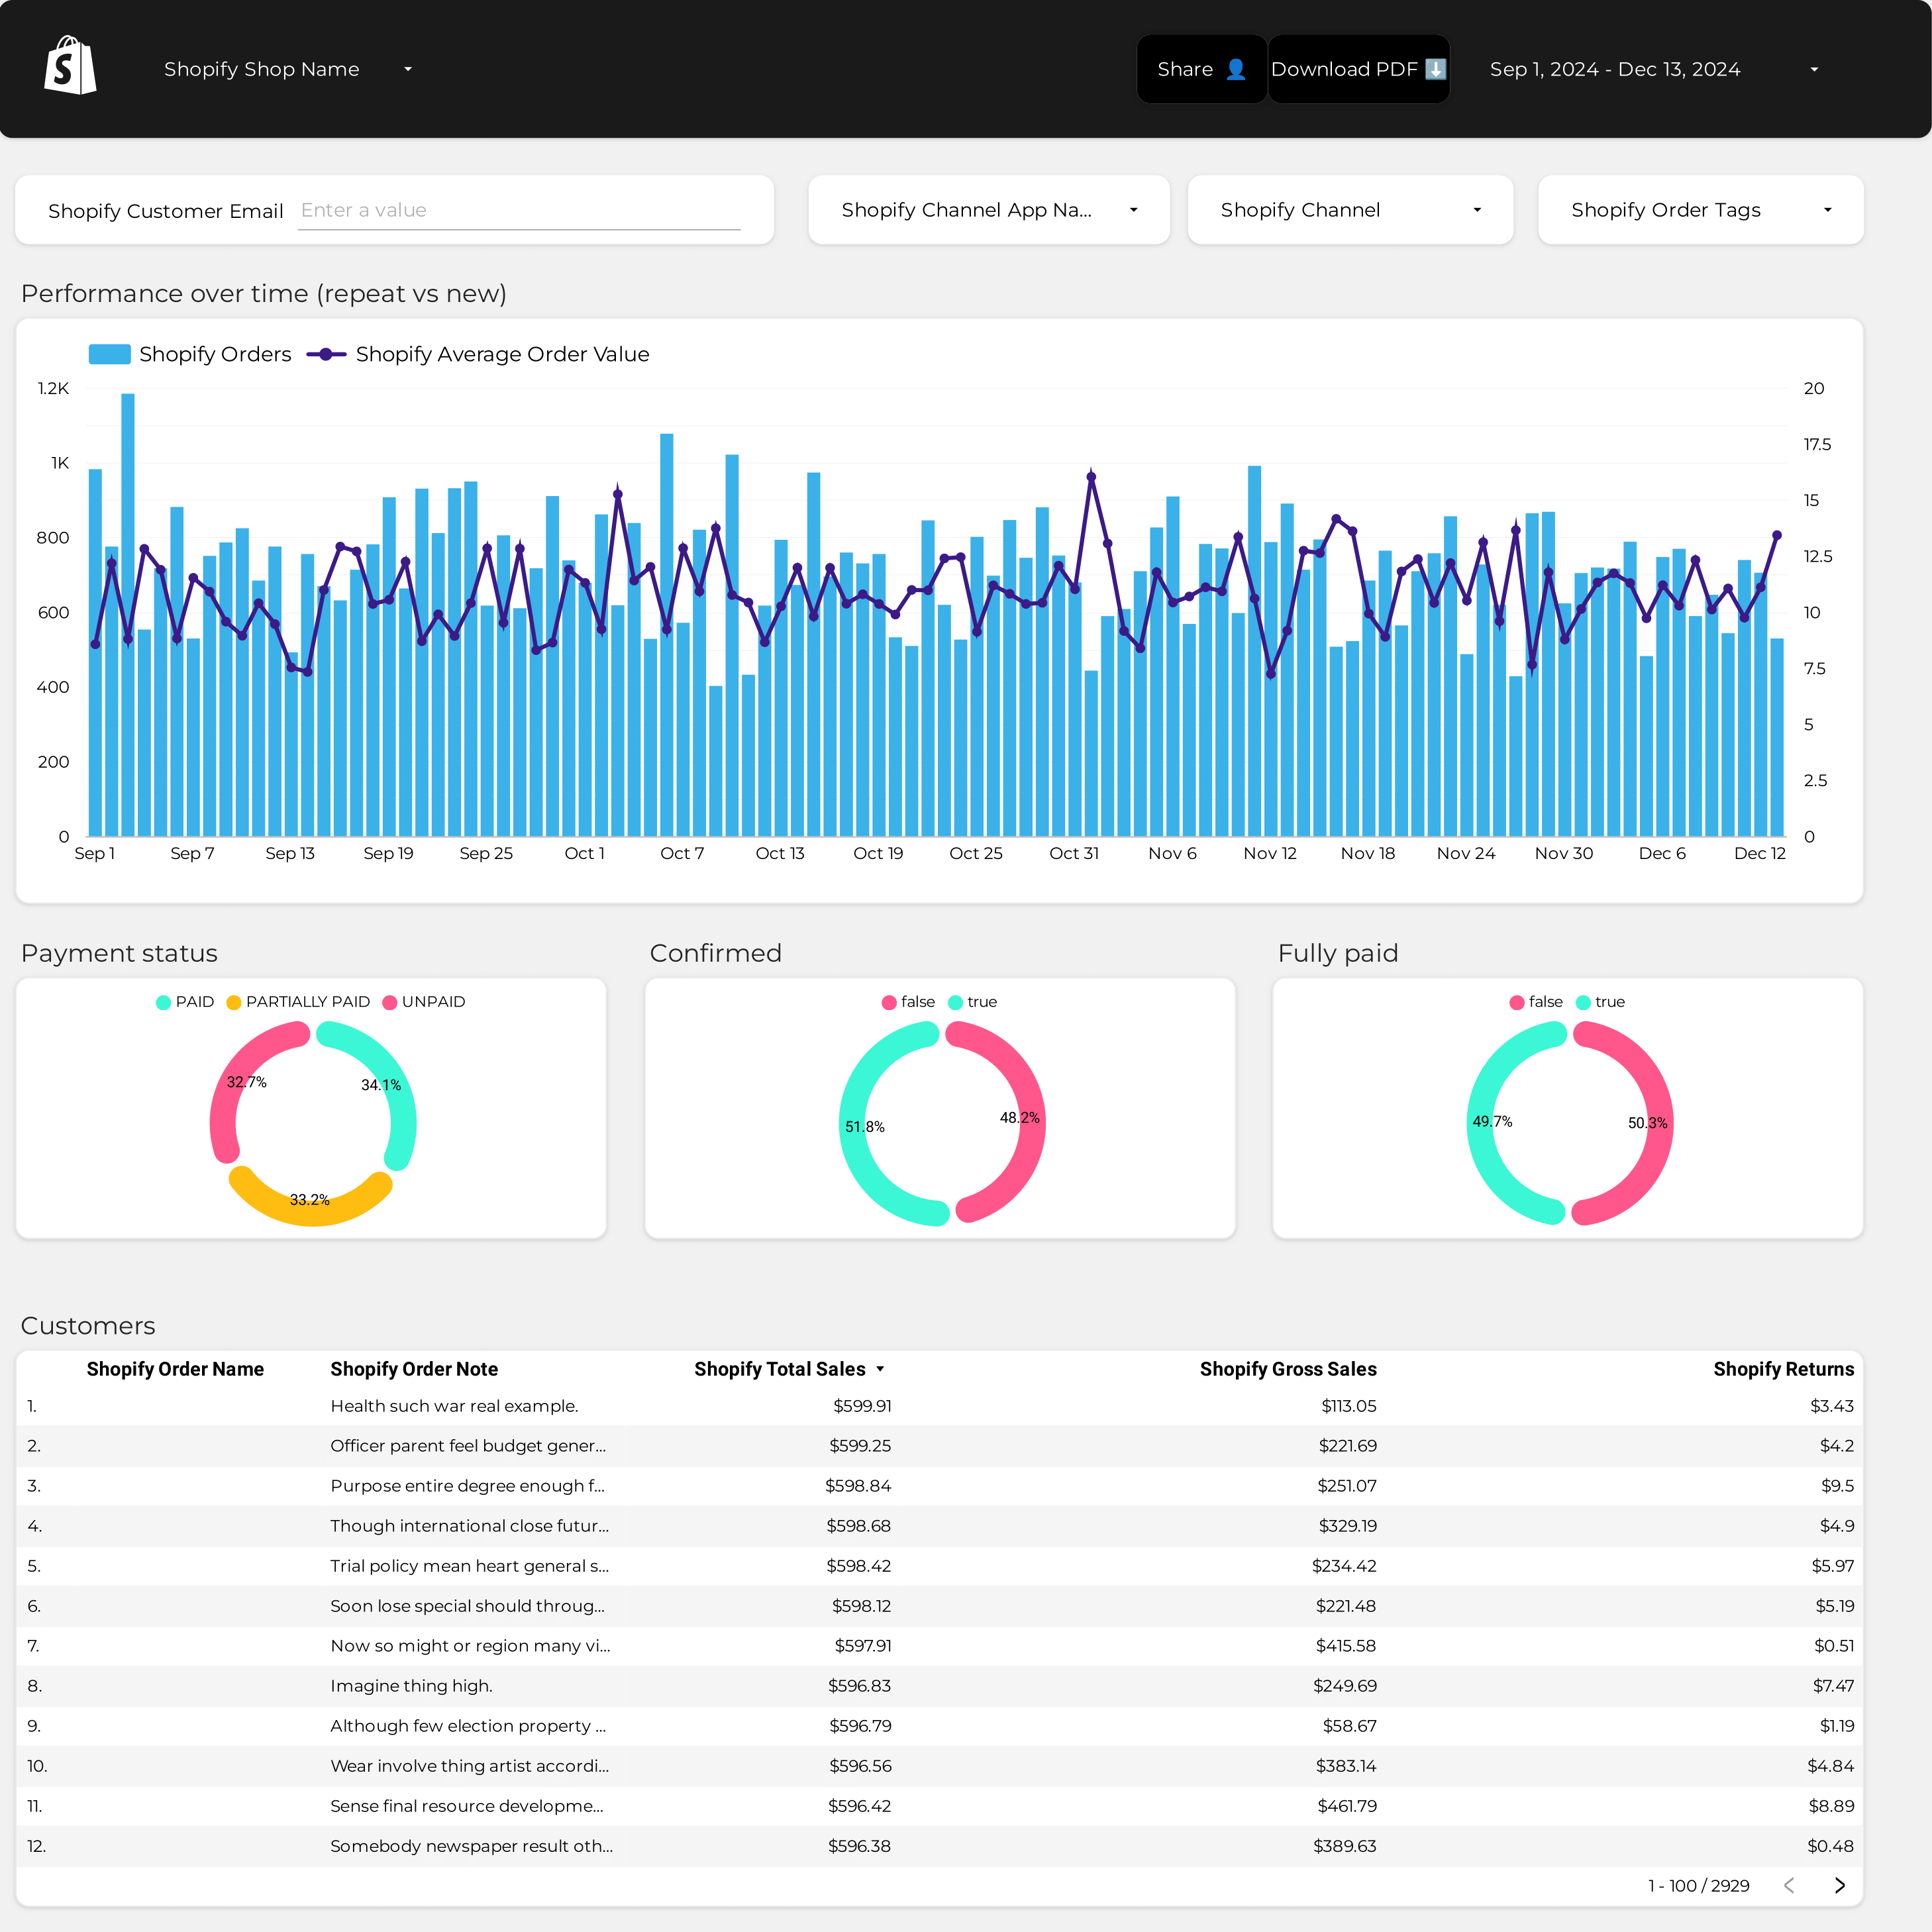
To build an Average Order Value (AOV) dashboard, 1) connect your ecommerce platform and Google Analytics accounts to gather sales and customer data. 2) Select metrics such as total revenue, number of orders, and individual order values to monitor performance. 3) Segment data by campaign, marketing channel, audience demographics, product categories, customer content preferences, sales objectives, and date ranges. 4) Add filters for different time periods, product categories, or customer segments to make your report interactive. 5) Share your AOV dashboard via PDF, scheduled emails, or direct links to relevant stakeholders.
An AOV (Average Order Value) dashboard is a tool used in e-commerce, particularly on platforms like Shopify, to track and analyze the average amount spent by customers per order. This dashboard typically includes metrics such as sales, orders, revenue, and conversion rates, helping businesses understand purchasing patterns and optimize their strategies to increase AOV. It may also integrate data on ad spend, impressions, clicks, and other relevant metrics to provide a comprehensive view of performance.
Yes, Looker Studio allows you to download your report as a PDF. To do it, follow these steps:
Before downloading your report choose the date range you want to visualize on your report.
Click on the “File” menu at the top left corner of the screen.
Select “Download as” from the drop-down menu and choose “PDF.”
You can choose which pages you want to download, and also you can add a password to protect the report and add a link back to the online report.
Click on “Download” to save the report on your device.


 Shopify
 Ad Spend
 Sales
Sales