A cross-channel report should include the following elements:
1. Campaign Name and ID
2. Ad Name, ID, Set Name, and Set ID
3. Date
4. Impressions
5. Clicks
6. Ad Spend
7. Conversions
8. Click-Through Rate (CTR)
9. Cost Per Click (CPC)
10. Return on Ad Spend (ROAS)
11. Video Views
12. Engagement Rate
13. Lead Form Opens and Submissions
14. Cost Per Lead
15. Quality Score
These metrics should be segmented by channel, such as Facebook Ads, Google Ads, LinkedIn Ads, and TikTok Ads, to provide a comprehensive view of performance across different platforms.
To analyze cross-channel data effectively, follow these steps:
1. **Data Collection**: Gather data from all relevant channels such as Facebook Ads, Google Ads, LinkedIn Ads, and TikTok Ads. Ensure you have metrics like impressions, clicks, ad spend, conversions, CTR, CPC, ROAS, and engagement rates.
2. **Data Integration**: Use tools or platforms that can integrate data from different sources into a single dashboard for a comprehensive view.
3. **Segmentation**: Segment data by campaign, ad set, or audience to identify which segments perform best across channels.
4. **Performance Metrics**: Focus on key performance indicators (KPIs) such as ROAS, CTR, and conversion rates to evaluate the effectiveness of each channel.
5. **Comparative Analysis**: Compare performance across channels to identify strengths and weaknesses. Look for patterns or trends that indicate which channels are most effective for specific goals.
6. **Attribution Modeling**: Use attribution models to understand the contribution of each channel to conversions and sales, helping to allocate budget more effectively.
7. **Optimization**: Based on insights, optimize campaigns by reallocating budget, adjusting bids, or refining targeting strategies to improve overall performance.
8. **Reporting**: Create regular reports to track progress and communicate findings to stakeholders, ensuring alignment with business objectives.
To build a cross-channel dashboard for PPC marketing in e-commerce and B2B, follow these steps:
1. **Define Objectives**: Determine the key metrics you want to track, such as impressions, clicks, ad spend, conversions, CTR, CPC, ROAS, video views, engagement rate, lead form opens, submissions, cost per lead, and quality score.
2. **Select Tools**: Use data visualization tools like Google Data Studio, Tableau, or Power BI to create the dashboard. These tools can integrate with various ad platforms.
3. **Data Integration**: Connect your data sources, including Facebook Ads, Google Ads, LinkedIn Ads, and TikTok Ads, to your chosen tool. Use APIs or third-party connectors to automate data import.
4. **Design Layout**: Organize the dashboard layout to display key metrics clearly. Group related metrics and use charts, graphs, and tables for better visualization.
5. **Customize Filters**: Add filters for campaign name, date, campaign ID, ad ID, ad name, ad set name, and ad set ID to allow for detailed analysis.
6. **Automate Updates**: Set up automatic data refresh to keep the dashboard up-to-date with the latest performance metrics.
7. **Test and Iterate**: Test the dashboard for accuracy and usability. Gather feedback and make necessary adjustments to improve functionality and insights.
By following these steps, you can create a comprehensive cross-channel dashboard that provides valuable insights into your PPC marketing efforts across different platforms.
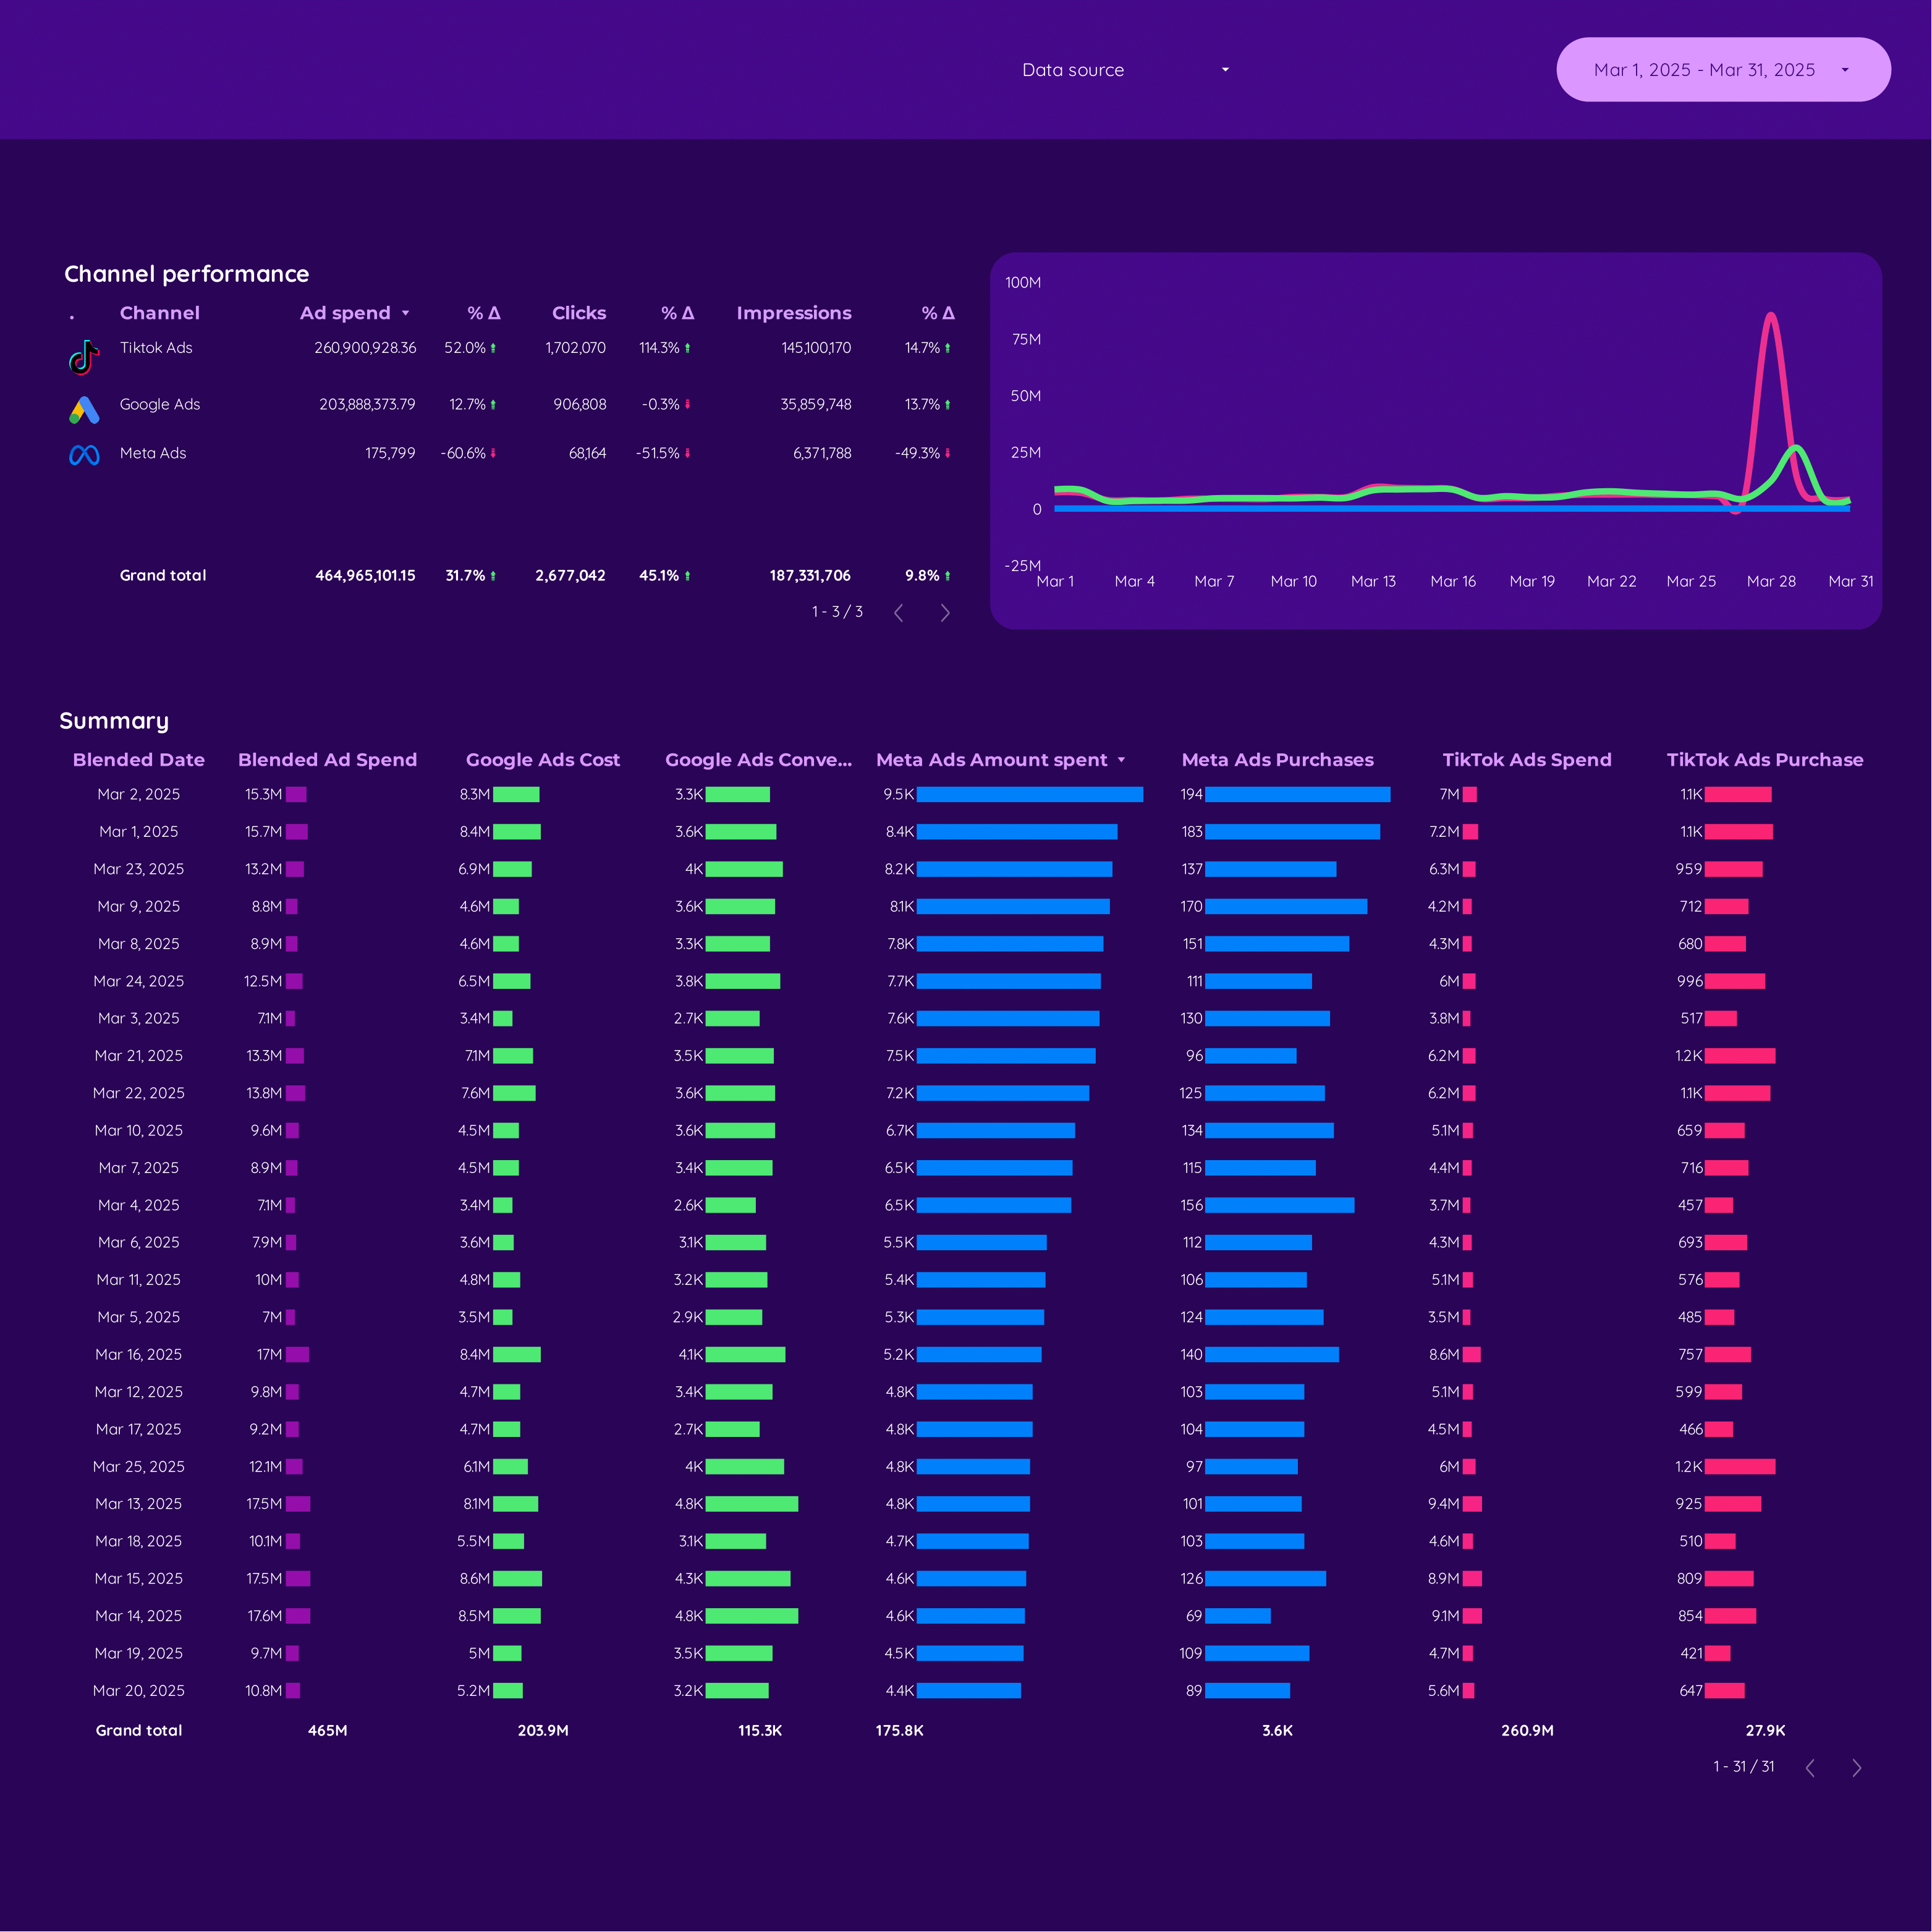
A cross-channel dashboard is a tool used in marketing and e-commerce to consolidate and visualize data from multiple advertising platforms such as Facebook Ads, Google Ads, LinkedIn Ads, and TikTok Ads. It allows marketers to track and analyze key performance indicators (KPIs) like impressions, clicks, ad spend, conversions, CTR, CPC, ROAS, and more, across different channels in one unified view. This helps in making informed decisions and optimizing campaigns for better performance in B2B and PPC marketing strategies.
I don’t know if you can download the template in PDF format based on the provided context.


 Google Ads
 LinkedIn Ads
 Facebook Ads
 TikTok Ads
 Impressions