In this comprehensive guide you will learn how to create filters on Looker Studio, based on real examples. I’ll show you how to create basic filters without knowing anything about coding or design.
Here you have a step-by-step video on how to create a filter in less than 4 minutes:
How do I add a filter to a Looker Studio chart?
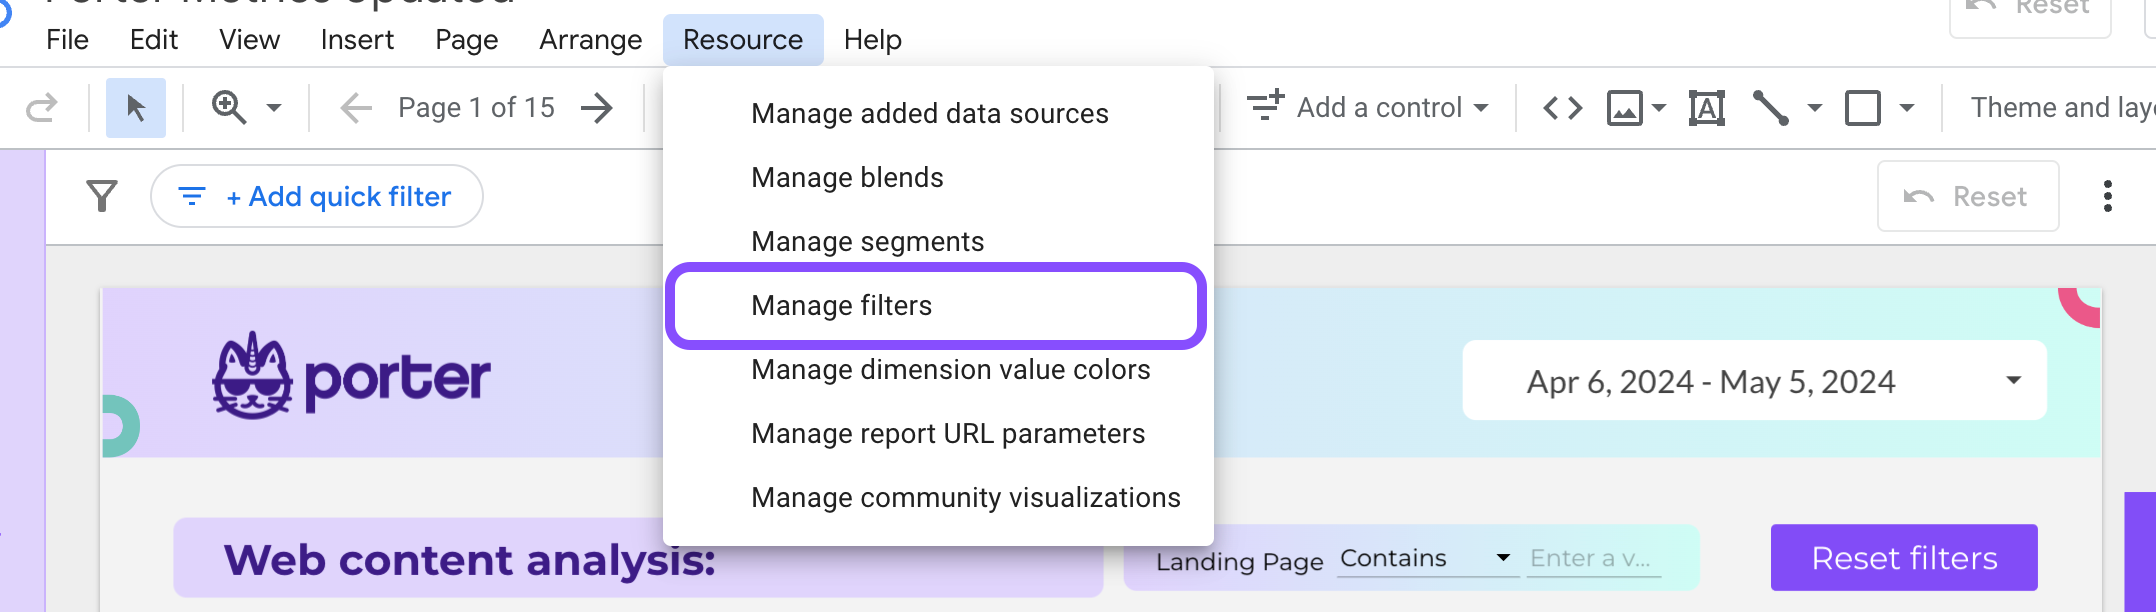
To add a filter and customize your Looker Studio report, open your report, click on ‘Resource’ and select ‘Manage filters’.
Click +Add a filter to start creating and customizing dashboard filters.
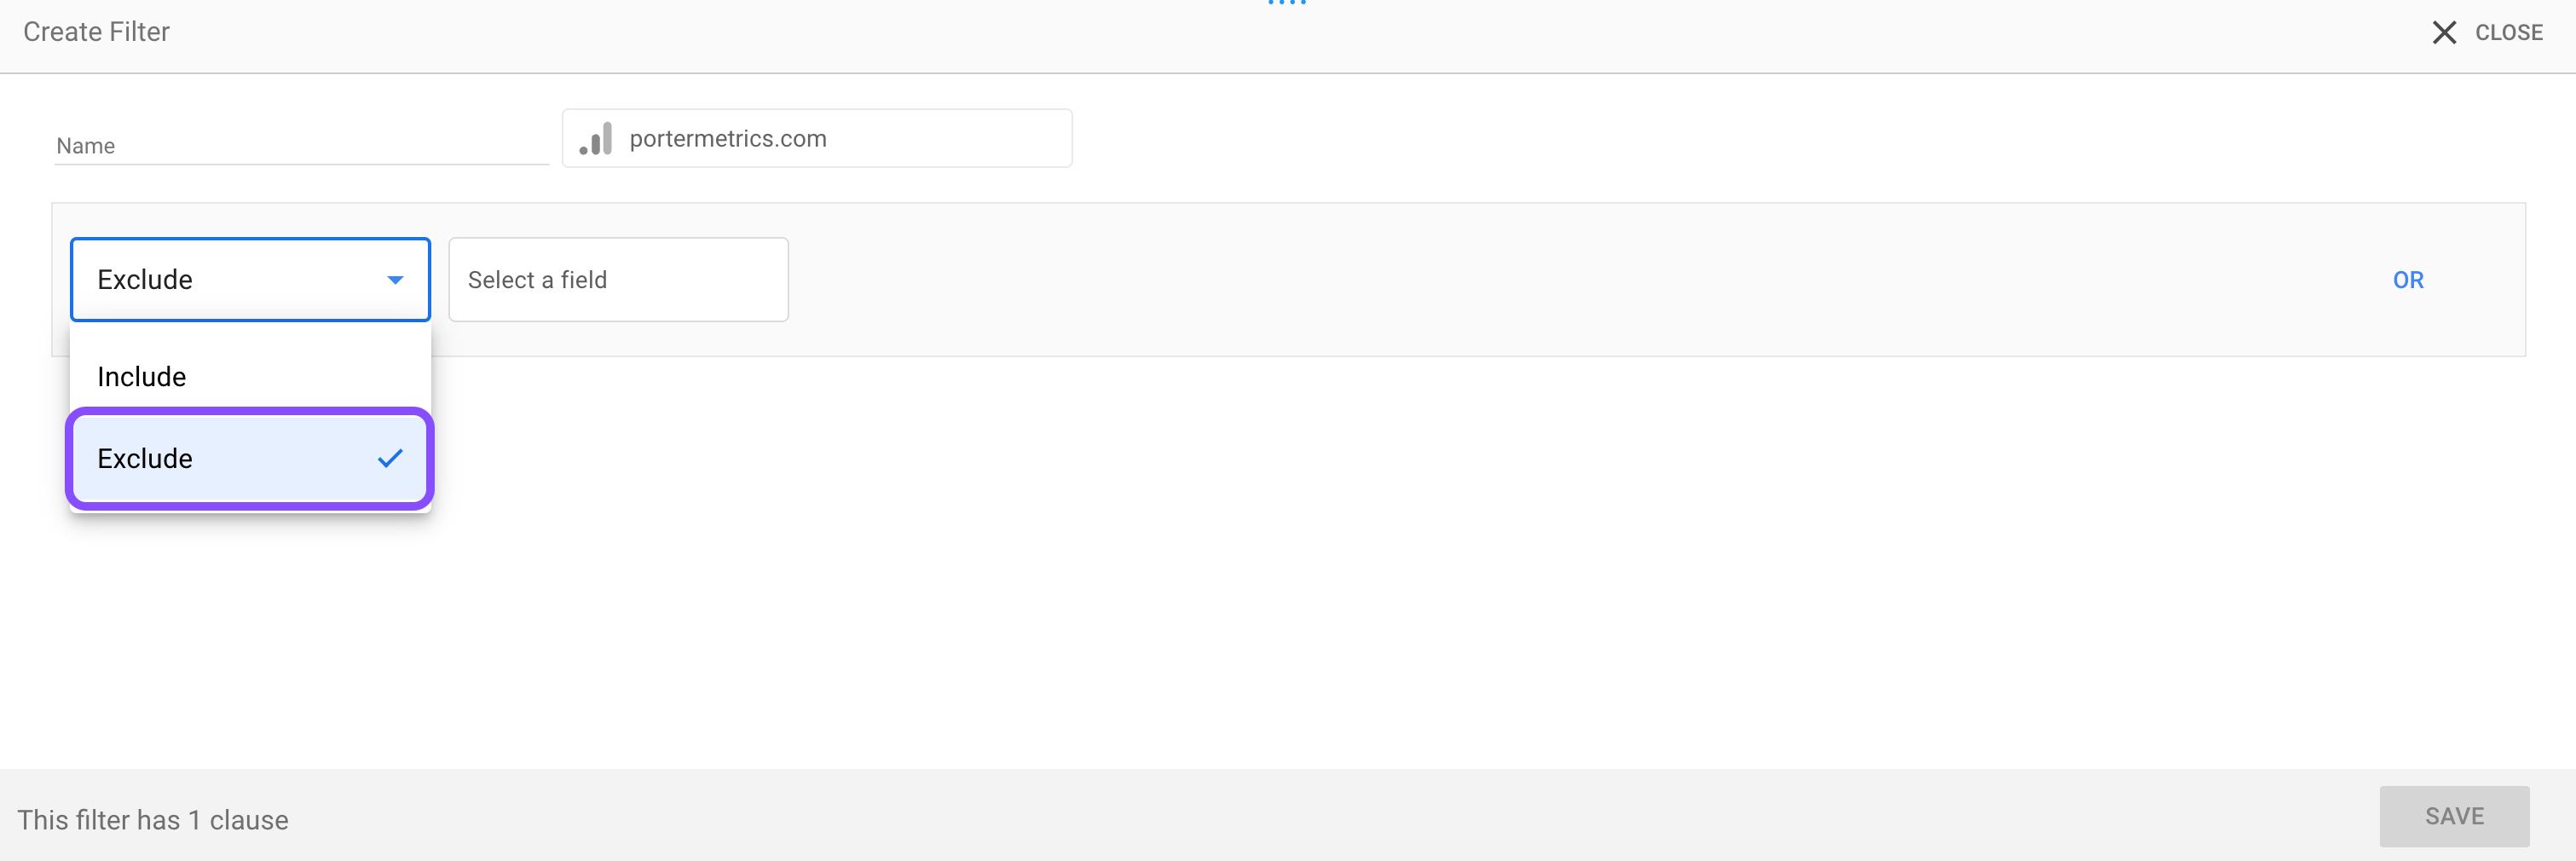
Select the Include or Exclude clause. Use include if you want to include only data that matches your condition. Exclude will remove all matching data.
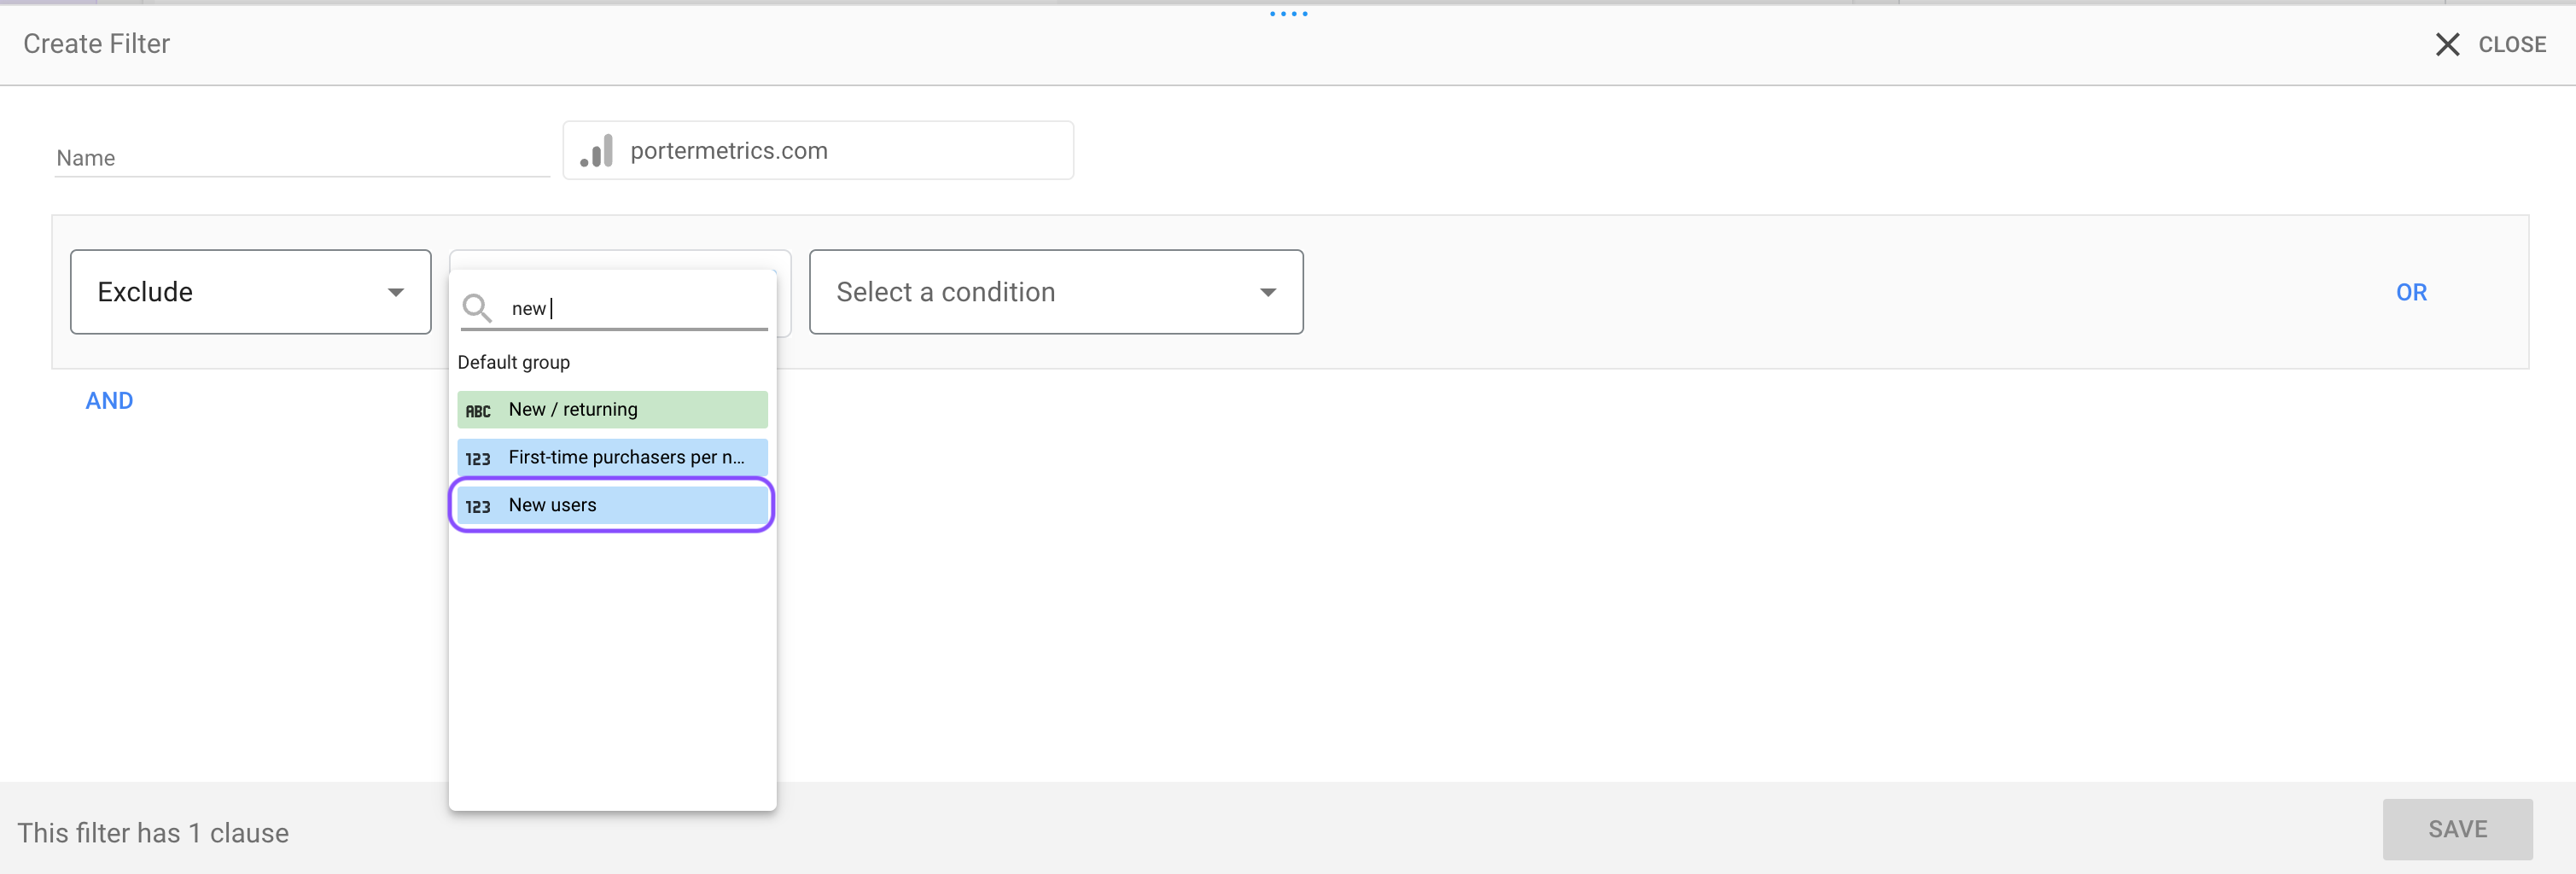
Now select the dimension or metric you want to filter your report by. For instance, in this case I’m filtering by ‘Event name’
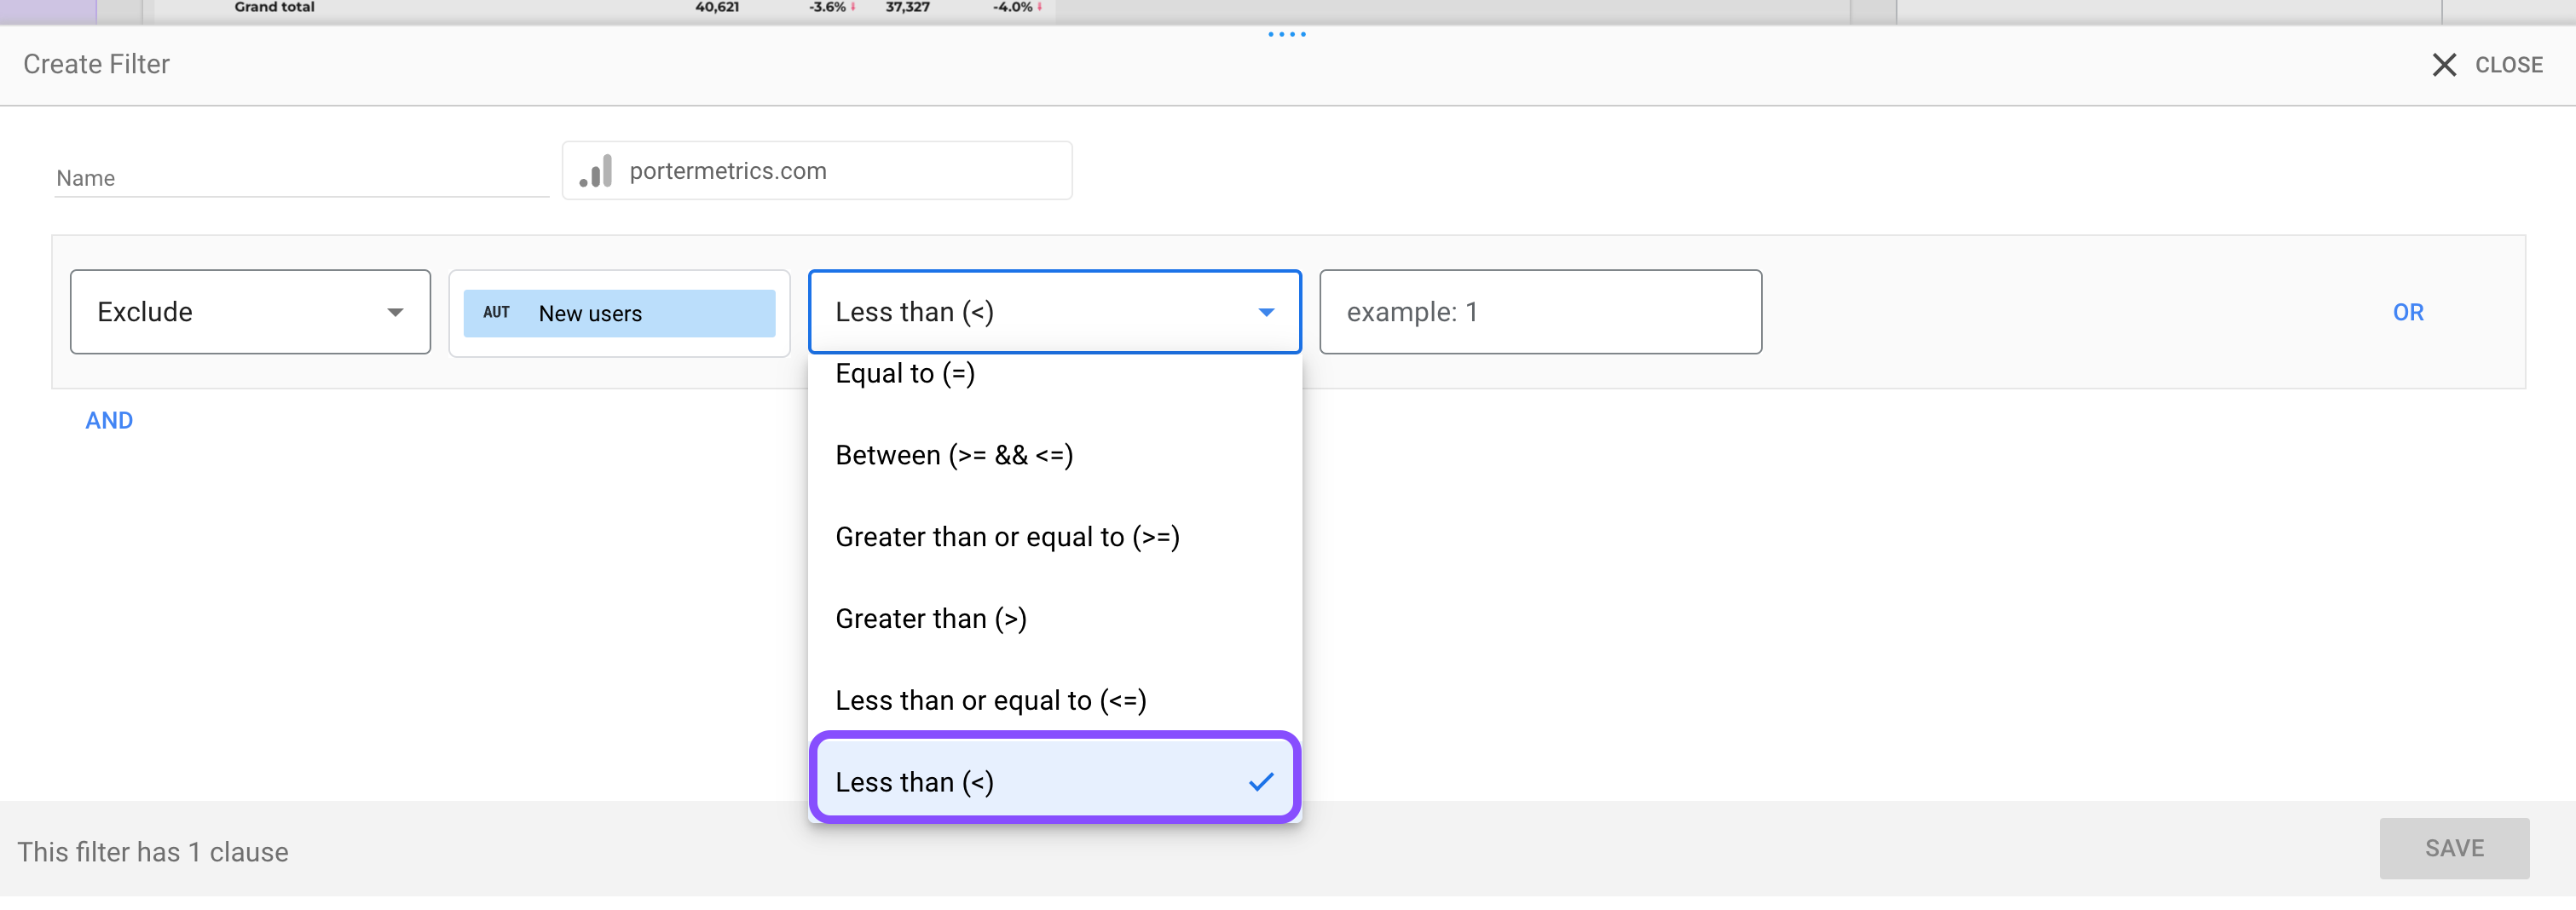
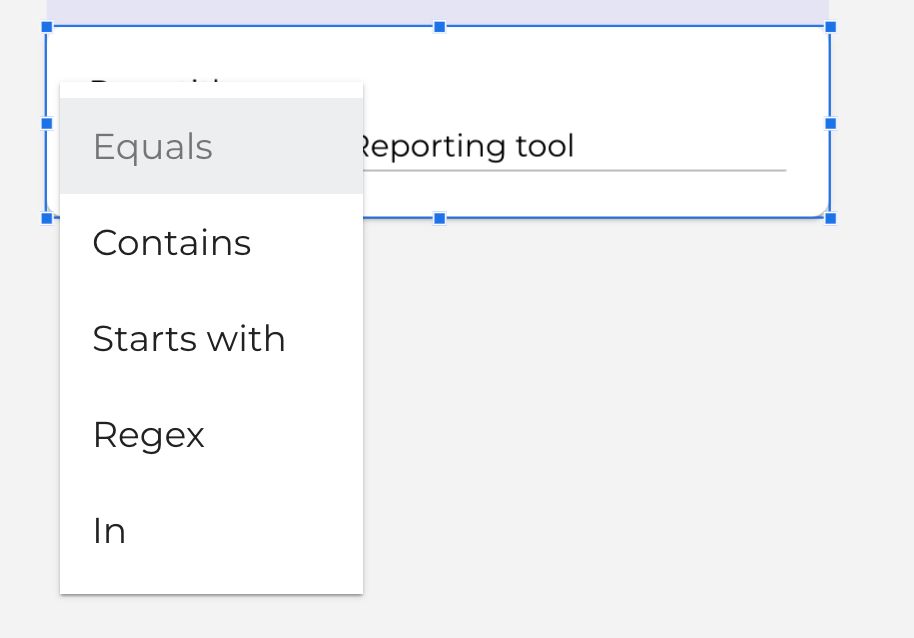
Select the comparison operator to define how the dimension/metric will be compared to the value you provide. Common operators include Equals, Contains, Starts with, Ends with, Greater than, Less than, etc
Input the value or text, depending on the comparison operator you used.
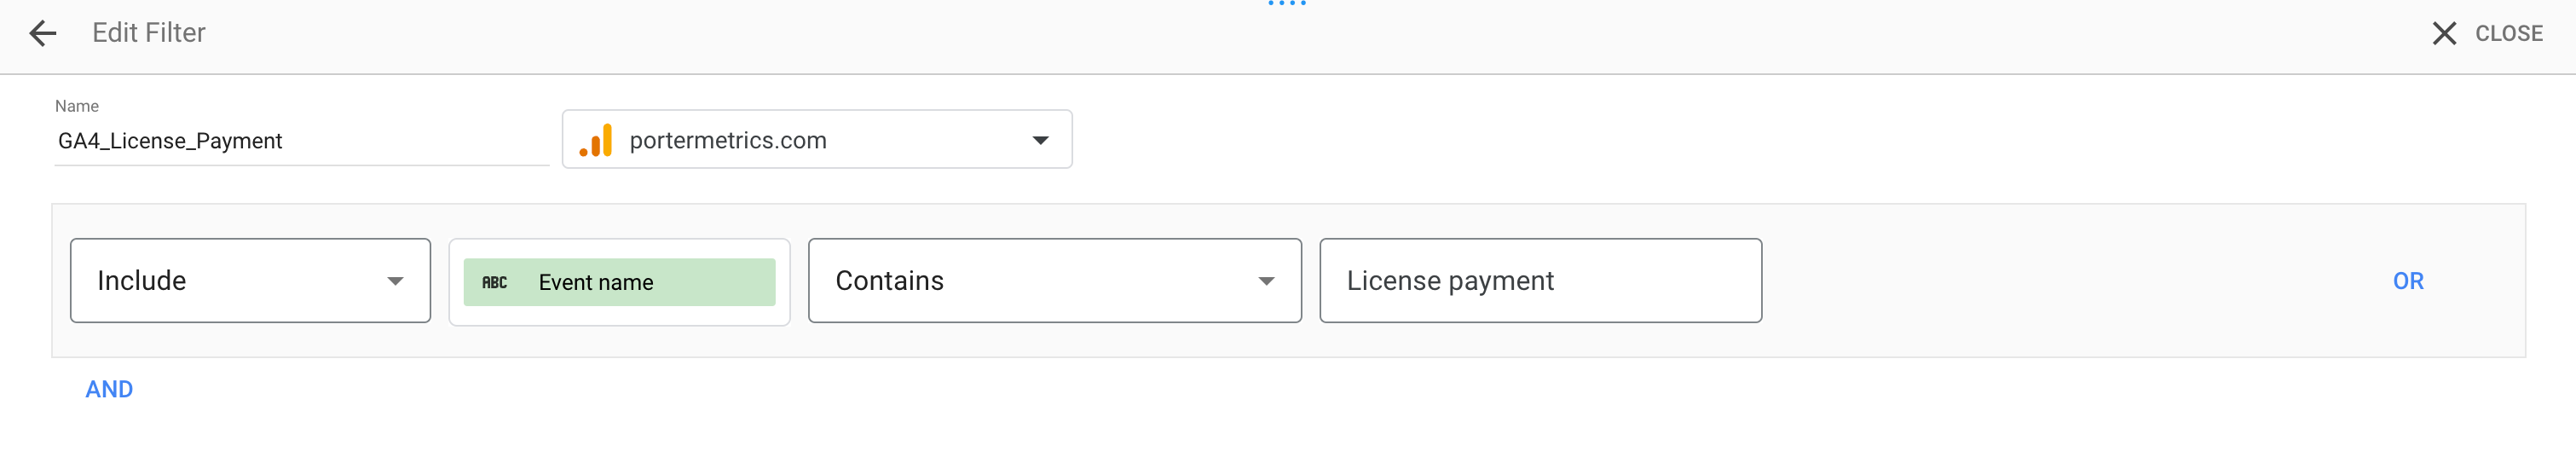
6. Remember to add a name to your filter and click SAVE to create the filter.
(Optional) If you’re interested in adding an OR clause, click OR on the right of the condition.
(Optional) Also, if you’re interested in adding an AND clause, click AND below the clause.
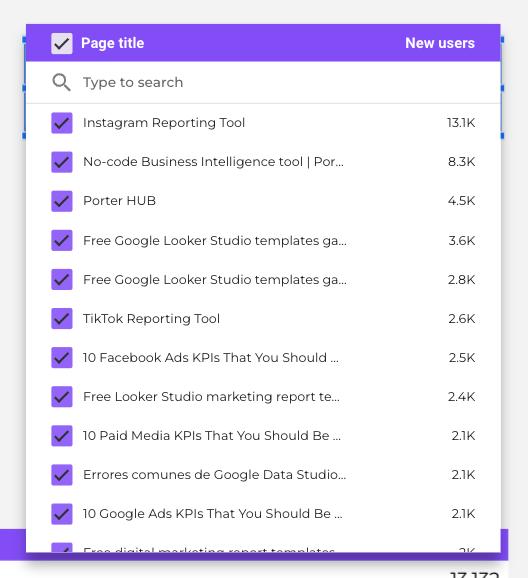
How to add a quick filter
To ‘+Add a quick filter’ in the filter bar behind the main menu bar.
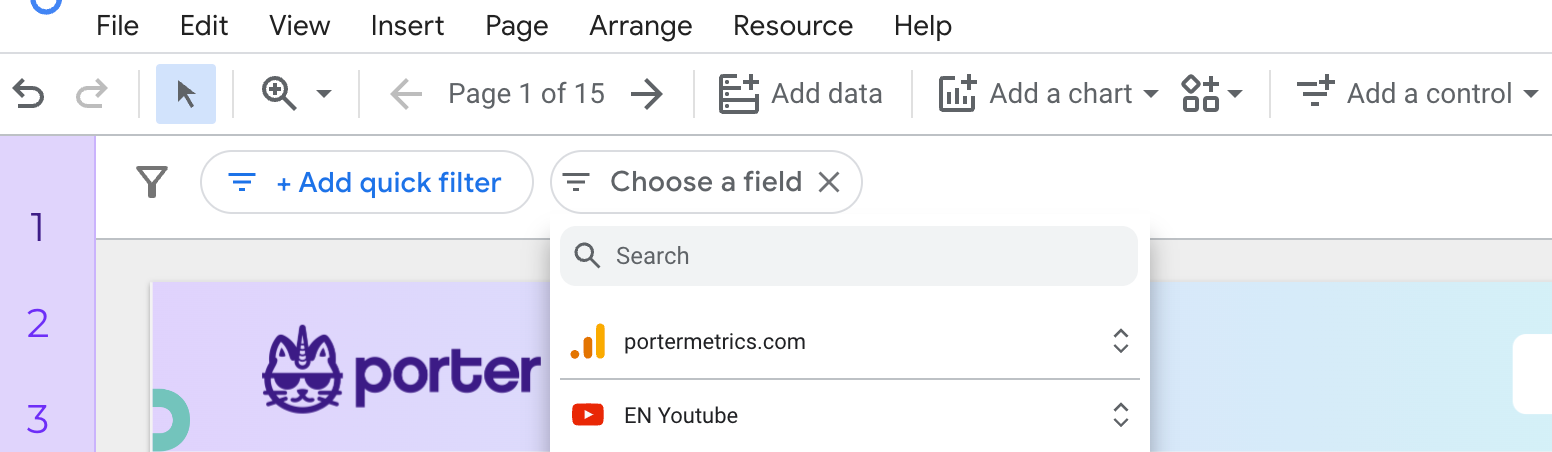
Select the data source you want to use, in case you have multiple data sources.
Select the dimension or metrics you want to filter your report by. In this case I’m filtering by ‘Landing Page’
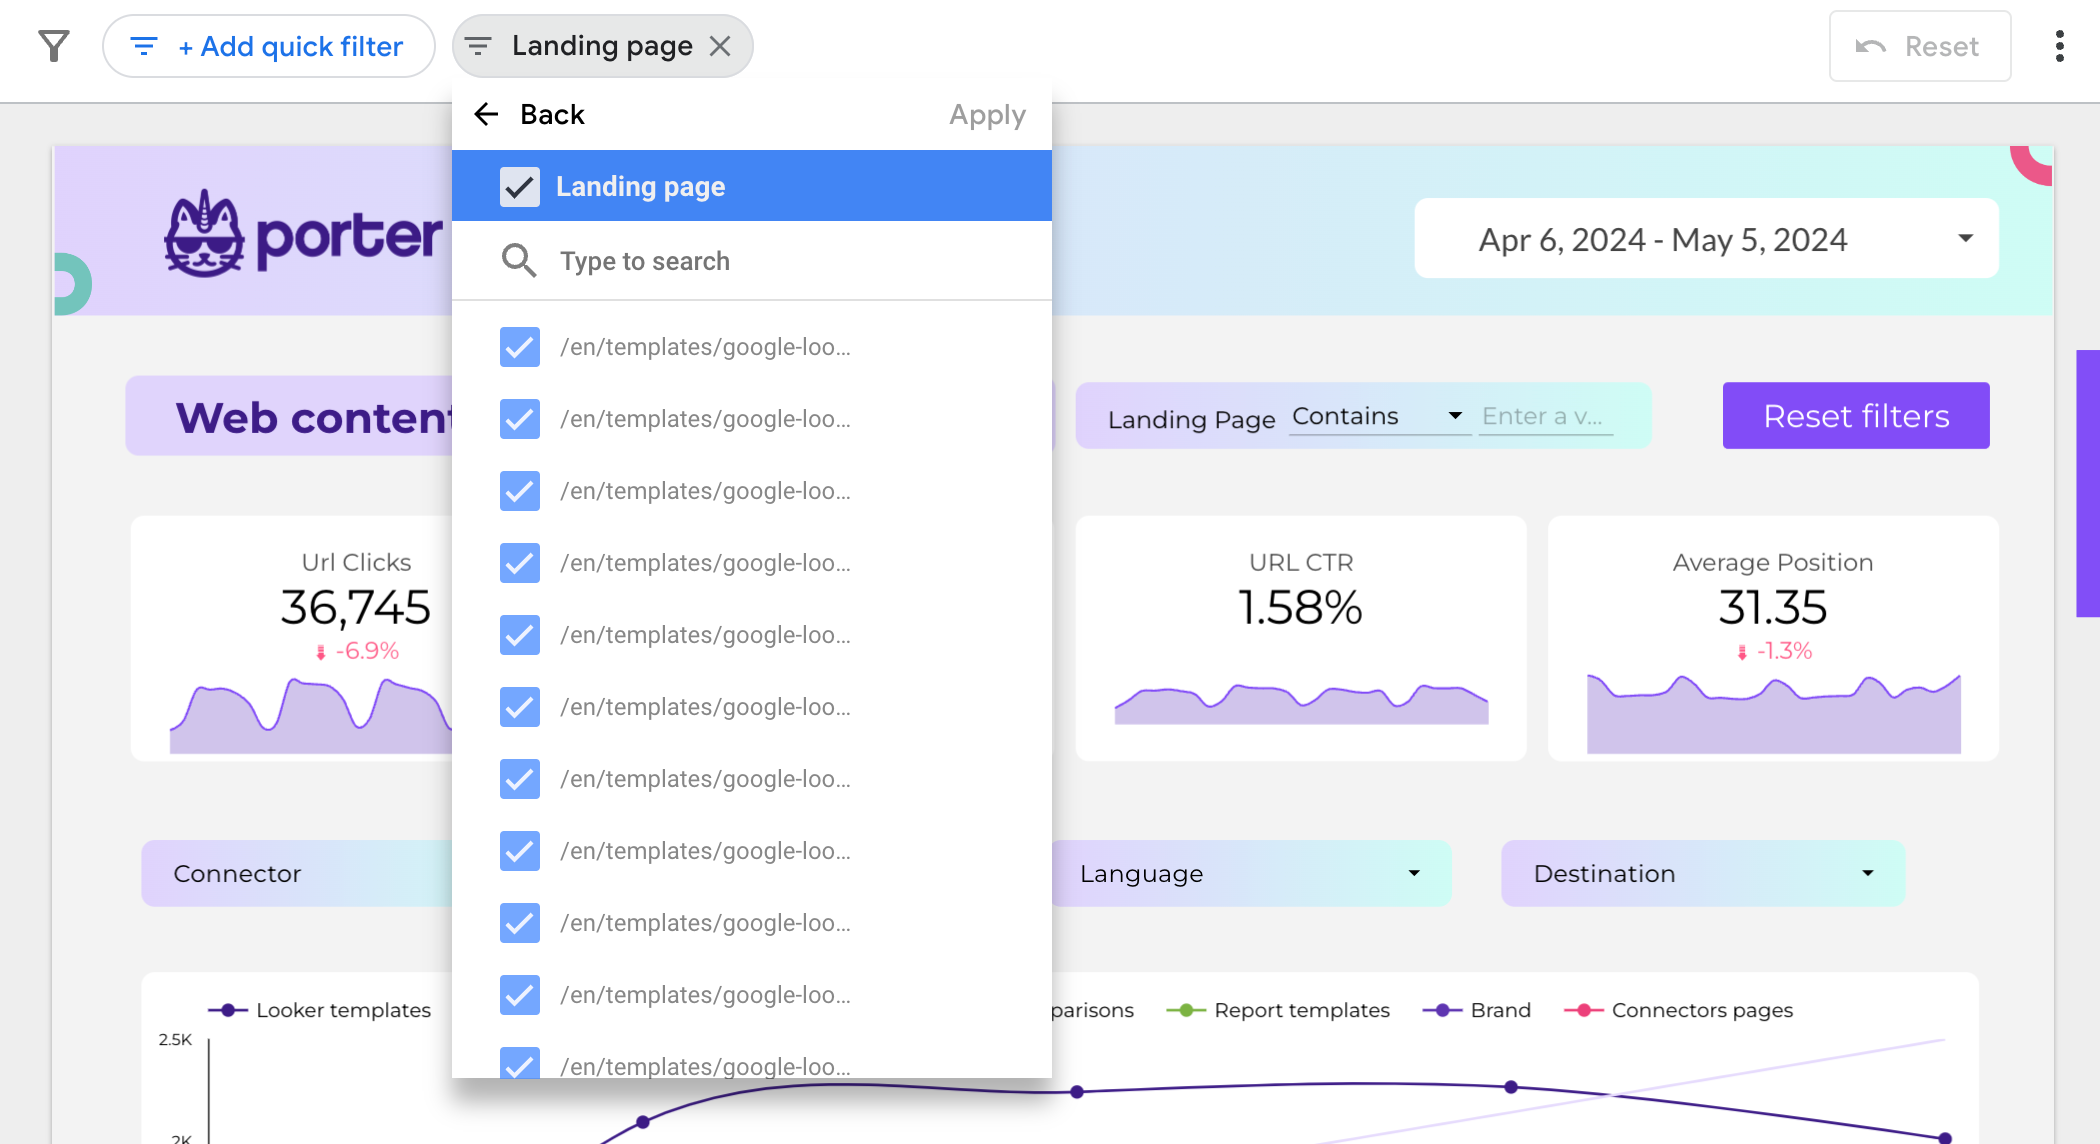
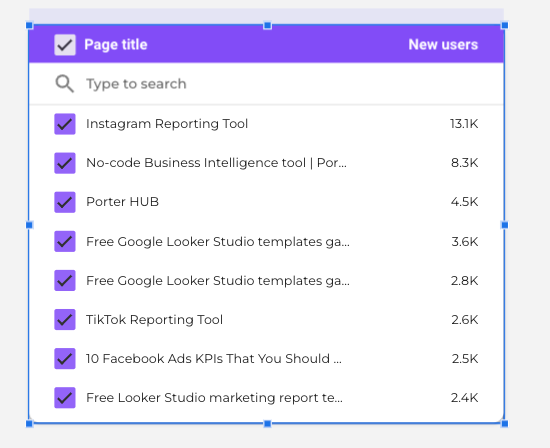
Now click on the checkbox to include or exclude a value.
How to add a page filter
The main difference between the page and report levels is that the Report Level has a higher hierarchy than Page Level filters.
Page filters apply to every chart on that page. For example, by filtering on the Device Category dimension, you can dedicate page 1 of your Google Analytics report to desktop traffic and page 2 to mobile traffic.
As for the report filters, all the pages in the report are subject to them.
For instance, you can create a report that concentrates on your best customers by specifying the report-level filter property to Lifetime Value equal to or greater than 10,000.
How do I add a filter to all pages on a Looker Studio report?
Here’s how to add a filter to all pages in a Looker Studio:
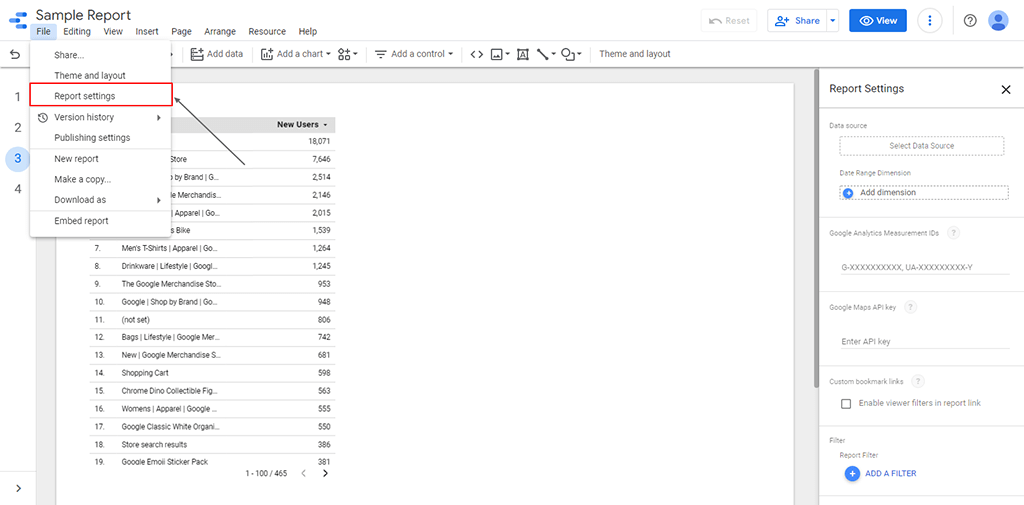
To apply a filter to the entire report, select File > Report settings in the menus.
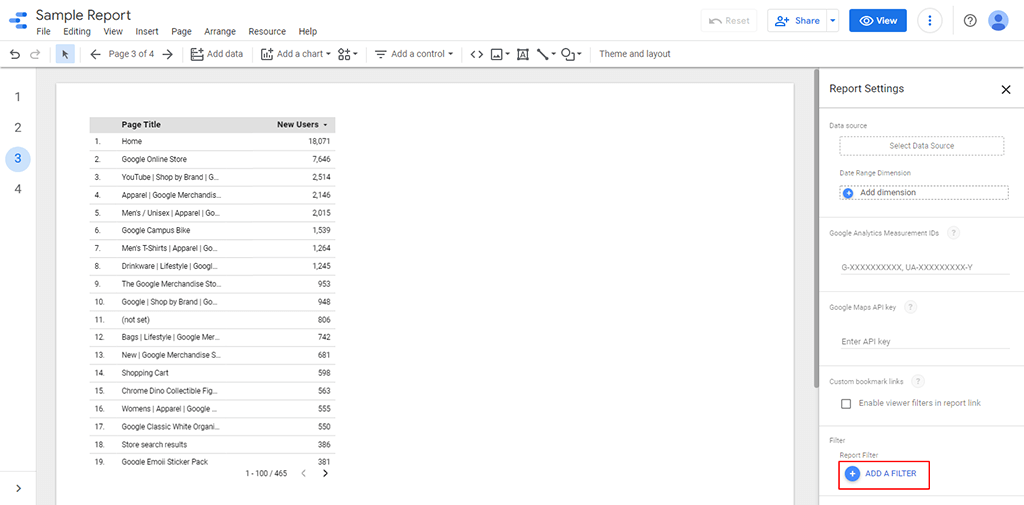
Then, click +ADD A FILTER in the properties panel on the right.
After that, you can set up the filter using an existing filter or click on CREATE A NEW FILTER.
If you don’t have a filter already set up, follow steps 6-13 in the How Do I Filter A Google Data Studio Chart heading to set up a new filter.
How To Manage Filters
Managing and understanding all the filters in your report is crucial for effective data visualization and reporting. Now that we know how to create filters on Google Looker Studio, we also need to know how to manage them.
In this section of the post, I’ll take you through the various functions and settings you can use to manage your filters.
Filter Controls
When a control depends on a dimension (you can add a dimension as the Control field from the available fields list), the control acts as a filter to clean the data.
For instance, a list control with the Country dimension allows you to filter the data by country.
Drill Down
Drilling down offers you a way to unveil extra levels of detail within a chart.
For instance, you want to report sessions by country and city. Rather than creating two charts for the two scenarios, you can include a single chart with drill-down enabled.
When you enable drill-down on a chart, you can
Drill down from a higher hierarchy of detail to a lower one (e.g., from Month to Week).
Drill up from a lower hierarchy of detail to a higher one (e.g., from Week to Month).
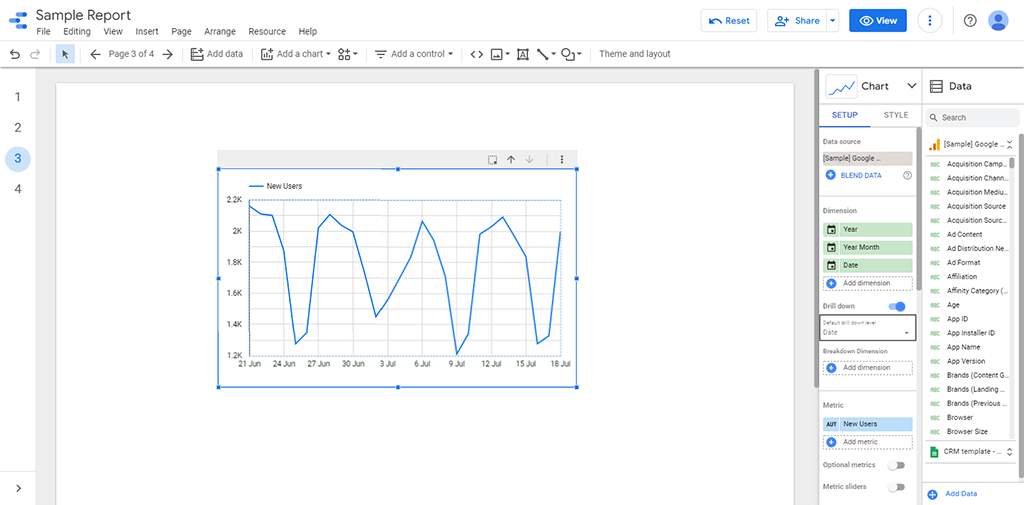
Here’s how to turn on drill-down for a chart.
First, edit your report.
Then, pick a chart.
After that, select the SETUP tab in the properties panel on the right.
Then, under Dimension, turn on Drill down.
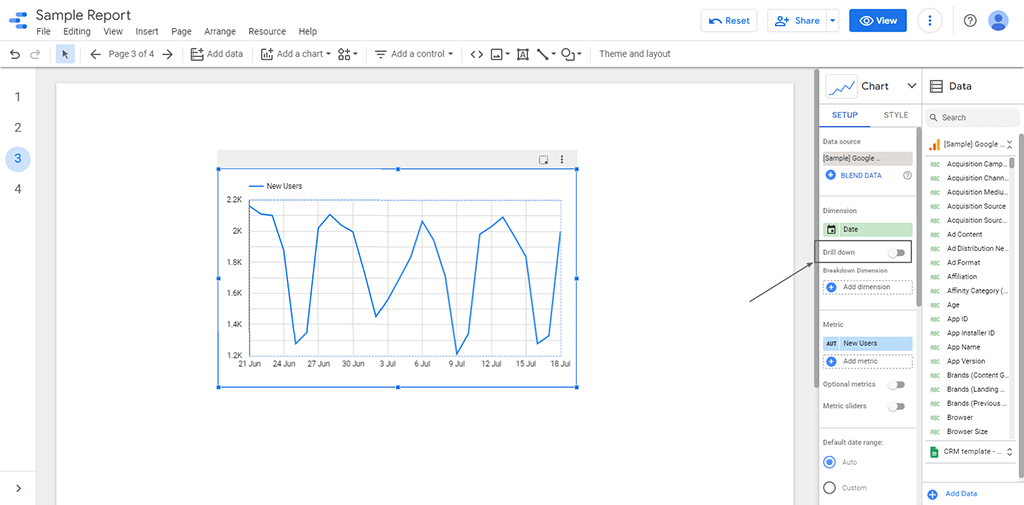
After that, add dimensions to the chart. Each dimension you add becomes another level of detail you can drill into. Here I added Year and Year Month dimensions.
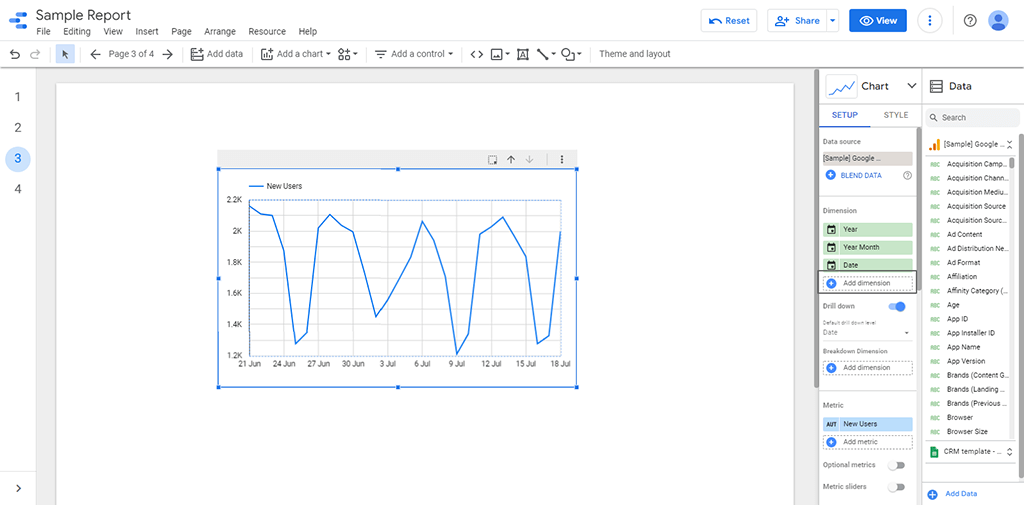
Last, select the Default drill-down level.
Types Of Filters On Looker Studio
Here, I’ll thoroughly take you through the various types of filters and ways how to create filters on Google Looker Studio.
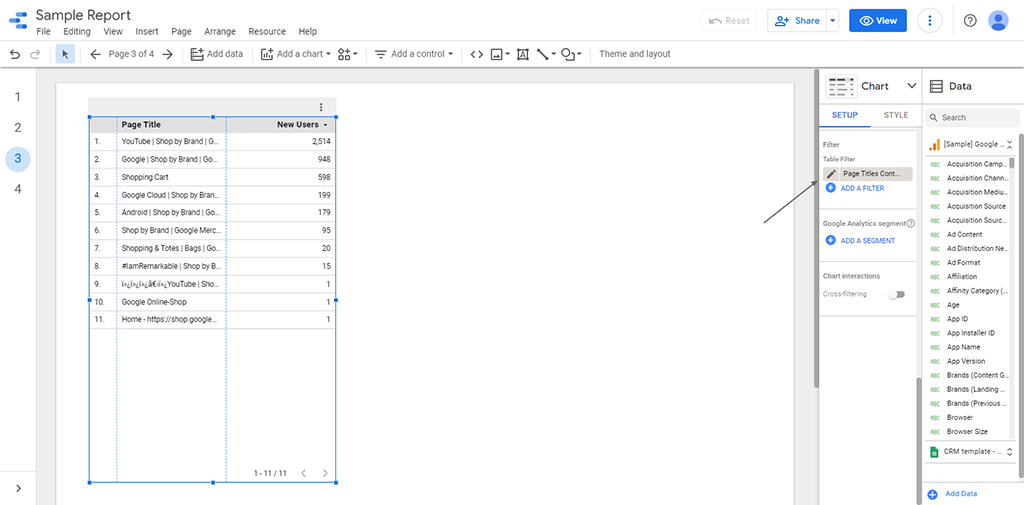
In this section of the post, I’ll be using an already-made table from Google Analytics Sample Data (available on Google Data Studio) with Page Title as the dimension and New Users
If you don’t know how to create a table, you can check out this YouTube video on How to Create Charts and Graphs
Now, let’s check out the various on how to create filters on Google Looker Studio:
Filtering By Metric
So, we’ll be using the same data with the Filtering By Field example.
With this, you can filter data by their metric value using comparison operators (e.g., Equals, Contains, Greater than, etc.).
For instance, you want to filter the pages that brought in more than 2,000 new users.
Also, note that you can either INCLUDE EXCLUDE a particular range of metrics.
Let’s exclude new users less than 2,000 so that we can see how the EXCLUDE filters remove works.
Here are the steps to filter by metric:
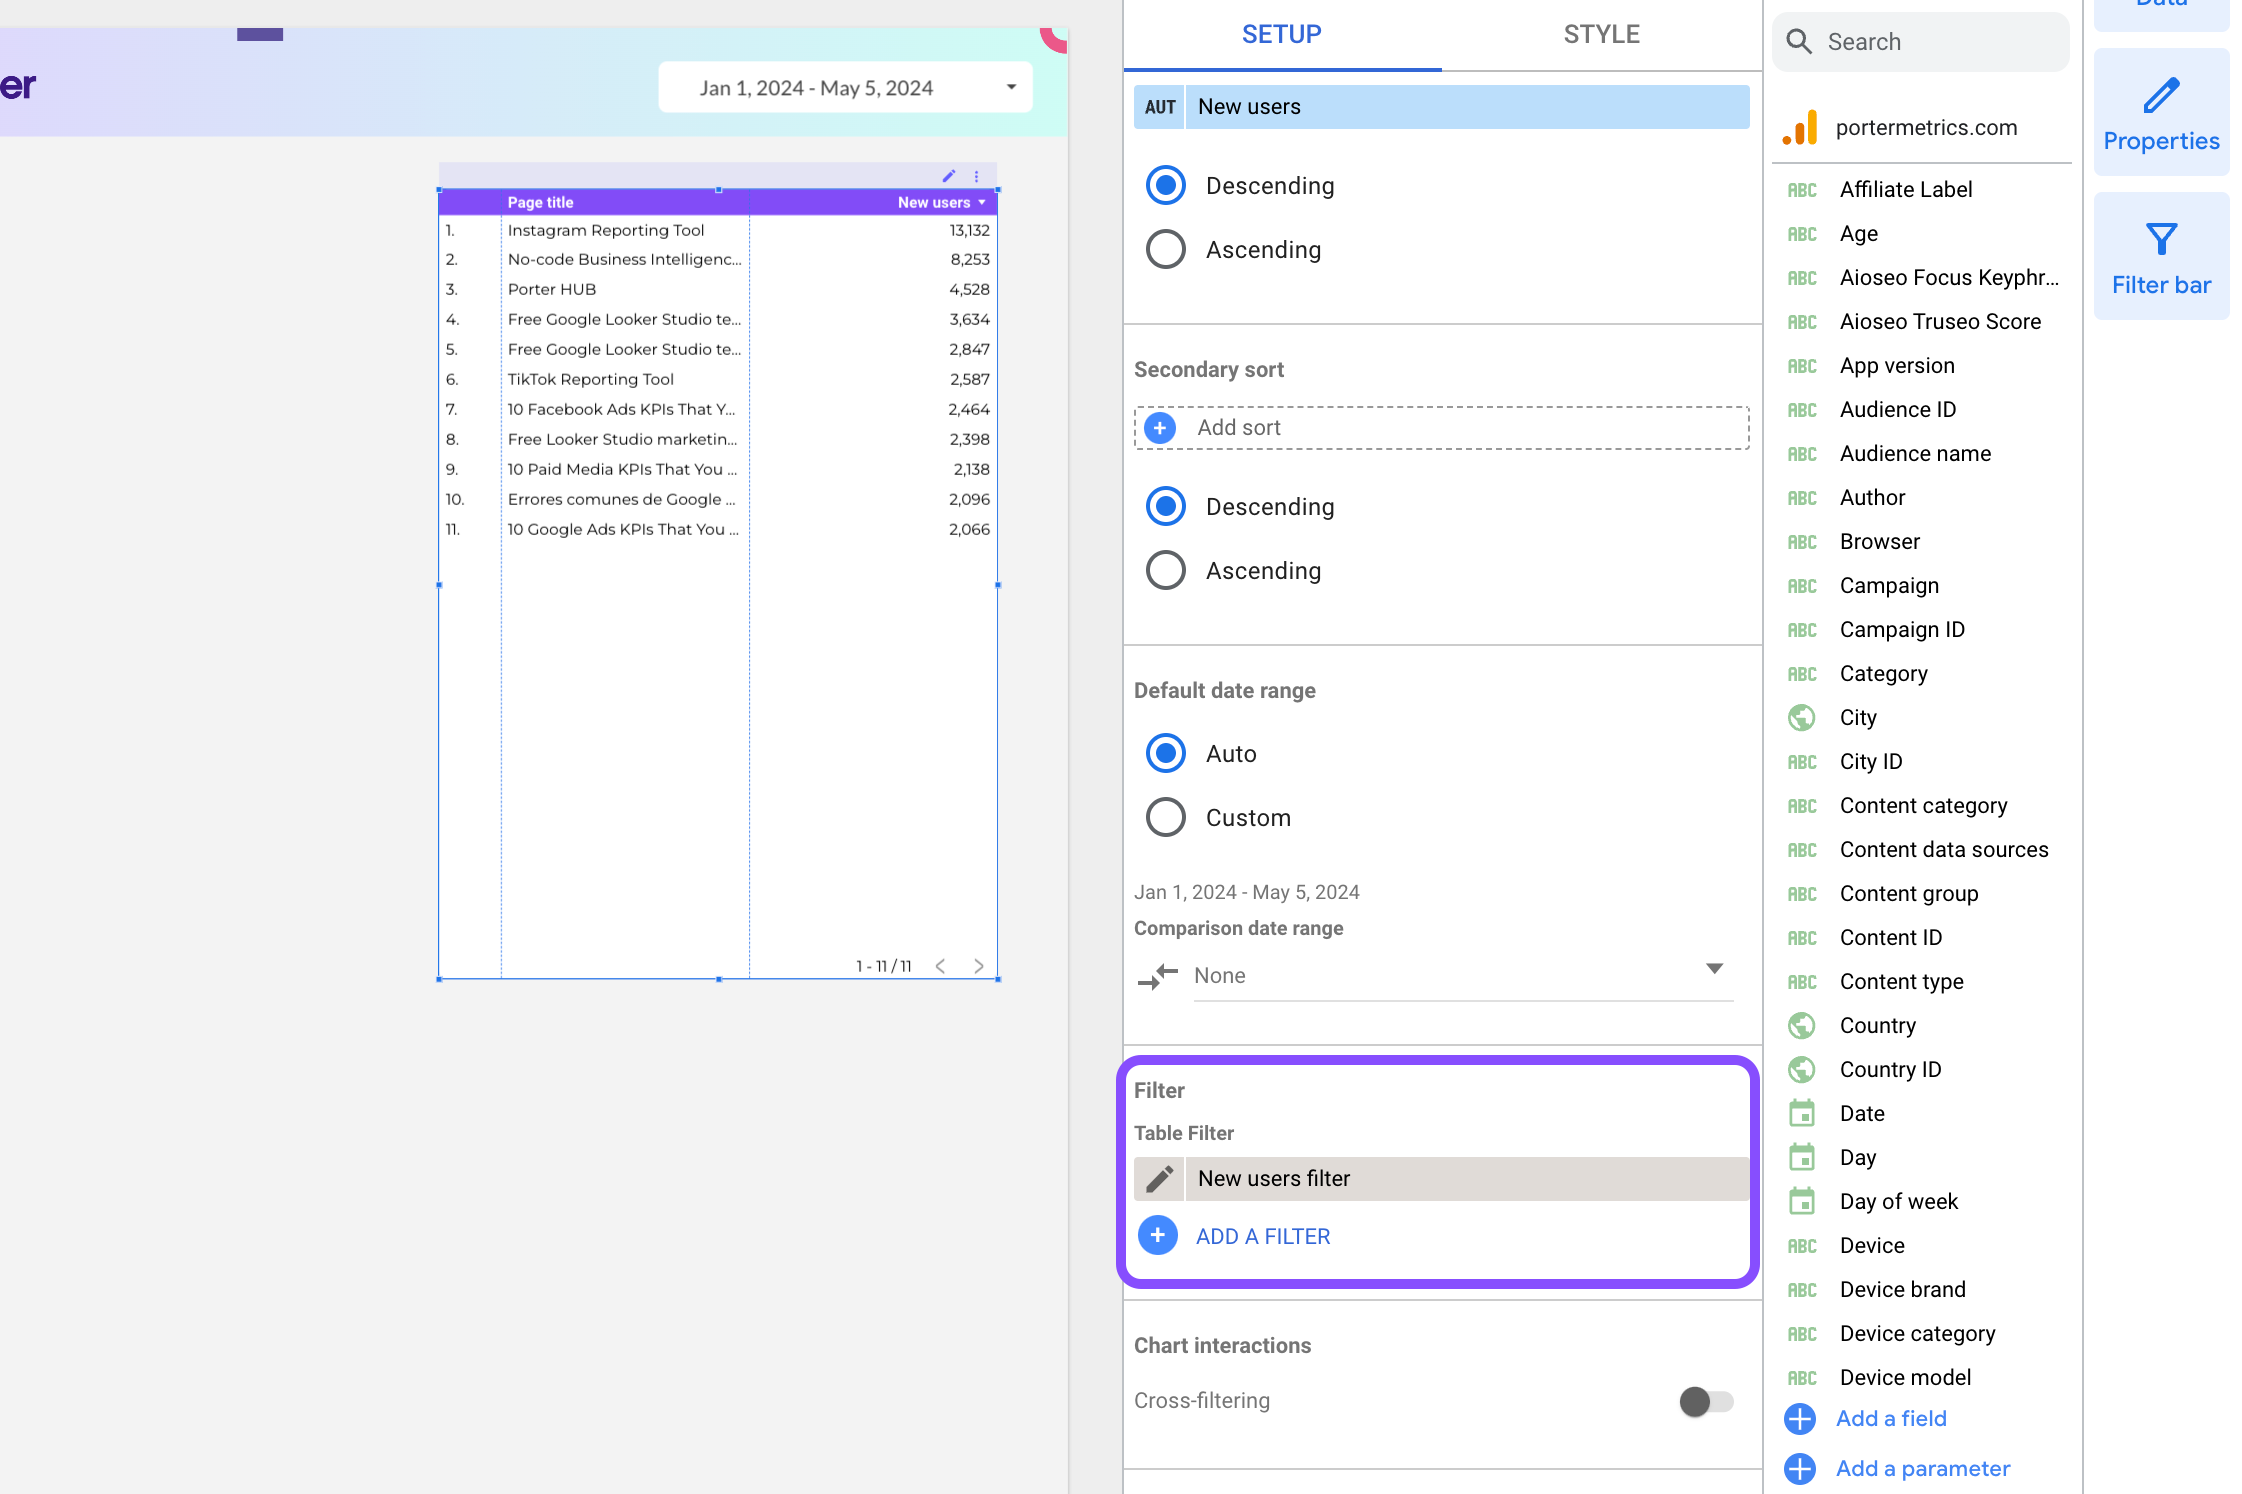
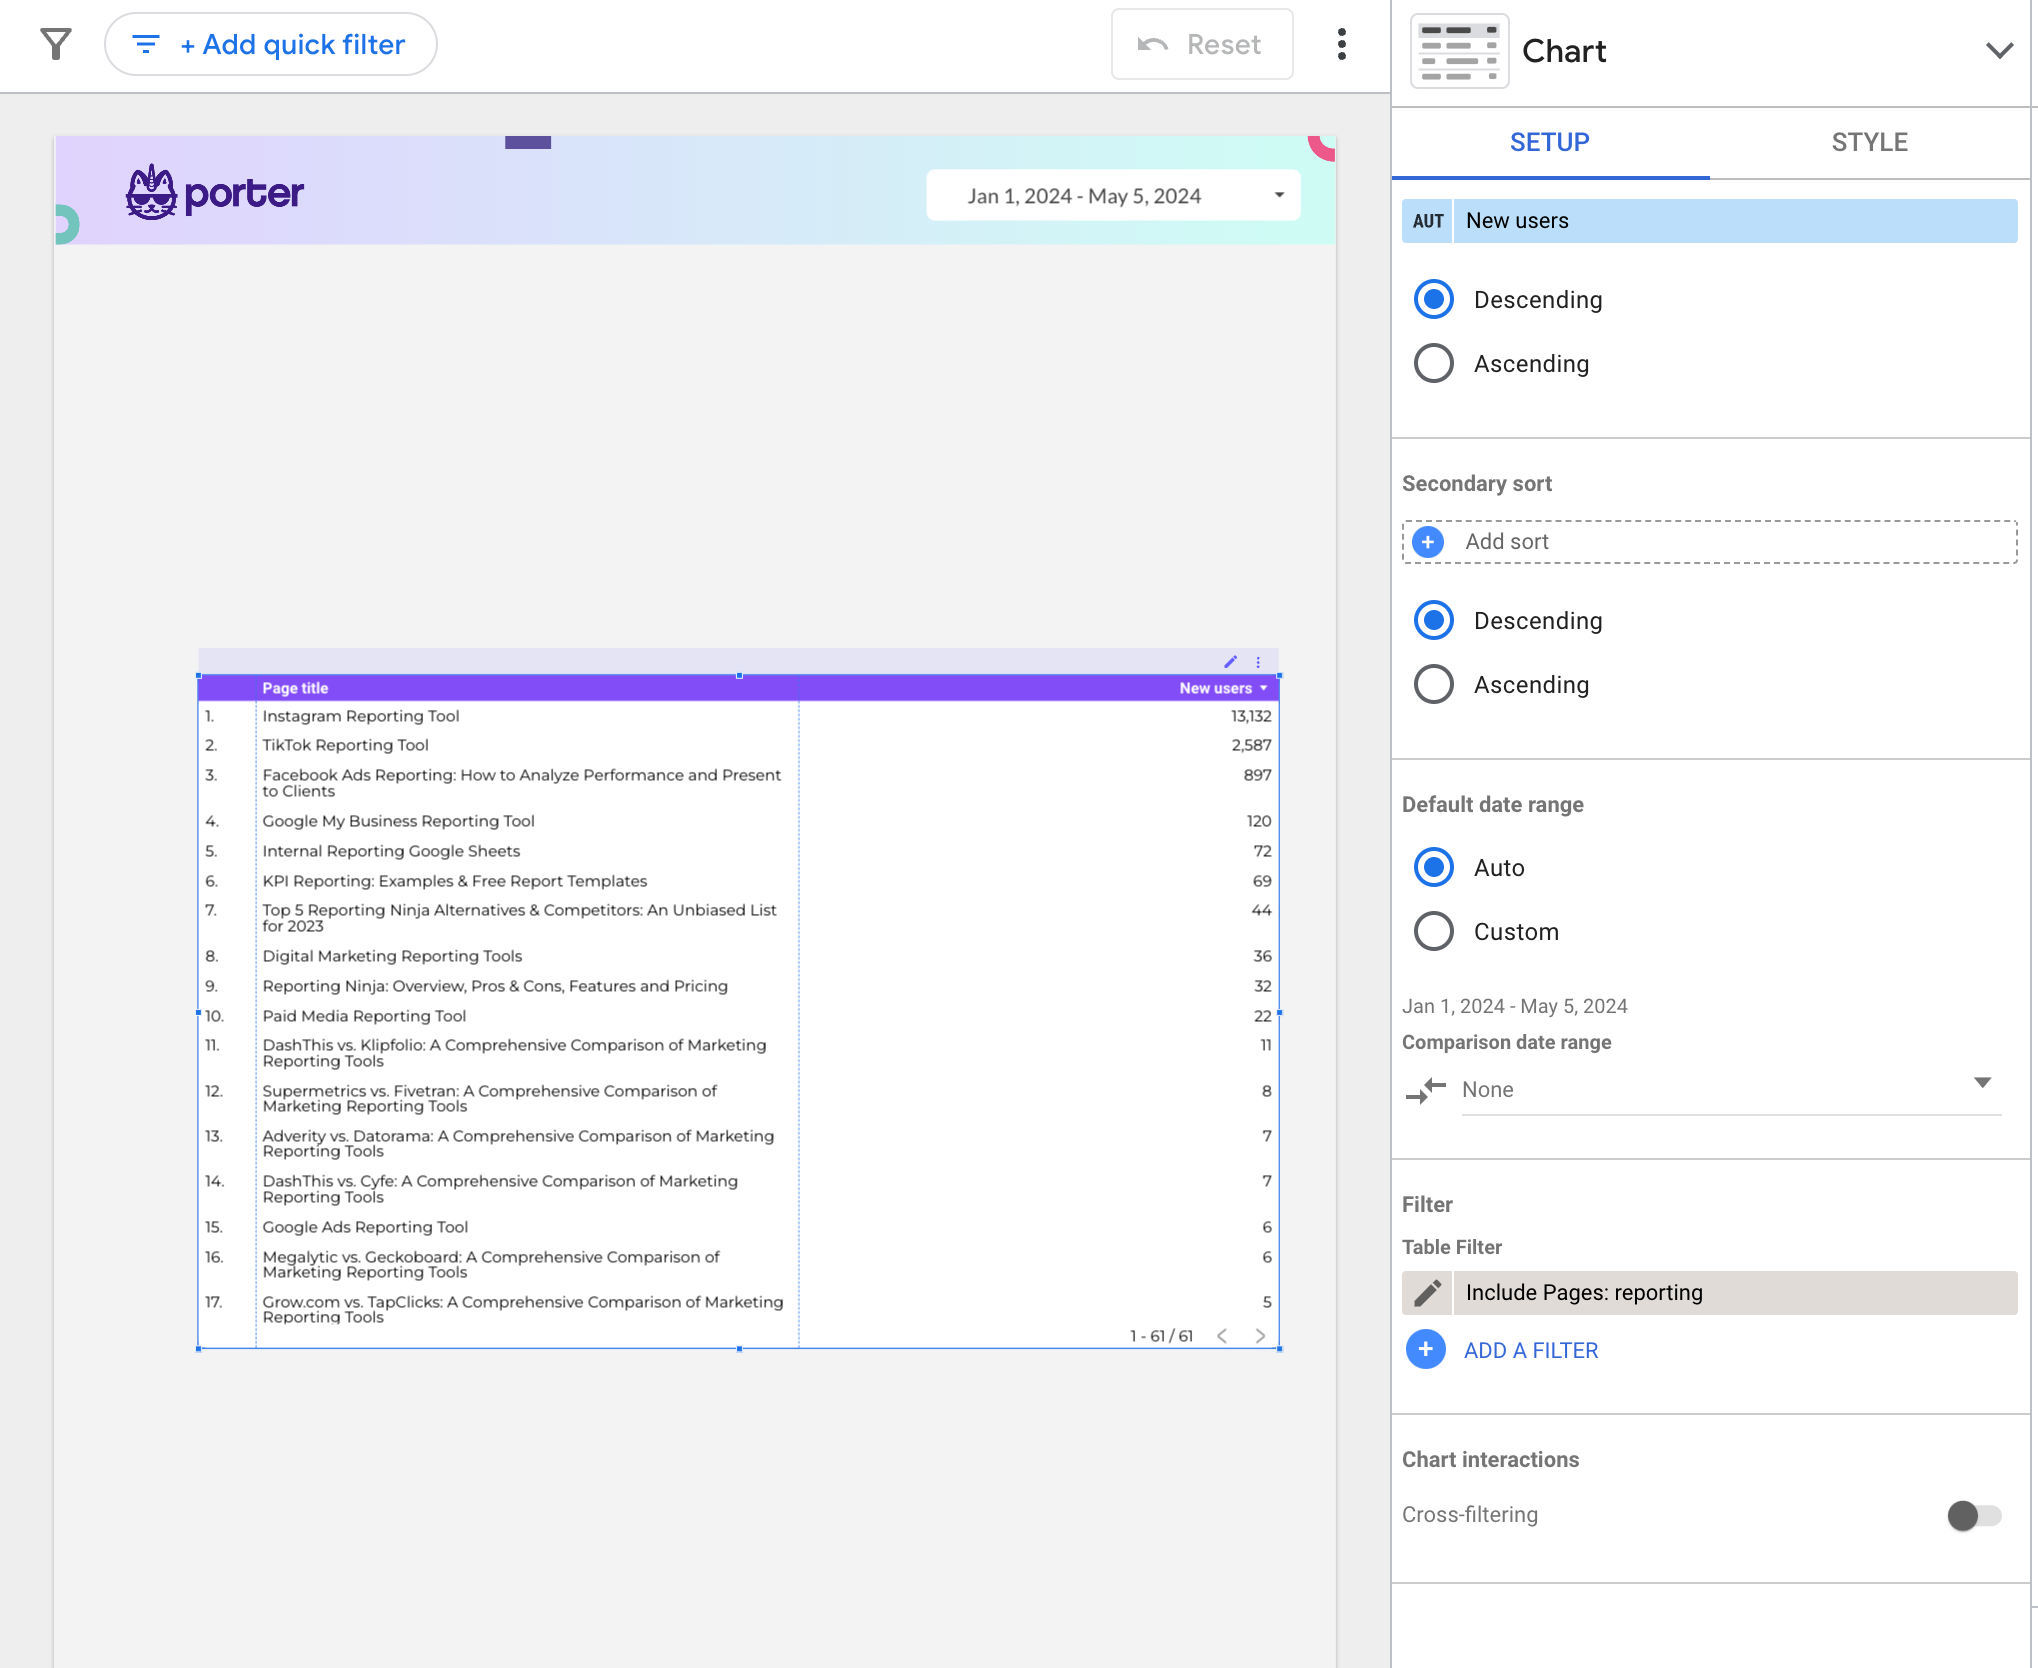
First, click on the table, scroll down in the Charts > Setup bar till you get to the Filter section
Then, click ADD A FILTER
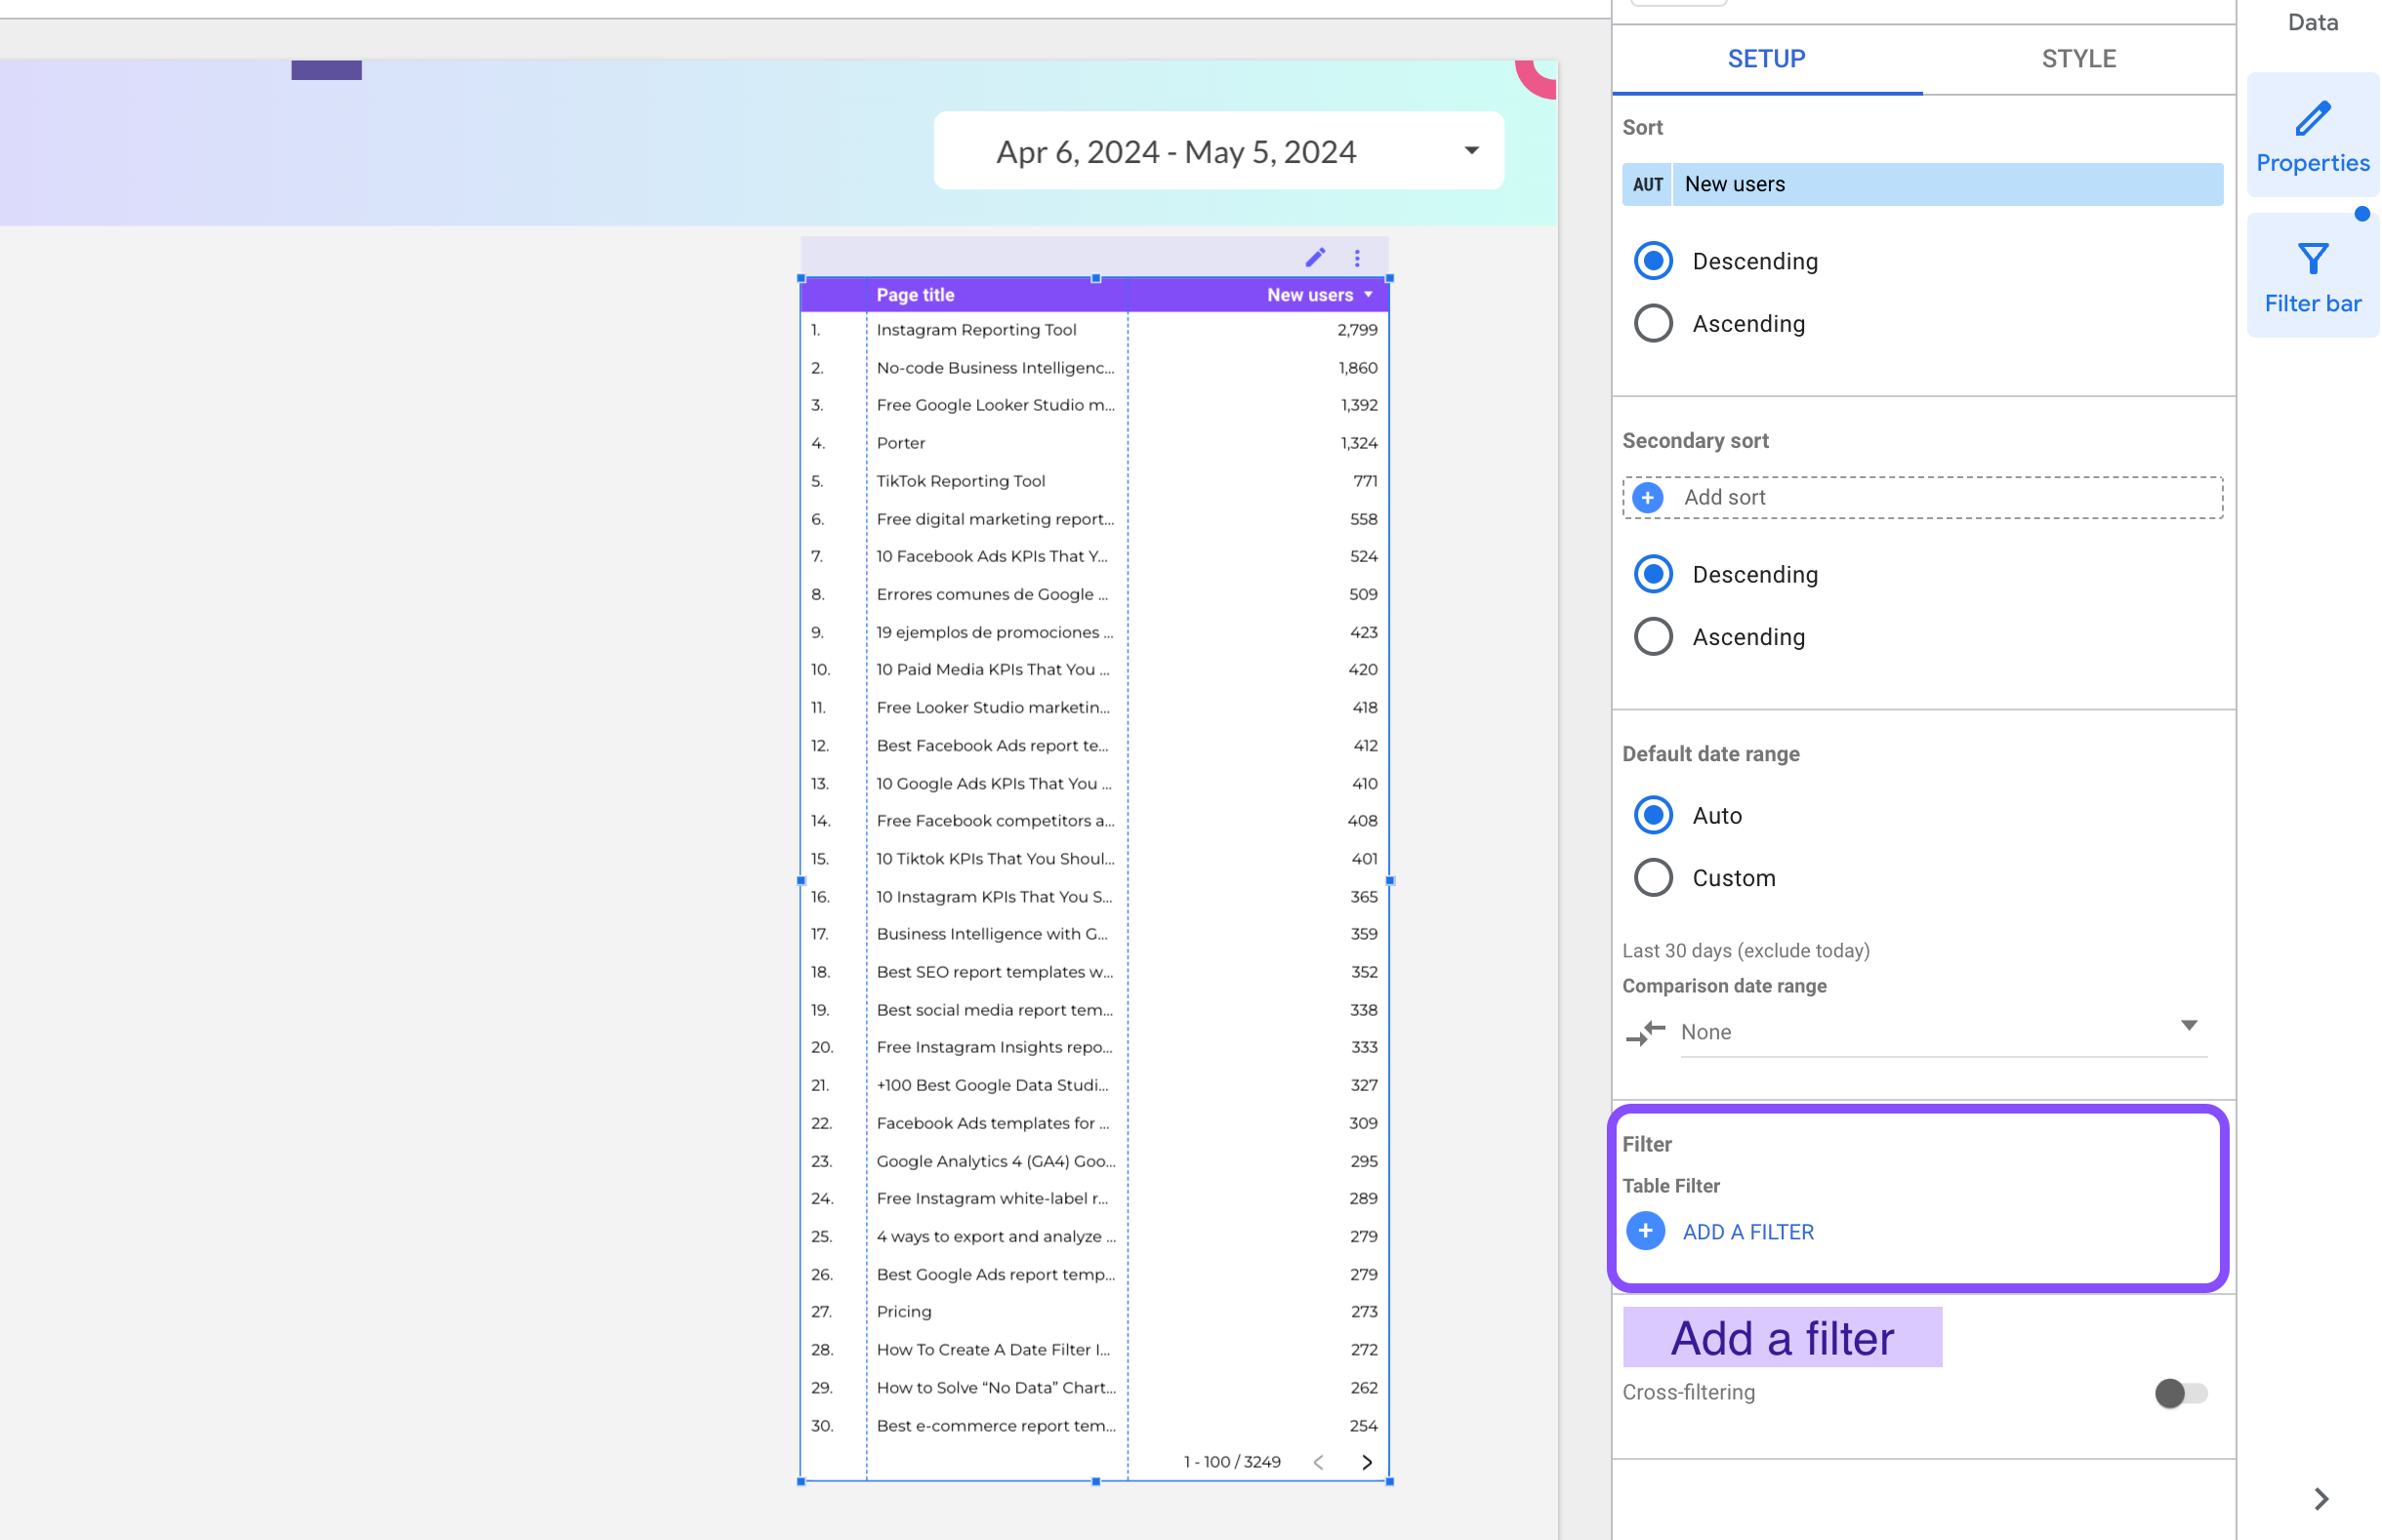
The next step is to click CREATE A FILTER.
You’ll see the filter configuration tab where you can edit all your filter conditions. Now Add a name for your new filter.
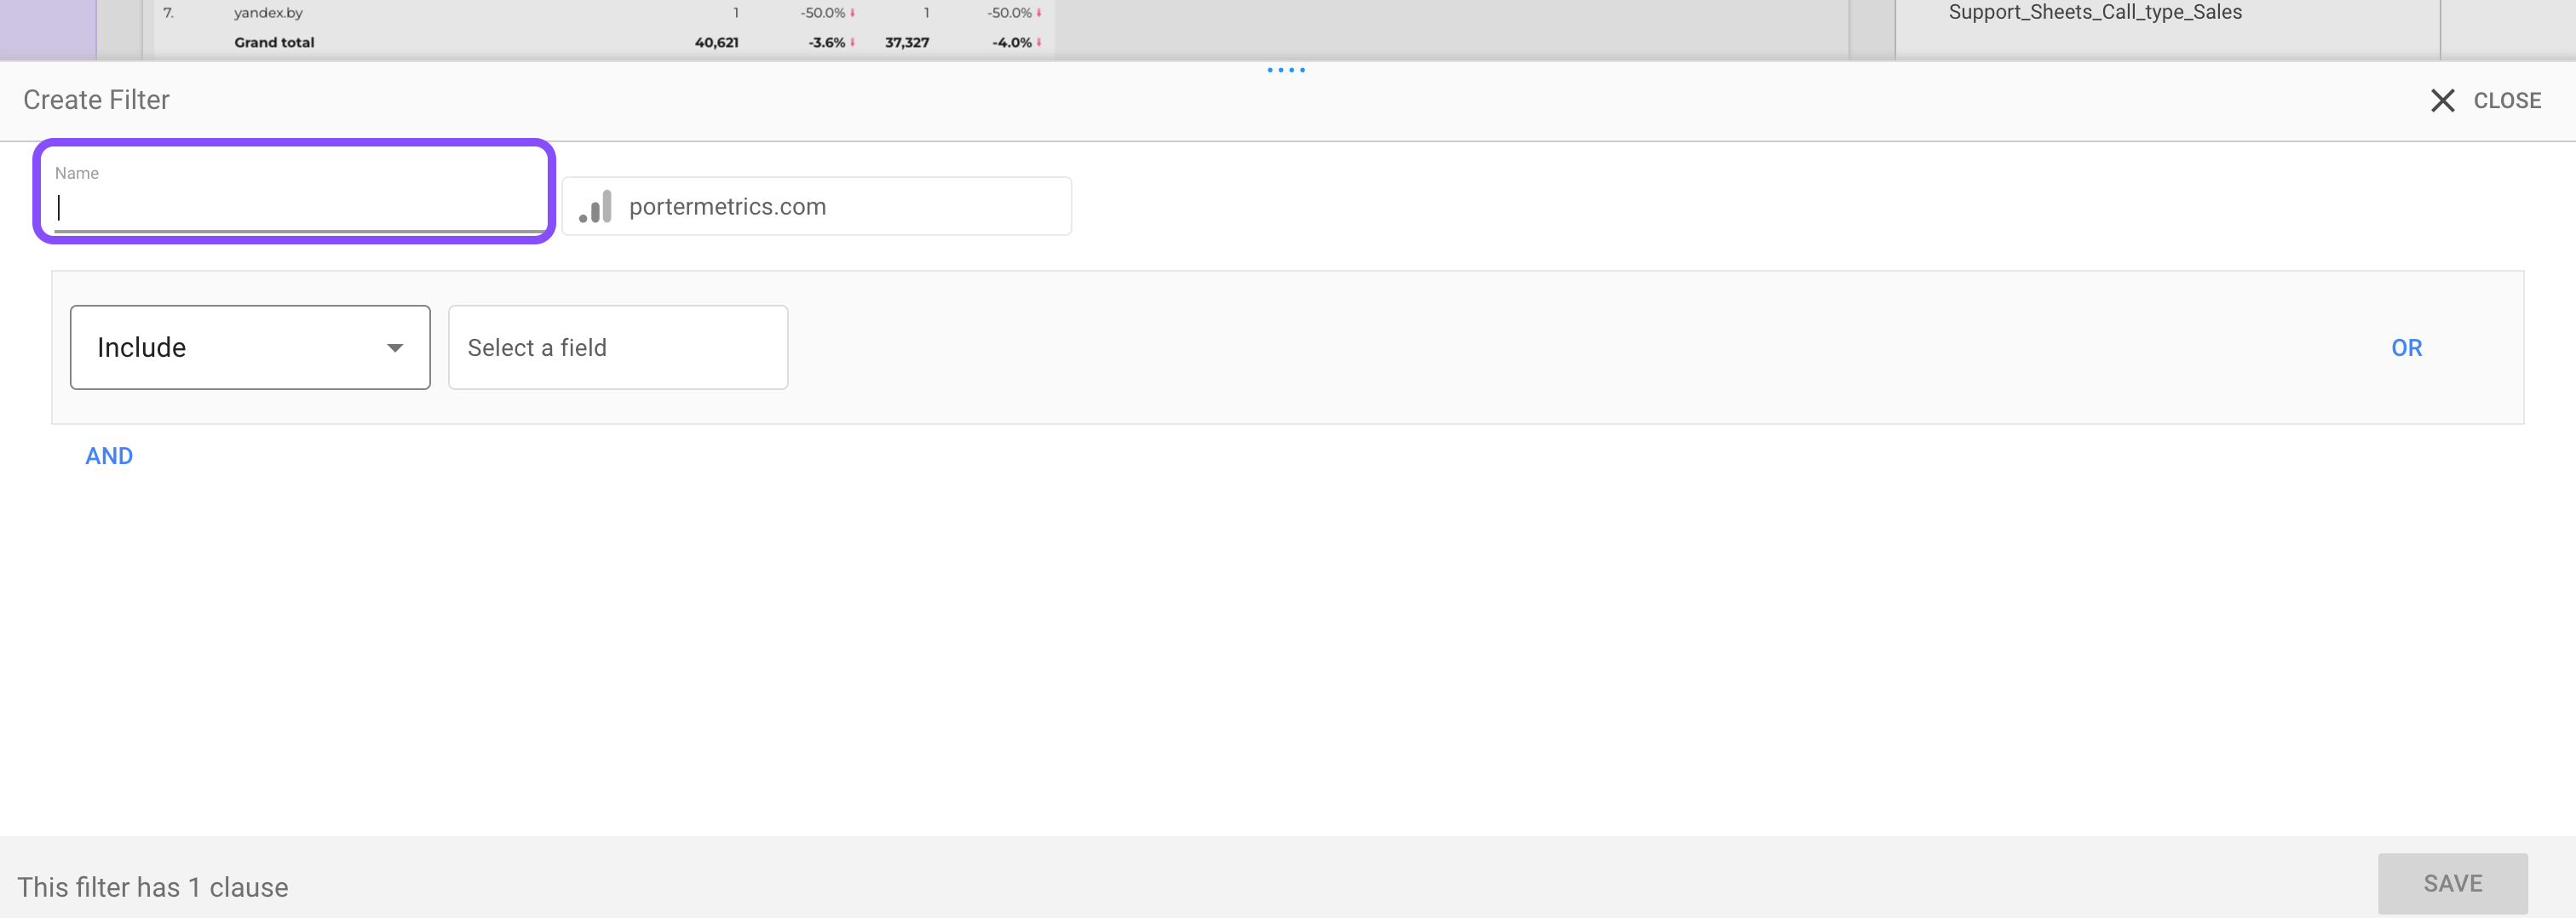
Next, you click Include and select Exclude.
After that, enter and select the metric (New Users) you want to filter.
Then select the Less Than (<) operator in the following field.
Next, input the metric value (2000) into the following field.
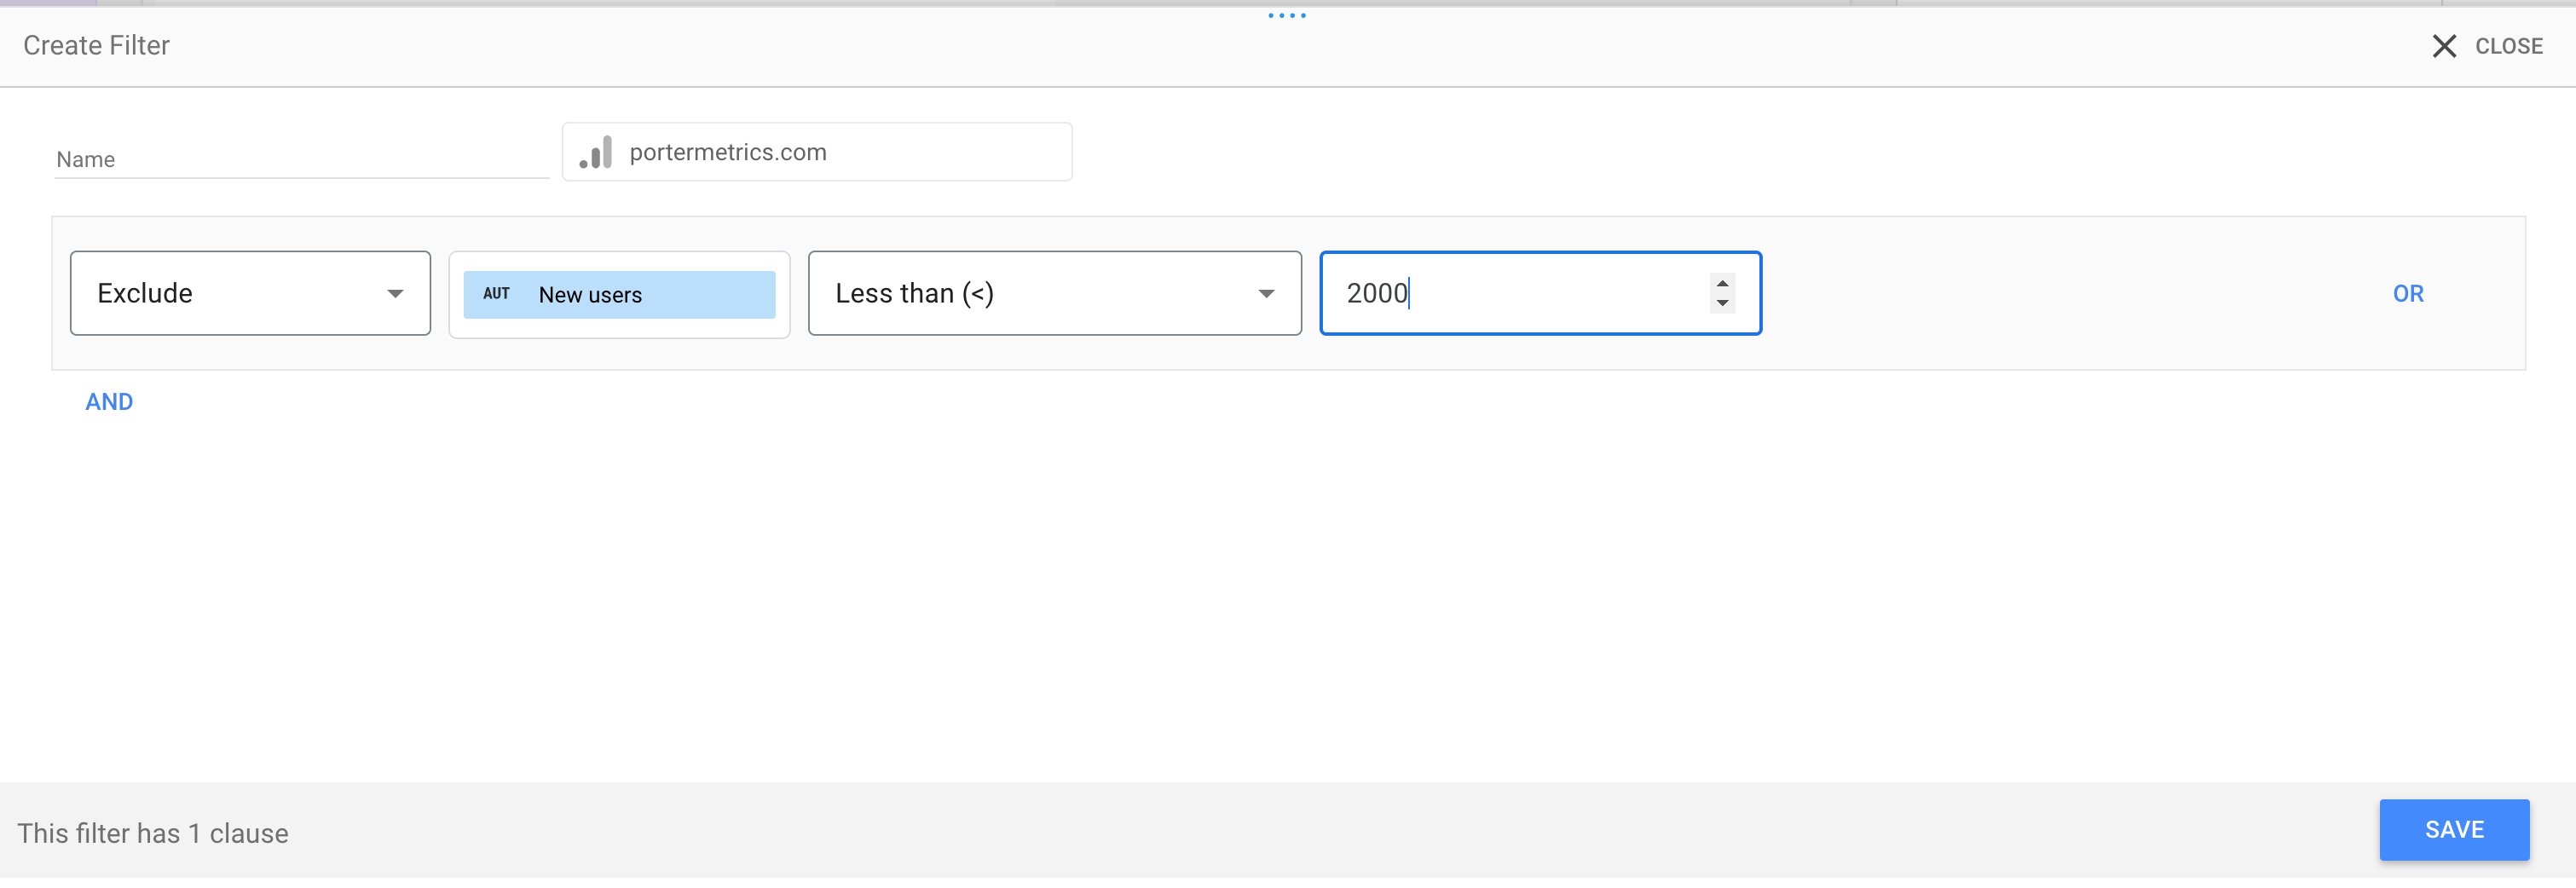
Then, hit save, and the table will be updated to display page titles with more than 2000 new users.
NOTE: This example was only meant to introduce you to the Exclude function. The easiest way to filter the above data is to use an Include along with the greater than comparison operator.
Filtering By Dimension
Here, we will be filtering the data with a dimension already present in the data.
For instance, you might want to see the number of new users pages that have Shop in their title.
So, here are the steps to filter your chart by dimension:
First, click on the table, scroll down in the Charts > Setup bar till you get to the Filter section
Then, click ADD A FILTER
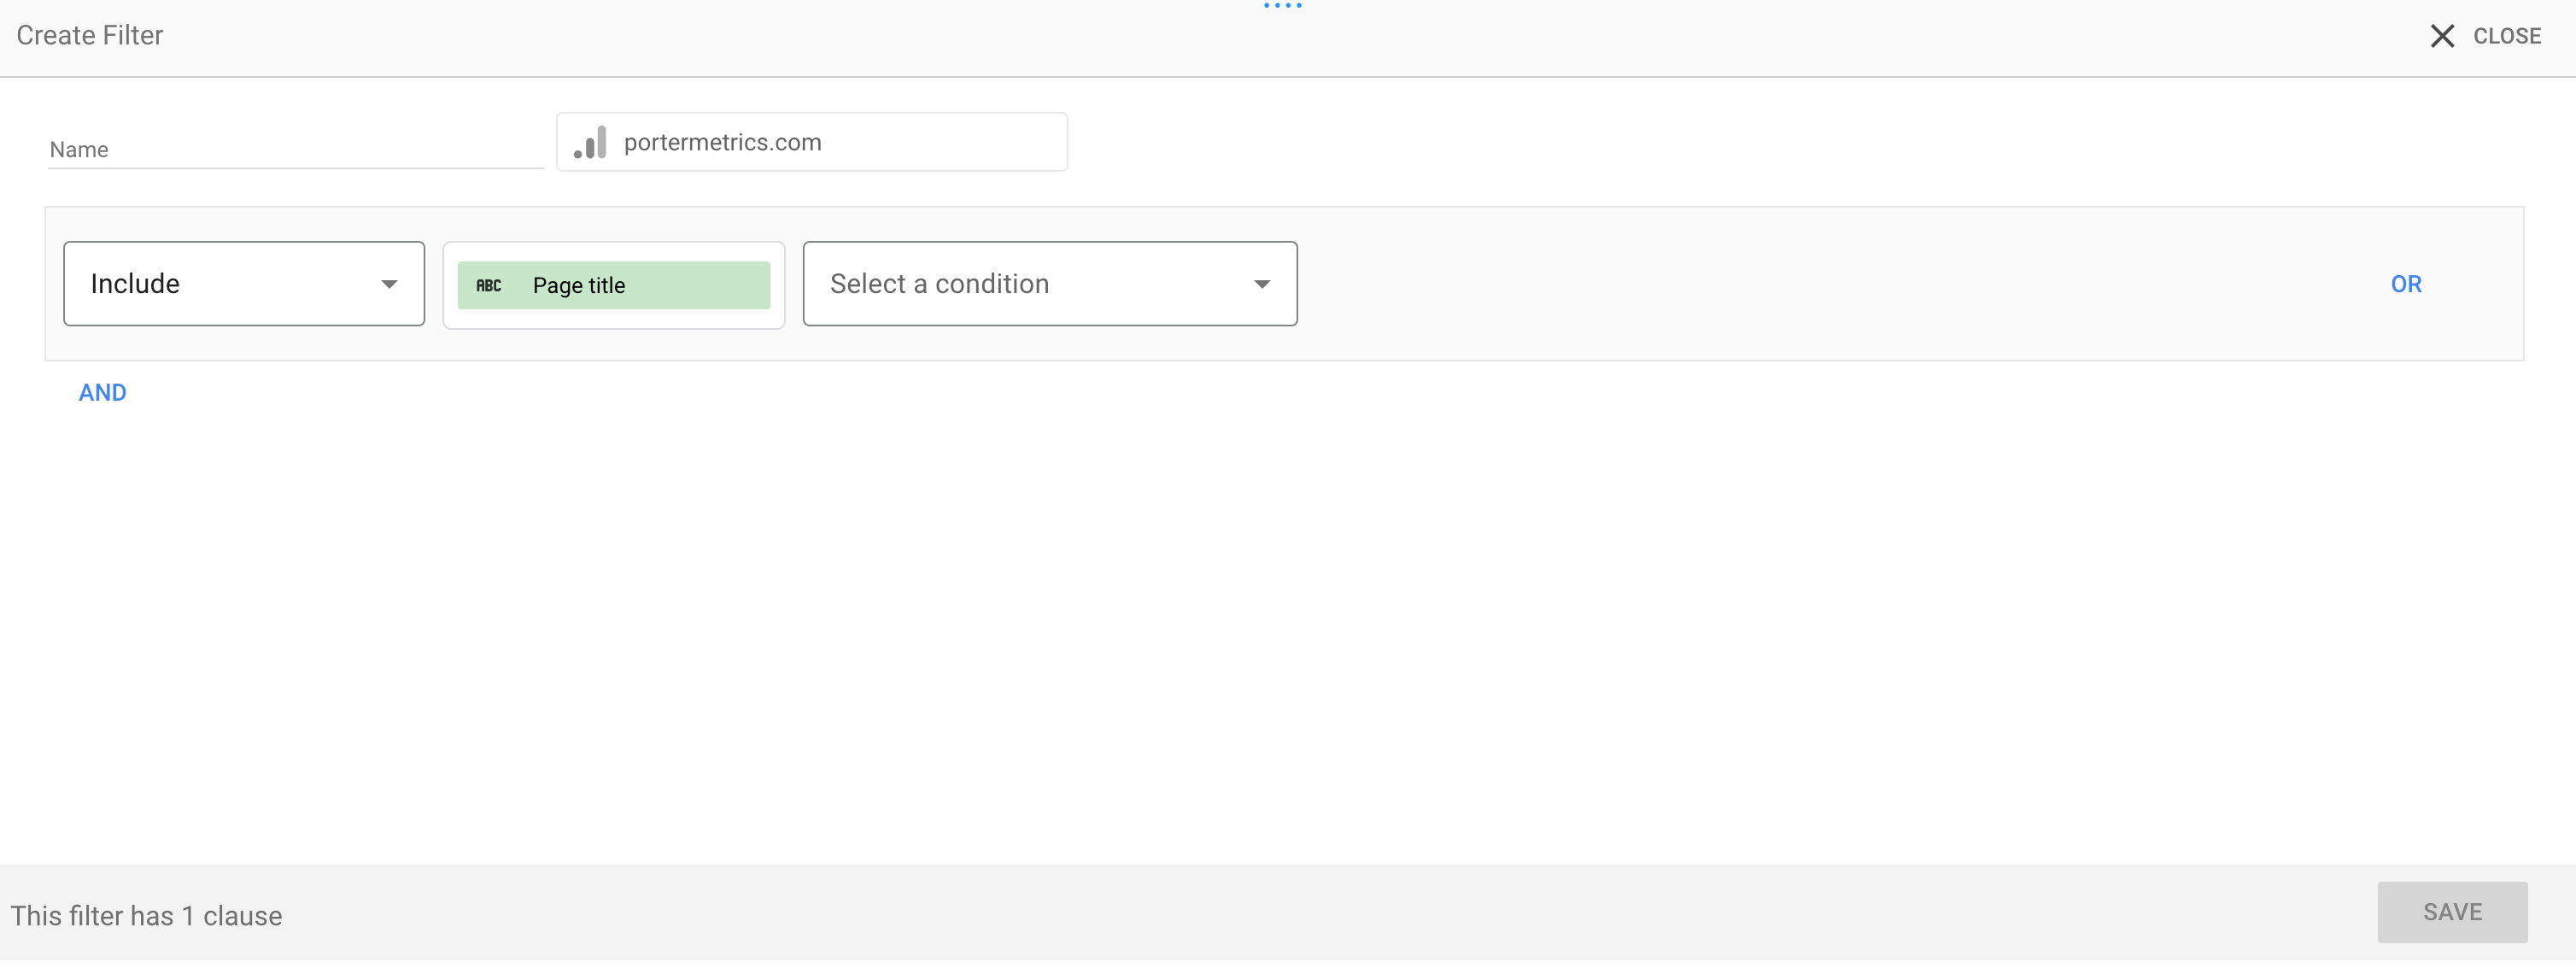
The next step is to click CREATE A FILTER.
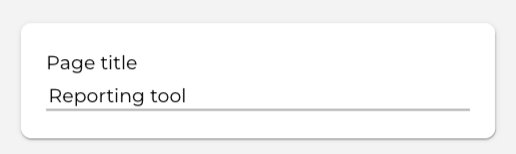
Since we’ll be using the Include function, the next step will be to input and enter the Dimension in the Select a Field field.
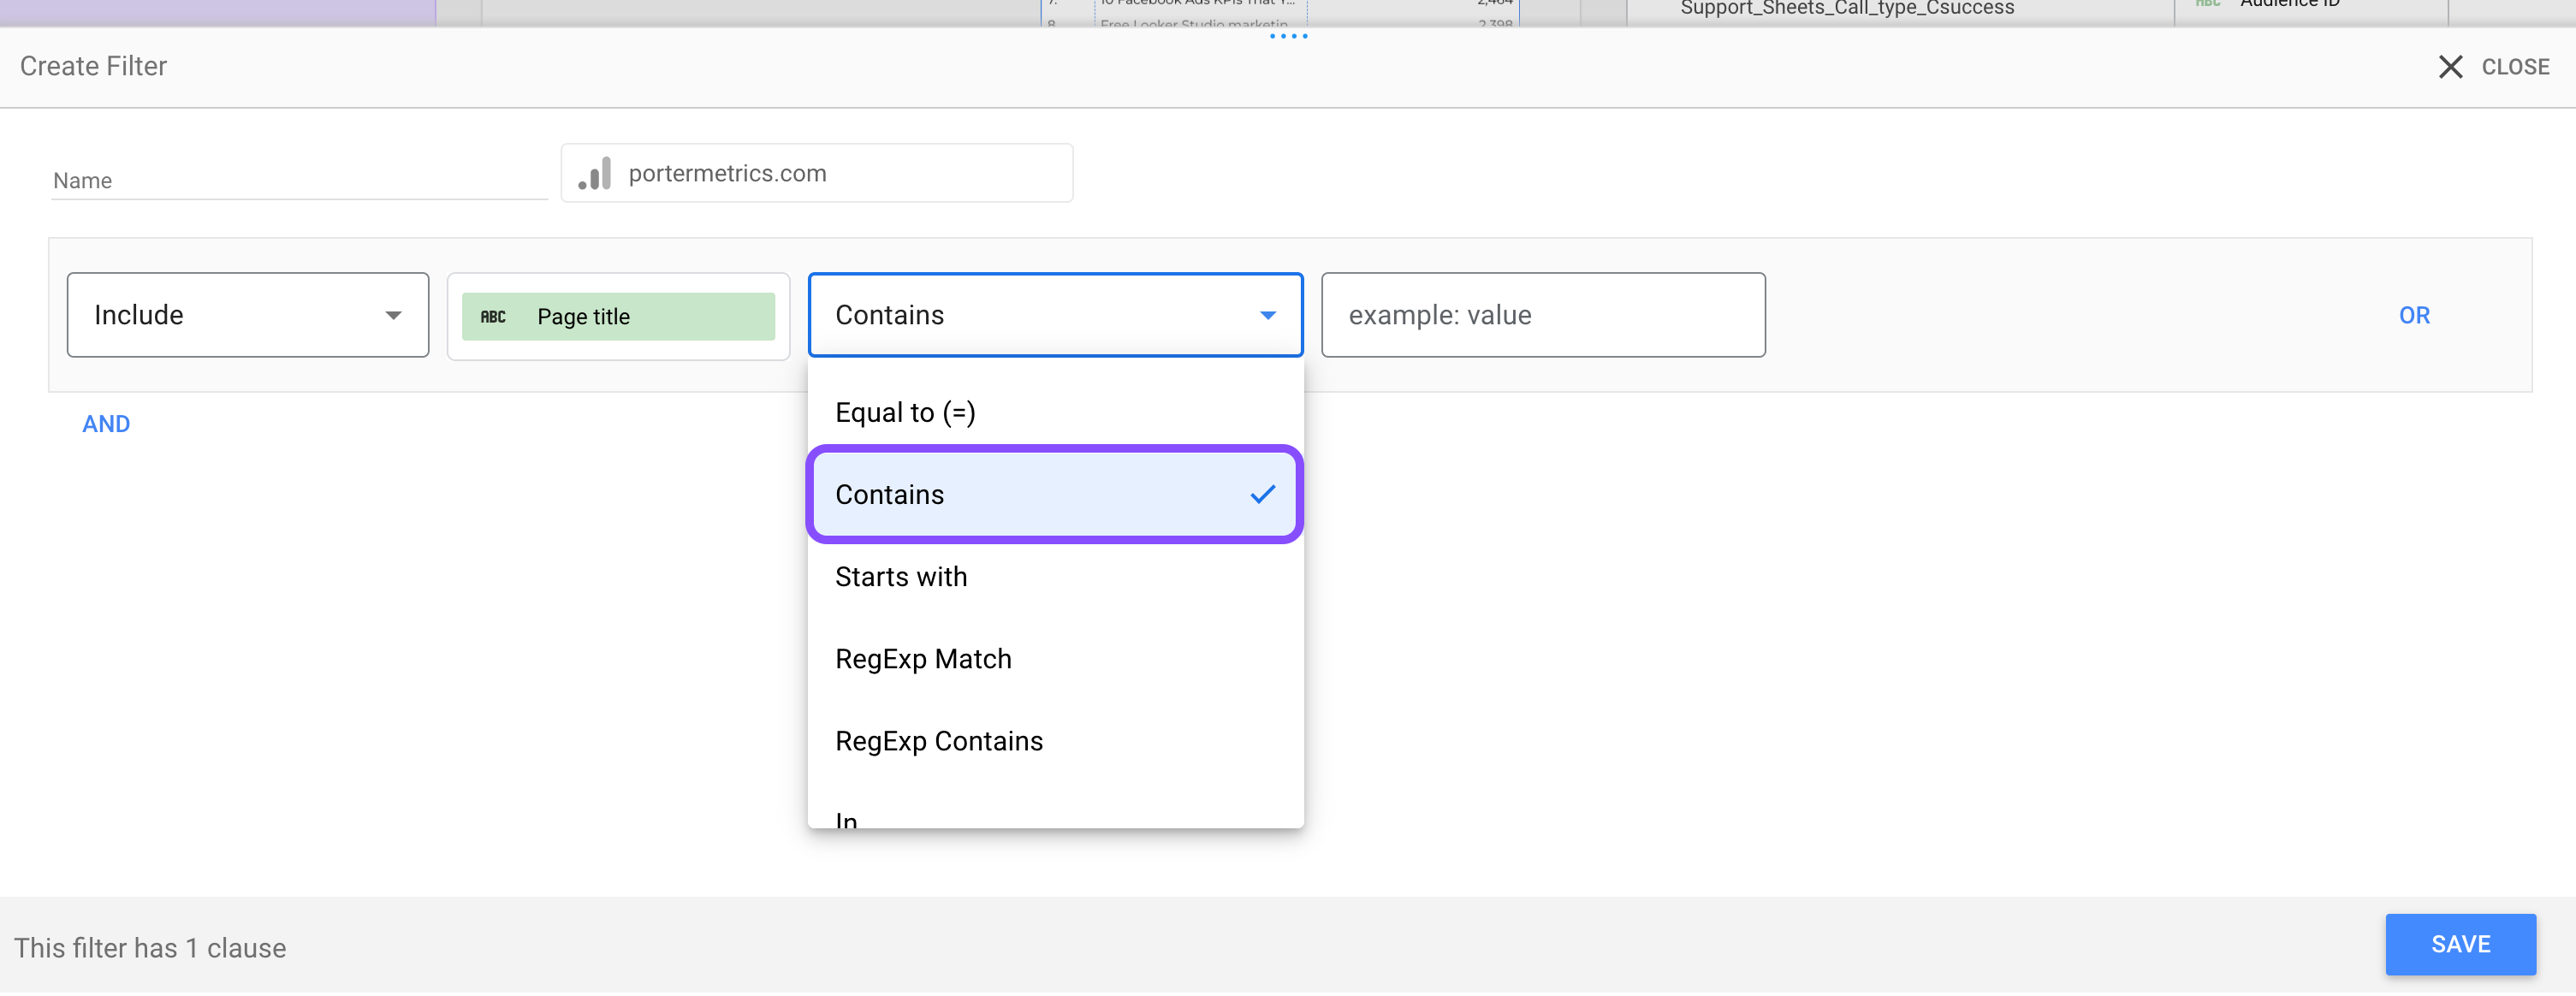
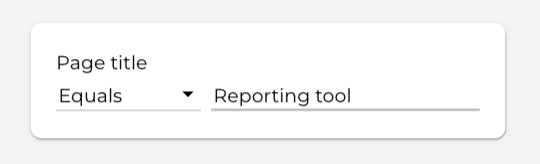
Now, you’ll need to select a condition (Contains)
After that, enter the Dimension Value (Reporting) in the Value field.
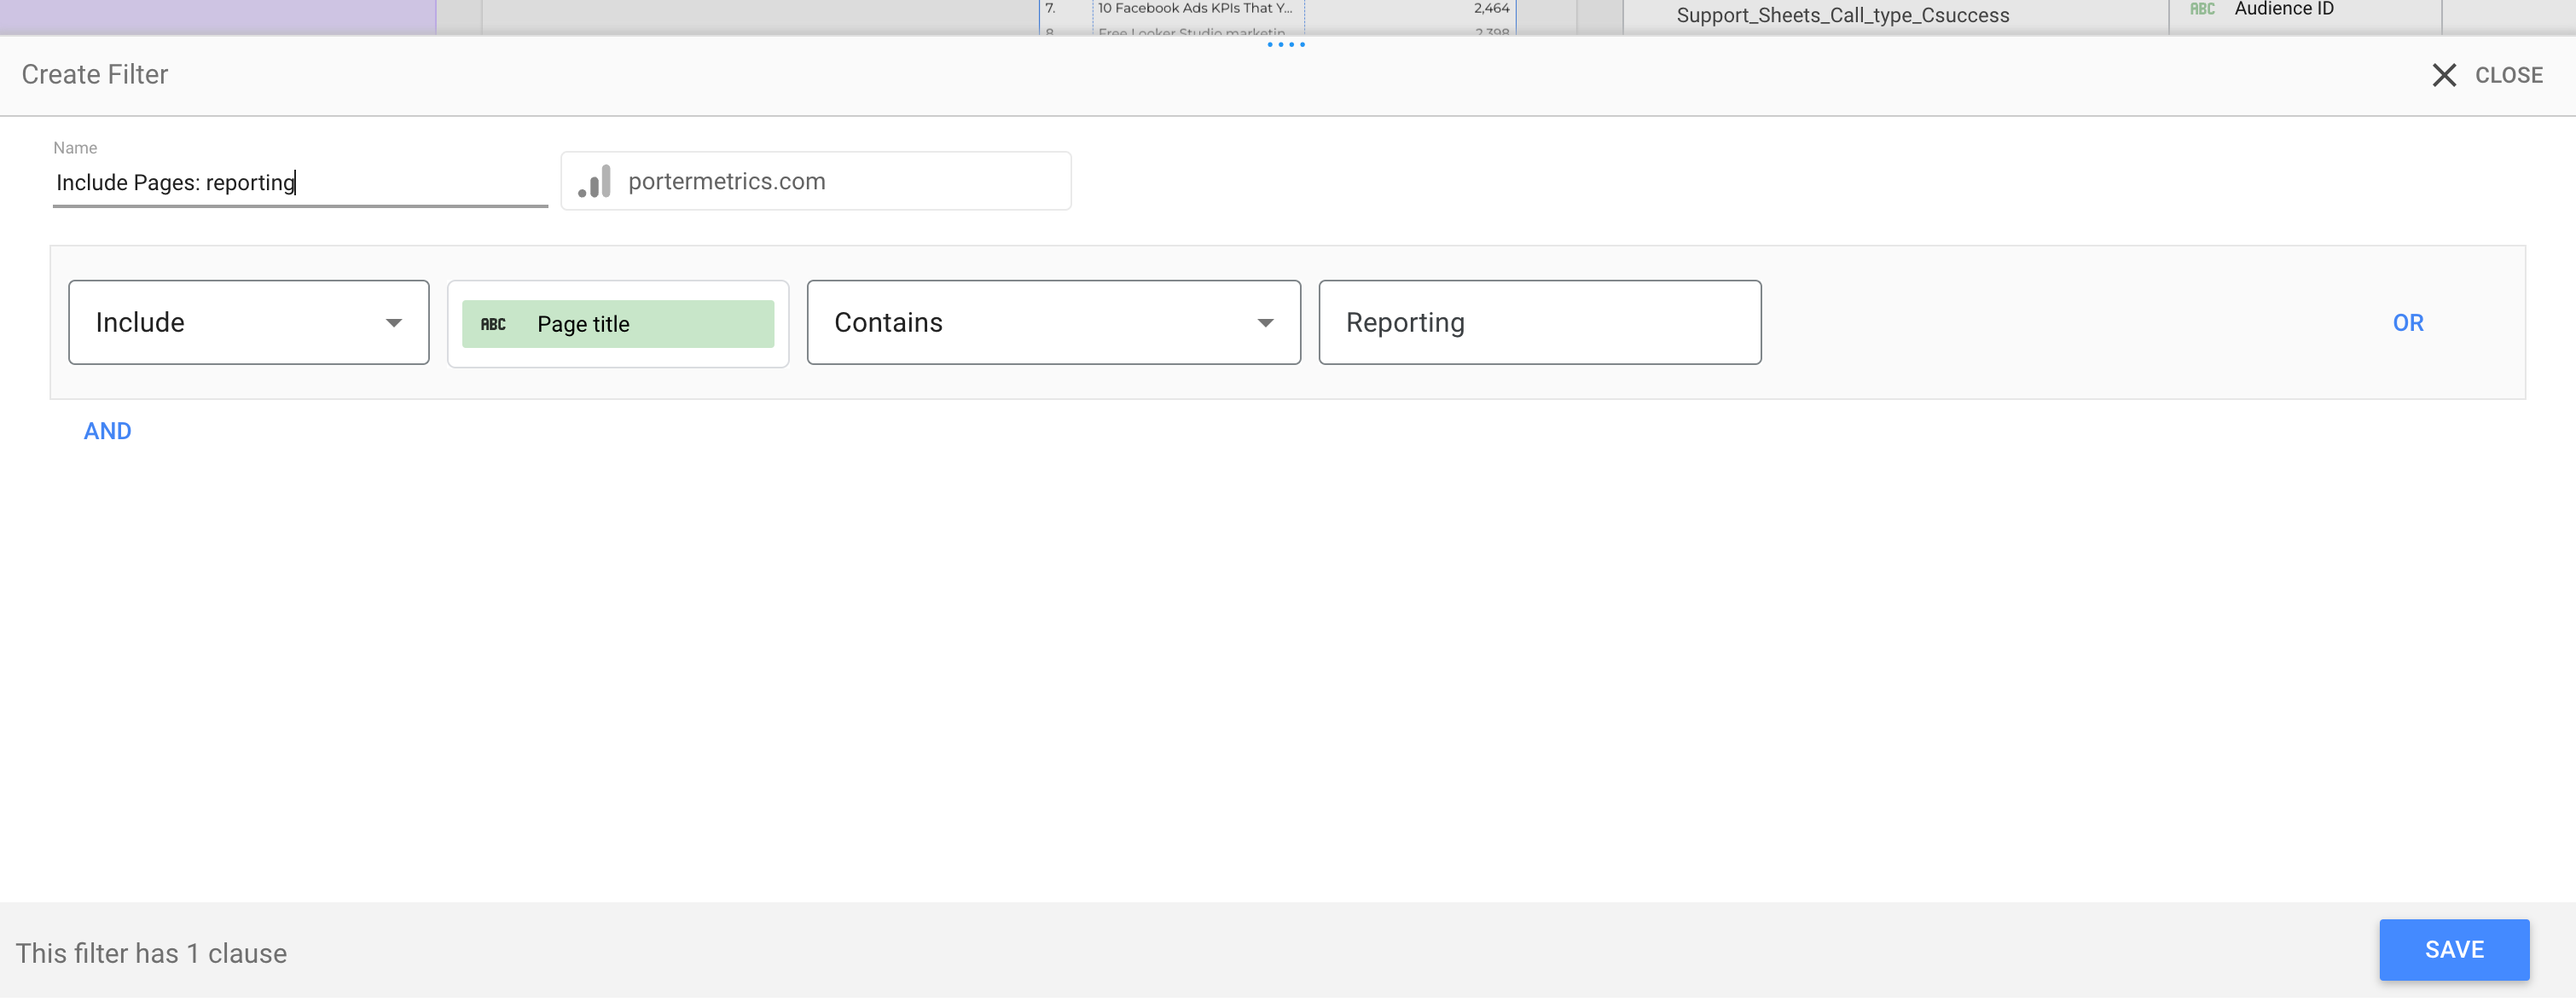
Now, you can save, and the filter will be applied to the table.
Filters Vs. Control
Filters and controls are sometimes thought to be the same since they both clean the data.
But the main difference between the filters and controls is that a filter is a permanent cleaning operator that you can only change by changing the filter itself.
At the same time, you can think of controls as interactive filters that can be altered easily by the end-user/viewer by changing their values.
Types Of Controls
Here, I’ll walk you through the different types of controls available on Google Looker Studio. The’ drop-down menu’ is particularly useful for selecting options or settings, such as changing date ranges or selecting models and fields for creating filters.
Drop-Down List
This control shows a list of options you can select. The list in the Drop-Down List can be a list of acceptable values defined for a particular parameter or from the values in a particular dimension.
Fixed-Size List
The Fixed-Size List is almost the same as the Drop-Down List control.
The main difference is that the Drop-down List displays the control in a drop-down box while the Fixed-size List displays the filter control in a fixed-size box.
Input Box
You can use this control to find a specific dimension from the dimensions available.
Input boxes allow you to input a value. When used as a filter, you can configure how the control checks the user’s input against the dimension values.
When used as input to a parameter, this control can take any value, values from a particular list, or a range of values.
Advanced Filter
Advanced filters are similar to the input boxes, but you can only use them as filters. Advanced filters can’t set parameter values like input boxes.
Slider
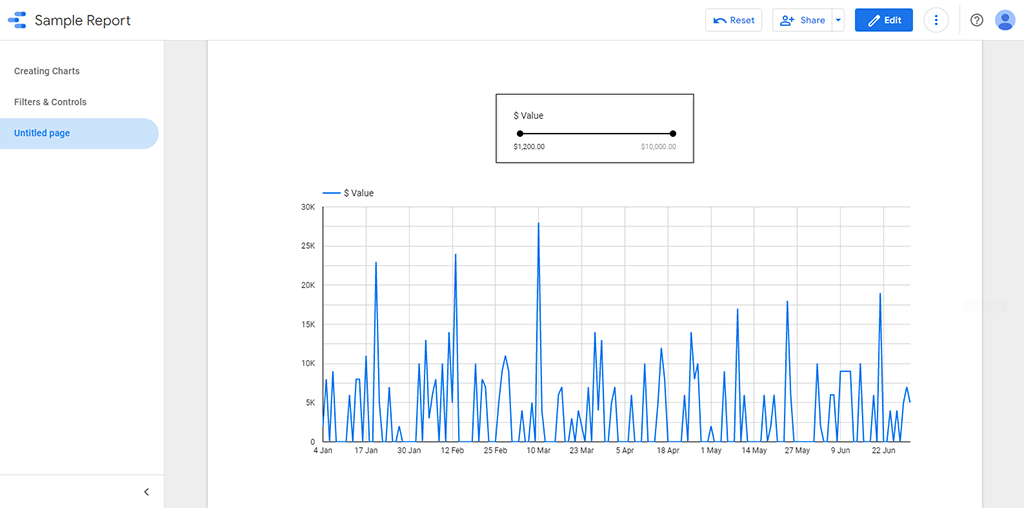
Sliders let you filter by a range of values in a numeric dimension or select a single value from a numeric parameter.
In the image above, the $ value metric varies from $1,000 to $10,000; you can edit this range to any range you’re currently interested in with the slider control.
Checkbox
Checkboxes help you filter by a Boolean dimension or set the value of a Boolean parameter.
Date Range

The date range control is a customizable calendar widget that allows you to adjust the timeframe of a report without needing to edit the configuration.
This control offers you a way to let your viewers select the dates they want to see.
Data Control
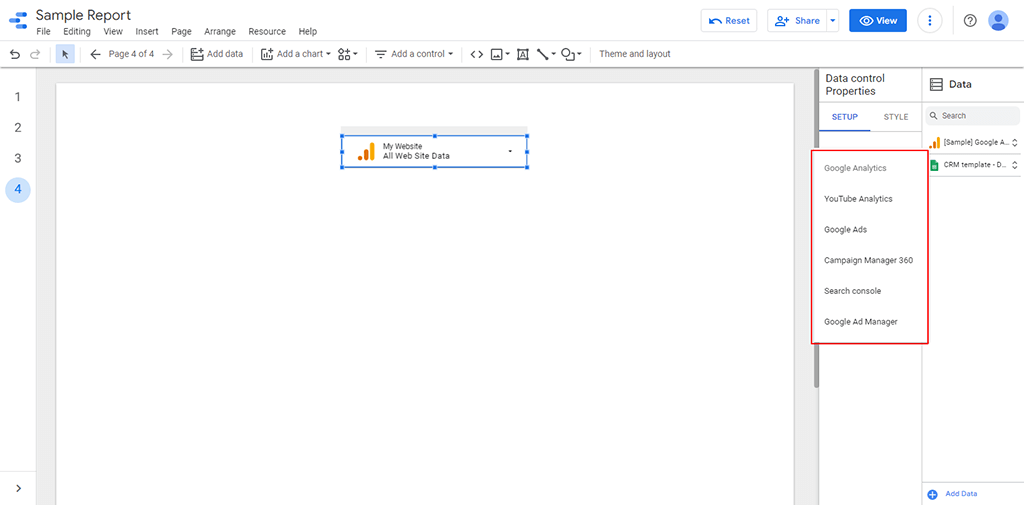
With data control, report users can control the kind of data they will display.
The data sources for data control include Google Analytics, YouTube Analytics, Google Ads, Campaign Manager 360, Search Console, and Google Ad Manager.
You can also decide to connect two or more of these data sources, and with data control, you’ll still be able to select a particular data source for the report.
How Do I Filter a Google Looker Studio Report?
Here’s how to create filters on Google Data Studio Reports on individual pages:
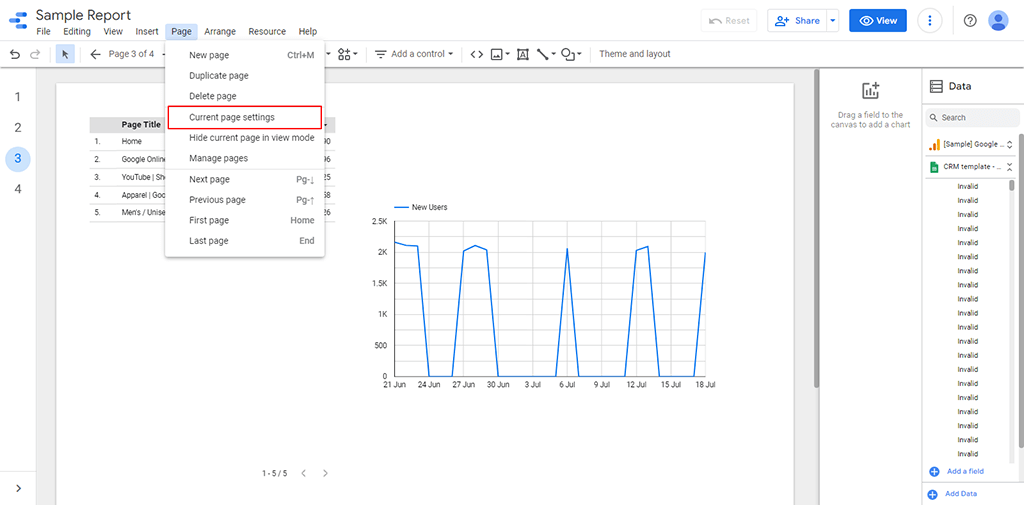
To add a filter to a particular page, select Page > Current page settings in the menus.
Then, click +ADD A FILTER in the properties panel on the right.
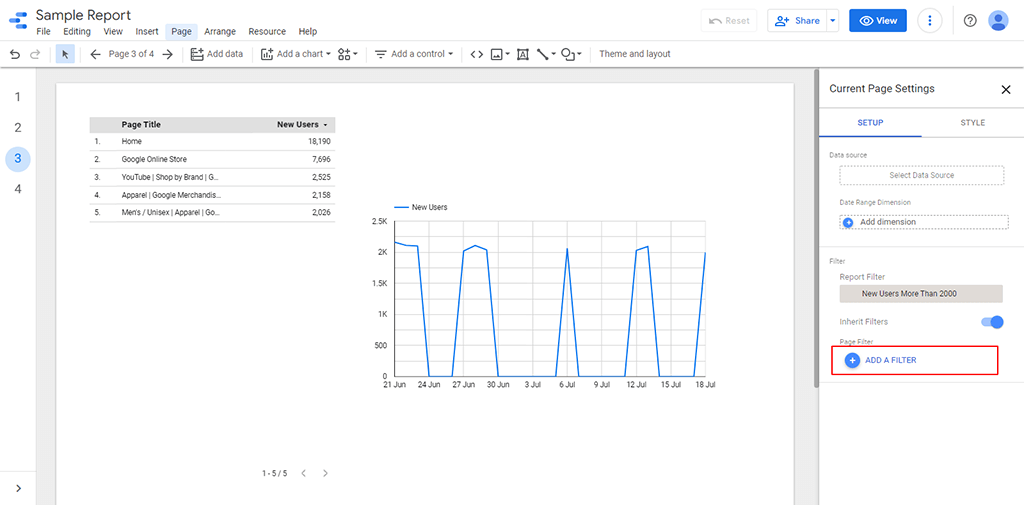
After that, set up the filter using the previous instructions.
If you don’t have a filter already set up, follow steps 6-13 in the How Do I Filter A Data Studio Chart heading to set up a new filter.
Metric Slider
A Metric Slider helps you filter a chart by metric value, allowing you to display only data that meets certain conditions.
For instance, you can adjust the metric slider to filter the chart to show only Orders with a total value between $100 and $250, effectively ensuring that the chart displays only data from orders within this range.
Here’s how to enable the metric slider on your chart to filter and show only data from a specific range or condition:
First, edit your report.
Then, pick a chart. You can add sliders to tables, line charts, time series, bar charts, area charts, pie charts, treemaps, scatter charts, and geo maps.
After that, select the SETUP tab in the properties panel on the right.
Under the Metric field, turn on Metric sliders.
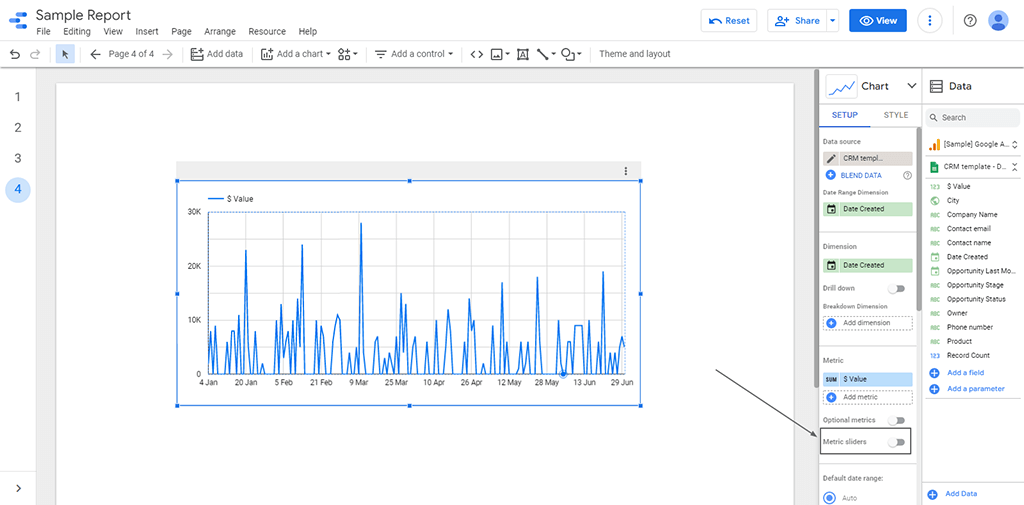
NOTE: You can add one or more metrics to the chart, tailoring the display to include only data that meets your specified criteria.
Cross-filtering
Chart Filters (now Cross-Filtering) help you apply filters to narrow down displayed information based on specific criteria, focusing on the metric and dimension in an already existing chart.
When you turn on cross-filtering for a chart, you can filter your report by interacting with that chart in two ways:
Clicking at least one dimension value in the chart.
“Brushing,” or dragging your mouse across a line chart, time series, or area chart.
Here’s how to turn cross-filtering on or off.
First, edit your report.
Next, pick a chart.
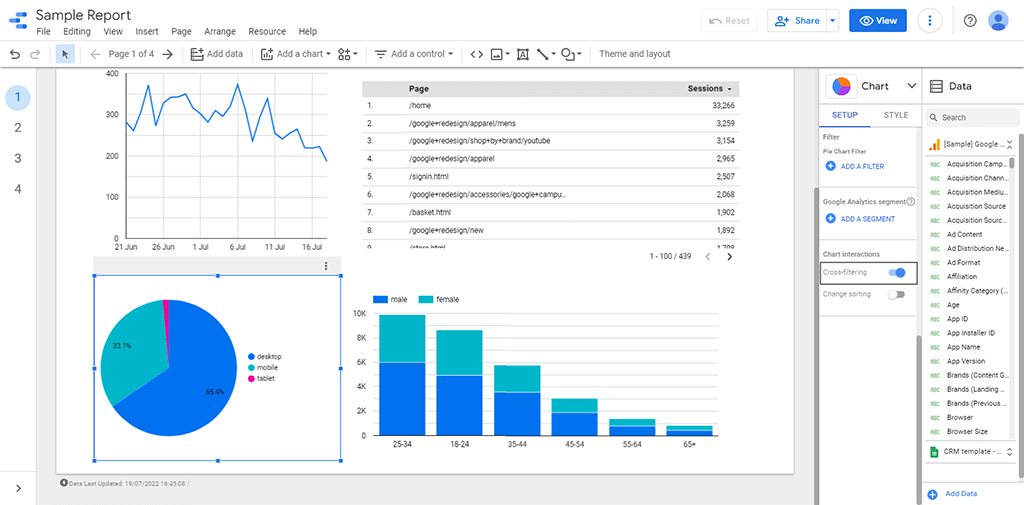
After that, select the SETUP tab in the properties panel on the right.
Then, click Cross-filtering in the Chart interactions section.
Repeat these steps for each chart you want to use as multiple filters.
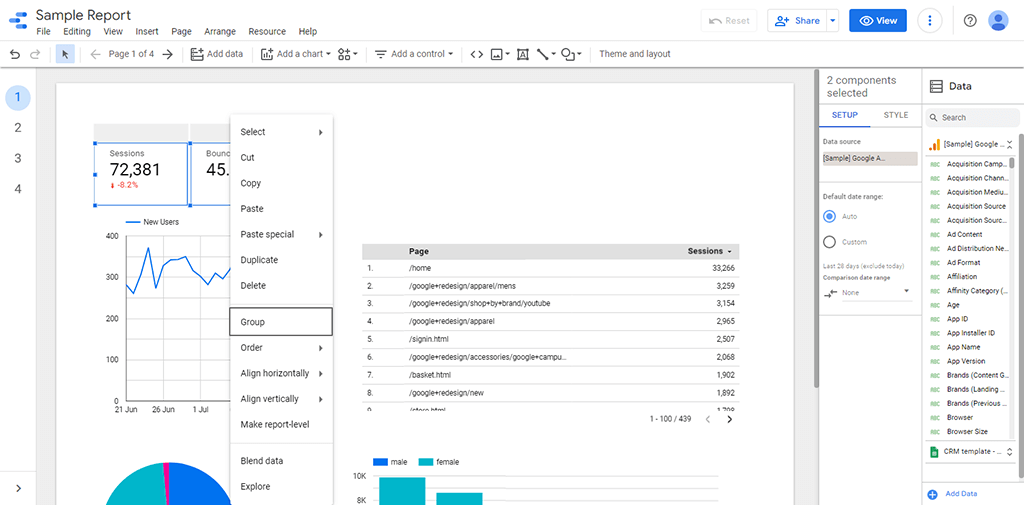
Grouping
Grouping makes it easier to move components as a unit and maintain their arrangement.
You might have a row of scorecards placed the way you want them. Creating a group with these components will stop you from jiggling them.
You can edit the DATA tab options of a grouped set of charts as a whole, like adding the same filter.
To group, Ctrl/Command + left-click the charts you want to group, then right-click and select Group
Conclusion
There you have it, how to create filters on Google Looker Studio.
With this post, you should be able to clean and filter your data on Google Looker Studio to generate better insights, visualizations, and reports.
While you’re here, you should also know that Porter Metrics offers free templates that will help you create reports faster.
I strongly recommend you create a free report now with one of the templates and connect any of your data sources to generate a quick report that will need little to no editing.
You can also schedule a call with the technical team to assist with the onboarding.
Lastly, you should check out a related article from the help center on How to create Filters and Controls on Google Looker Studio and a YouTube video we made on filters and controls
Frequently Asked Questions
How do I create an interactive filter in Looker Studio?
Filters are primarily not meant to be interactive. Once you apply a filter to a chart, the only way to alter what it does is to edit the filter.
If you’re looking for interactive filters, I would suggest you use Controls as they offer a lot of flexibility and interactiveness.
The controls you can use include a drop-down list, fixed-size list, input box, advanced filter, slider, tickbox, date range control, and data control.
How do you edit filters?
Here’s how you can edit filters:
First, you need to click the chart you want that has the filter you want to edit. If the filter isn’t already applied to any chart, you must apply it before editing it.
Then go to the Charts > Setup > Filter field.
After that, click on the pen icon beside the filter name.
Now, you can edit the filter however you wish
How to delete a Looker Studio filter?
To delete a Looker Studio filter go to ‘Resource’ and click ‘Manage filters’
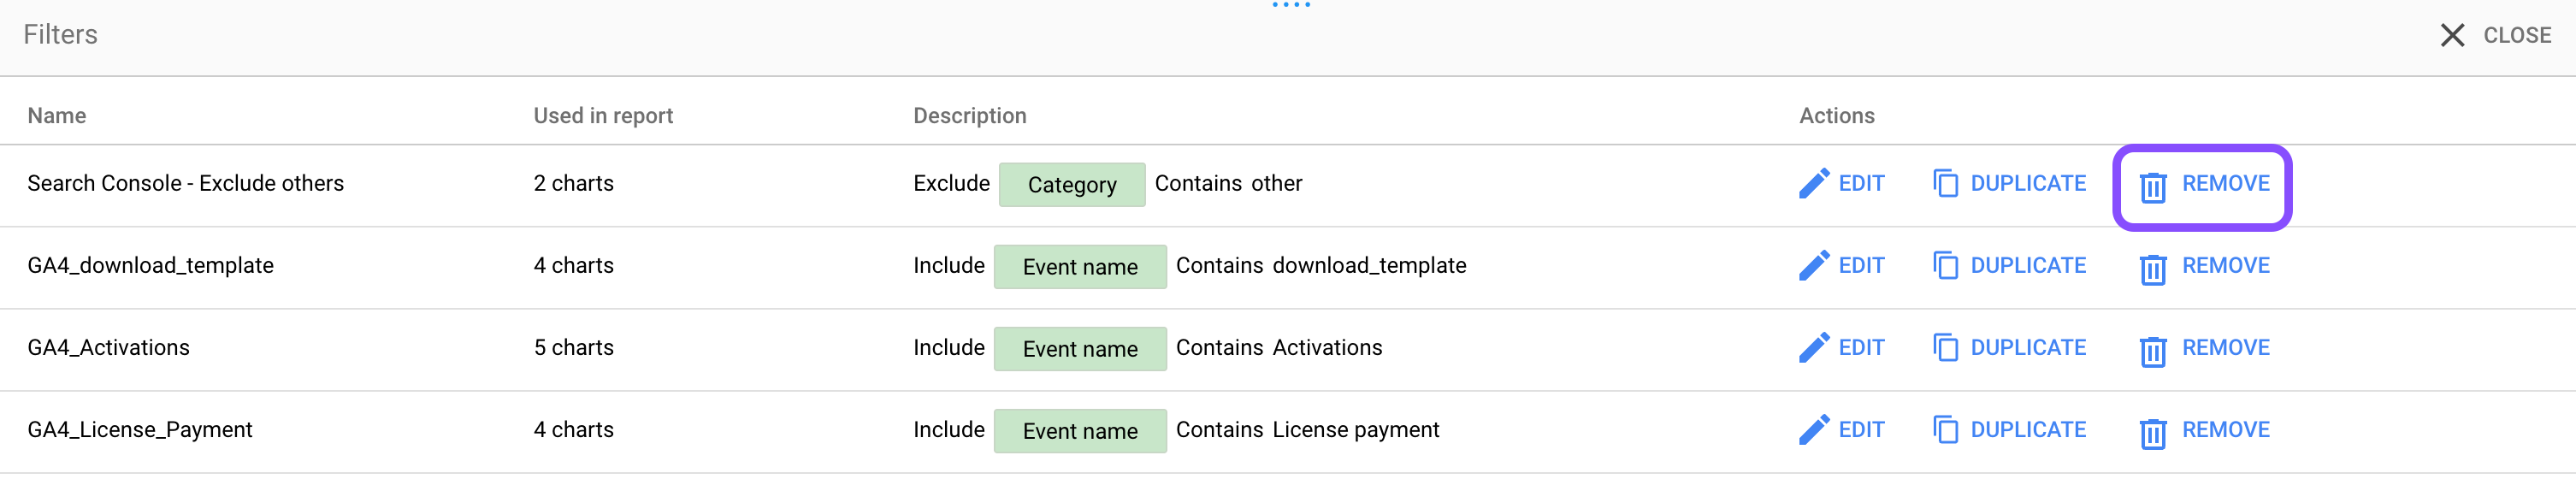
Then click on remove and confirm you want to remove the filter.