Google Data Studio is not kind of helpful or specific when your visualizations break.
In this post, we want to share with you some of the reasons why your visualizations break, along with other common Google Data Studio errors—and how to fix them.
At Porter, we connect apps to reporting tools like Google Data Studio; we know how frustrating it is sometimes to deal with non-actionable error messages.
This is an unofficial guide on solving Data Studio errors, even the ones Data Studio doesn’t offer documentation about.
Missing data source
How to fix the “Missing data source – There is no data source associated with this component” error message on Google Data Studio. 99% of the time, the solution is obvious:
- Go to the chart
- Add a data source to it
- Done
The most common error is that you or someone else accidentally eliminated data sources on your reports, so some charts don’t have any data source connected to them anymore.
But 1% of the time—which is happening recently— it’s due to a Google Data Studio error. We’re noticing some users and customers reporting the “Missing data source” error when they have a connector linked to their charts.
We’re currently exploring if it’s an issue from our end, but it’s likely to be a general Google Data Studio bug, as we’ve seen other providers experiencing the same issues.
The only way to solve this is pretty manual:
- Connect a data source again, from scratch, to your Data Studio report
- Link the data source to the charts
If you have too many charts
Unknown data source
Dang! That’s not a good welcome for new users! This one may be common if it’s the first time you use a connector.
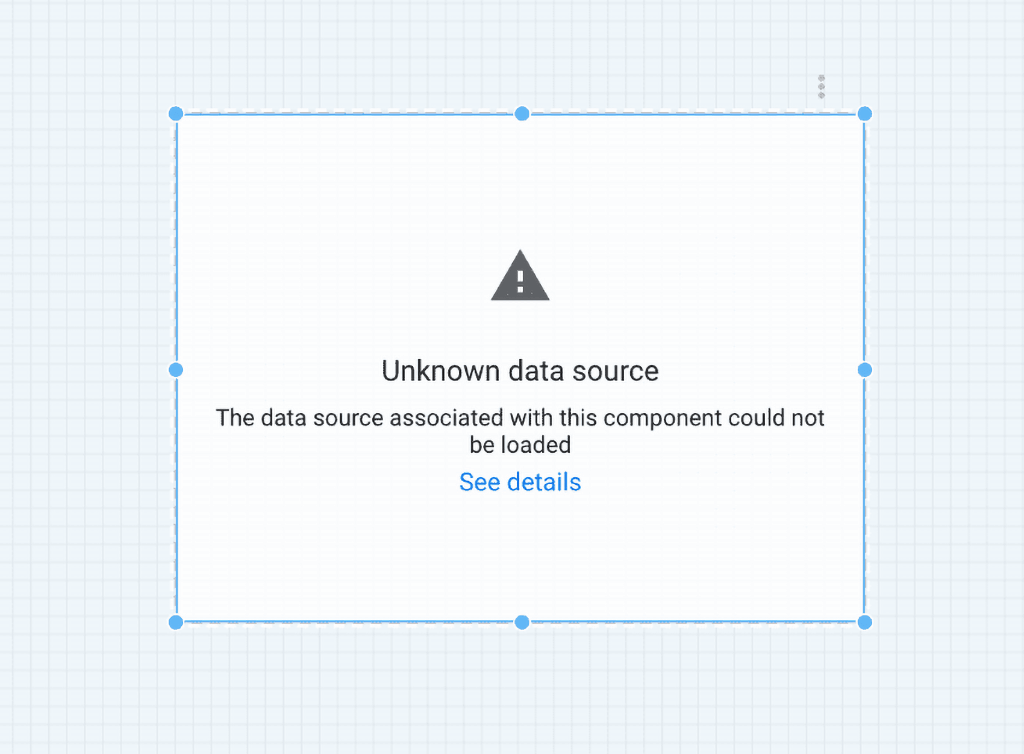
The error suggests that there’s no connector; the visualization is empty. Once you browse Resource – Manage added data source, it will show as an unknown data source.
This problem is new (as of August 2020) and is from the Google side, not the connector side. It turns out that Google is doing some migrations from Drive, which has affected more of their products.
To fix it, we suggest you to go to edit your report; go to Resource – Manage added data sources, disconnect and connect again the connector is showing the error.
If the problem persists, we suggest you to wait a few hours or days and try again.
As for Porter Metrics, your trial will start running once you load your first report so that it won’t affect your 14-day free trial, and we will give you assistance through the process.
You can reach out to us help you on our Messenger support channel or by emailing us at contact@portermetrics.com.
System errors
You may face this kind of errors:
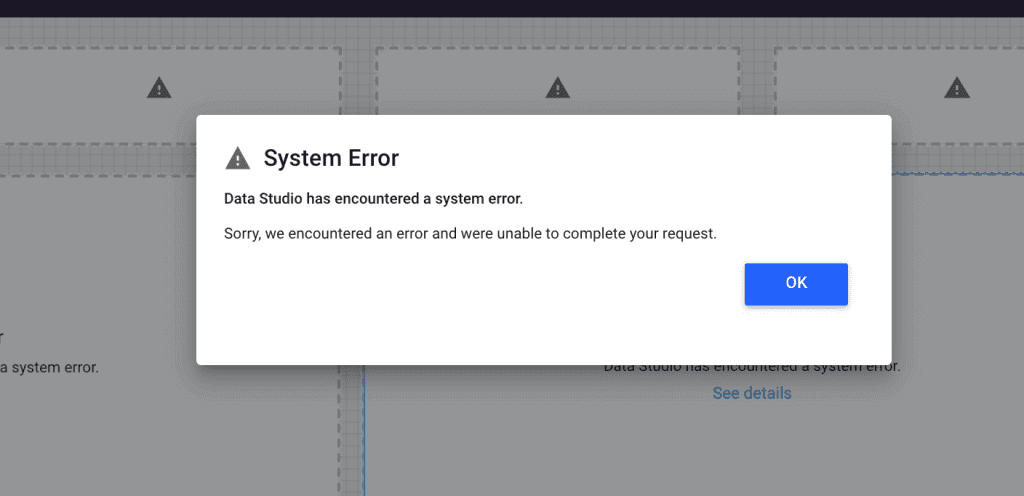
The most likely reason is that you (or someone else) removed the connector used in the affected visualizations.
While it’s less common, Google Data Studio crashes for no reason; at least, not for a reason that it is your actual responsibility.
How to fix it
In the first case, check your connector is correctly set up:
Go to your report
- Edit
- Resources
- Manage added data sources
- Verify your connector is listed
- If connected, click on “Edit” on the connector
- “Refresh fields.”
If the problem persists, reach out to support.
To solve the second scenario, check your internet connection and refresh the report. Maybe, wait some minutes (and pray). If the problem persists, reach out (or whoever provides you with connectors).
User or dataset configuration Error
Google Data Studio may notify that “This data source was improperly configured.”
Fortunately, it will display a body message with a specific error, like this one:
“Report configuration issue – please select a valid combination of dimensions or metrics in the property panel. Error ID: 188687e6”
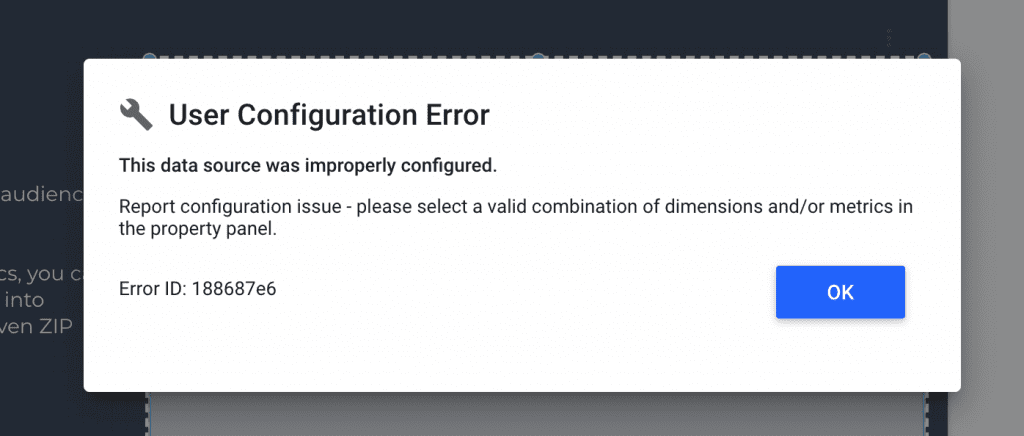
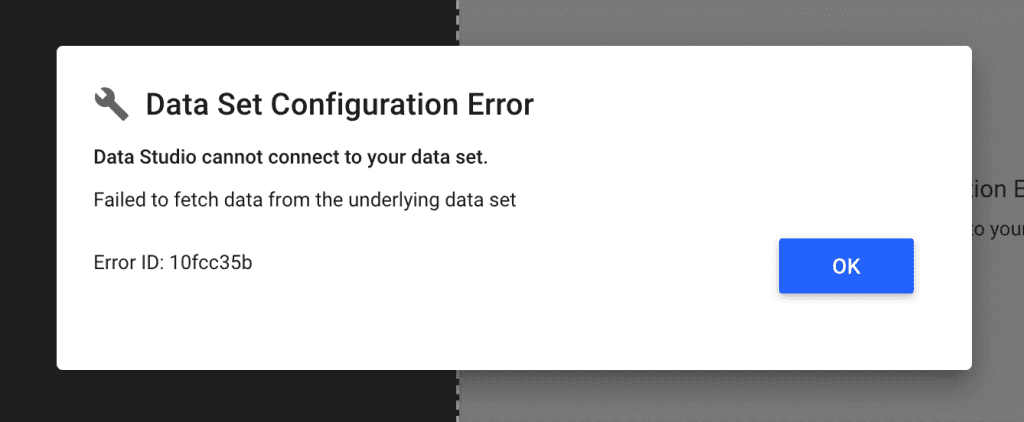
Not all connectors report errors the same way while the example above shows a Google Analytics example, other connectors may show a dataset configuration error, instead of a user error.
Most of the time, error responses and descriptions are up to the connector providers. We encourage you to check that also when choosing one (We try to be as specific as possible).
How to fix it
Choose a valid combination of metrics and dimensions. If you use our Instagram Insights connector, for instance, don’t expect to use a metric related to stories, say, “Stories ID” with “Post likes” as metrics.
Not all wrong combinations show an error – they just display no data.
Another reason why this happens is sorting.
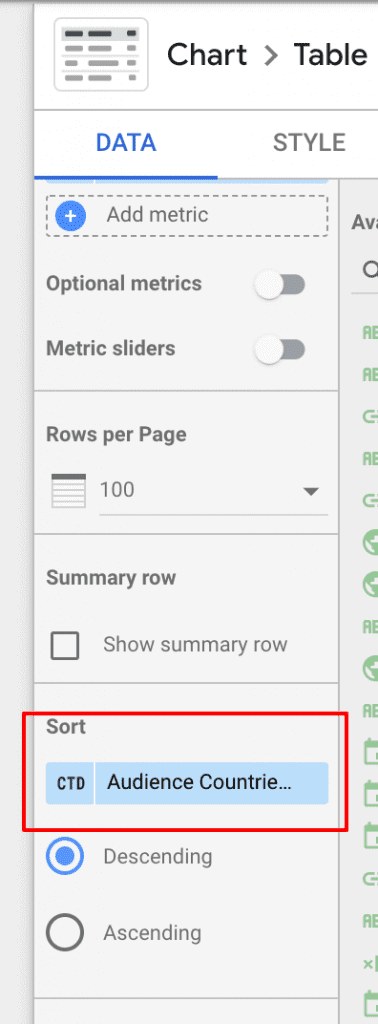
It turns out that Google Data Studio doesn’t always update the sorting or set by default one that may work. Sometimes it will keep the same sorting metric or dimension from your last query that may be invalid.
So, we encourage you to check the dimension or metric Google Data Studio brings by default and make sure it makes sense.
Connector inherent errors
Another type of common errors may display as “Community connector errors.”
As its name says, this error corresponds to the provider.
These provider-related errors may be due to three reasons:
- Your license
- An error while setting up the connector
- An error from the app or API
In this case, we will show why our connectors may show such errors.
You reached license limits (a.k.a no slots available)
This error means that you’re trying to connect more accounts than your current license allows you.
If you’re paying a solo plan—which lets you connect a single account—this error will show if you try to join another.
How to fix it
The best option is upgrading 😀.
However, if you don’t want to upgrade your current plan, you may eliminate one of your current connected accounts.
To do this, reach us out via email or Messenger. We will ask you for the email associated with your account, the type of connector you’re using (e.g., Facebook Ads, Manychat or Instagram), and the ID of the account you want to remove.
All applications have an ID that you should search in their settings. Porter does not generate such IDs – we bring them. For instance, each Ad account has an ID that you can find in the settings for Facebook Ads.
We will remove the accounts as soon as possible and notify you so you can connect a new one.
Invalid combinations (from the app’s side)
Some apps, like Facebook Ads, may restrict the breakdowns or filters you want to apply to your dashboards.
This is an example:
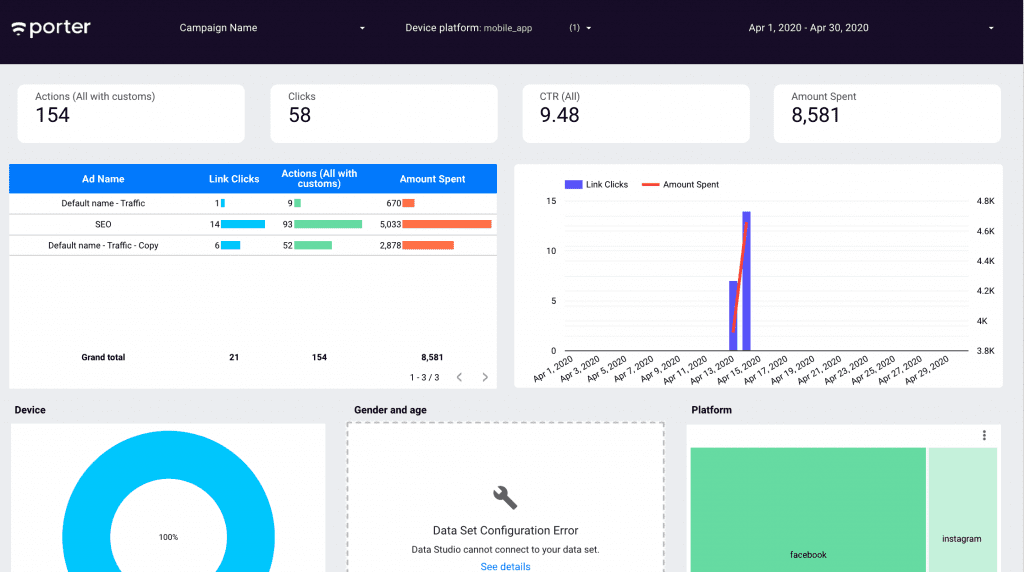
I wanted to create a breakdown by device platform on Facebook Ads. It means that I wanted to break down data by the type of device users was using where they were shown or interacted with Facebook Ads.
In that case, the possible values are mobile, desktop, and tablets. Most visualizations work correctly, but one is where we display a metric by gender and age, showing this error:
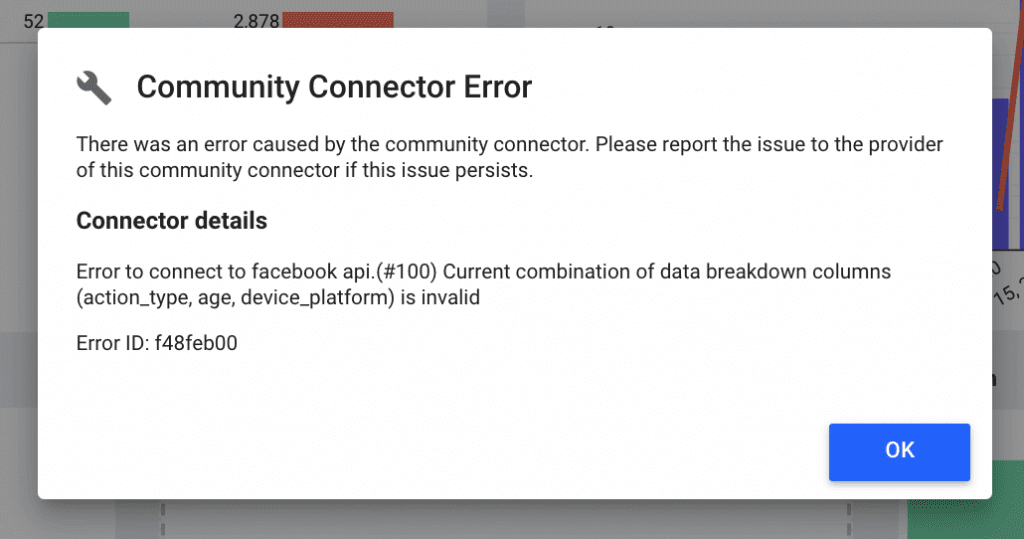
The error details are “Error to connect to Facebook API.(#100) The current combination of data breakdown columns (action_type, age, device_platform) is invalid.”
It means that it’s not possible to combine gender, age, and device breakdowns, and that’s a limitation from the Facebook API. As such, this kind of Error cannot be solved directly.
Yet, you can find a turnaround.
How to fix it
We recommend you to group the visualizations and filters that can work together, so you exclude those who don’t.
This is a good example:
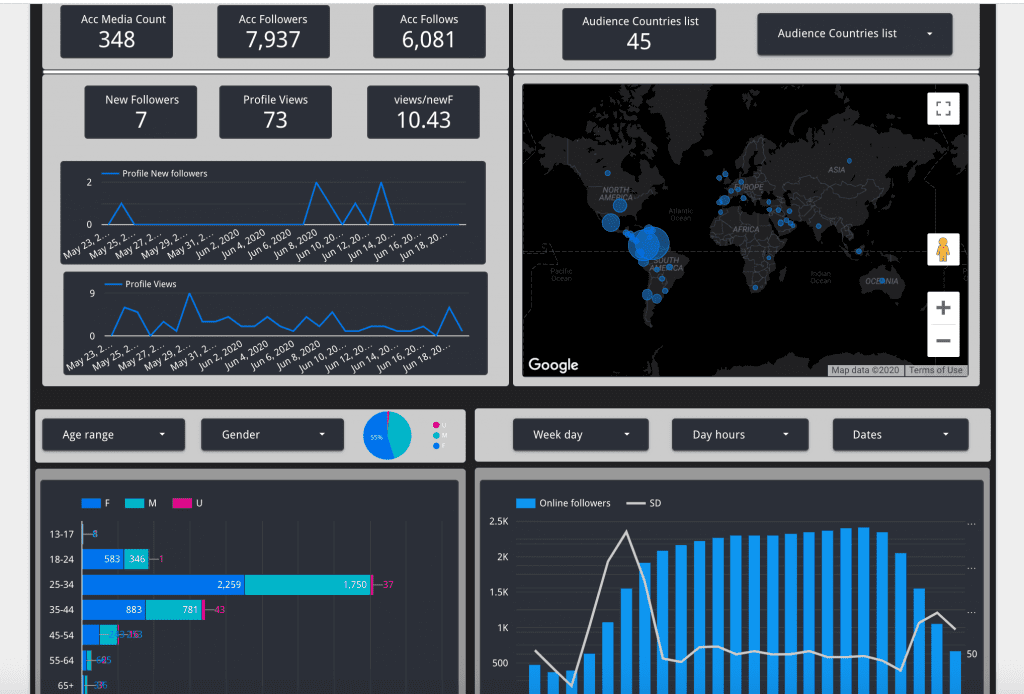
In this Instagram Insights dashboard, the user grouped correspondent filters with visualizations; he uses age range and gender filters that only apply to the gender and age bar chart.
API’s rate or usage limits
All APIs come with a usage limit. If they didn’t have them, they would have Denials of Service attacks daily.
Both apps and Google Data Studio ends have limitations to avoid such resources over-usage that occasionally will show errors n Google Data Studio.
These limits are also the reason why your dashboards may take a few seconds to load.
How to fix it
Refresh the report. If the problem persists, consider reducing the number of queries you’re doing:
- Remove some visualizations
- Reduce the time range you want to visualize
- Remove comparisons
If you cannot reduce your reports, consider separate visualizations on different pages, rather than having them all in a single one. That should also help improving load times.
Authentication errors
We request access to your accounts to let Porter retrieve data from any application to Google Data Studio.
It doesn’t mean we take your password a user name, but the permission to pull such data that our personnel cannot access anyways unless you requested it.
A popular way of managing such permissions while ensuring privacy is token-based authentication. A token is like a key that gives access to Porter to your app’s data.
All tokens have an expiration date, or they might fail, making Porter lose the connection to your app.
A typical example is Facebook Ads. If you don’t use the connector for a while, Facebook may expire your token, and the next time you access your reports, you will need to refresh the authorization.
How to fix it
To refresh authorizations, follow these steps:
- Go to a Google Data Studio report
- Click on “Edit” in the top-right corner of the page
- Resources (in the menu)
- Manage added data sources
- Click on “Edit”
- Click on “Edit connection.”
- Click on re-connect
- You will see a popup window. There, click on “Update credentials.”
You might find some errors with no consistent description, just like this one:
Provider bugs
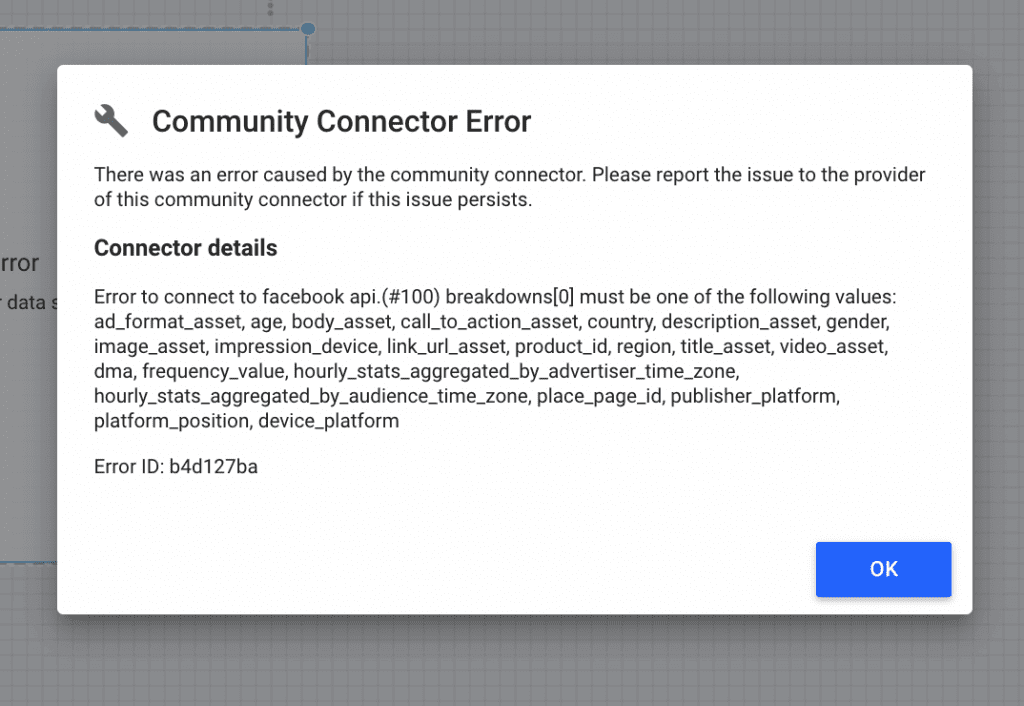
In this case, I wanted to bring geographical dimensions like region or country.
Most of the time, these errors are due to a bug in the connector. To fix it, contact your connector provider. In our case, we’re more than glad to solve these problems ASAP.
Want to add more Google Data Studio errors?
We’re continually updating all the errors our users may present while using Google Data Studio and our connectors.
If you find a new error, please feel free to reach out; we will be glad to help you solve it and document the process in this article.


