A store performance report should include metrics such as visibility, engagement, and conversion. These metrics should be broken down by campaign, channel, audience, content, objective, and date. For example, the report may include the number of impressions, click-through rates, and conversion rates for each campaign or channel. By segmenting the data in this way, one can analyze the effectiveness of different campaigns and channels in reaching the target audience and driving conversions.
To analyze store performance data, we need to include the following metrics:
1) Visibility metrics: These can include website traffic, impressions, reach, and social media followers. For example, we can measure website traffic by the number of unique visitors or page views.
2) Engagement metrics: These can include click-through rates, time spent on site, social media likes/comments/shares, and email open rates. For example, we can measure click-through rates by dividing the number of clicks by the number of impressions.
3) Conversion metrics: These can include sales revenue, conversion rates, average order value, and return on ad spend. For example, we can measure conversion rates by dividing the number of conversions by the number of website visits.
To add context to the report, we should compare the metrics against previous periods, budget spent, and industry benchmarks. For instance, we can compare website traffic for the current month with the previous month to identify any fluctuations. We can also analyze conversion rates in relation to the ad spend to determine the return on investment.
In order to segment the data, we should consider campaigns, channels, audience demographics, content types, objectives, and date ranges. For example, we can compare the performance of different marketing campaigns in terms of click-through rates. We can also analyze website traffic based on the channels through which visitors are coming, such as organic search, paid search, social media, and email marketing. Segmenting data allows us to identify successful strategies and optimize our marketing efforts accordingly.
To build a store performance dashboard, 1) connect your data and accounts from sources like POS systems, e-commerce platforms, and customer databases. 2) Select metrics such as sales volume, revenue, customer footfall, and conversion rates to monitor performance. 3) Segment or break down data by campaign, sales channel (online or in-store), audience demographics, product categories, customer content (reviews or feedback), objective (sales or customer satisfaction), and date. 4) Add filters or buttons for real-time data manipulation and to make your report interactive, such as filtering by date range or product category. 5) Share the dashboard via PDF, scheduled emails, or links to relevant stakeholders.
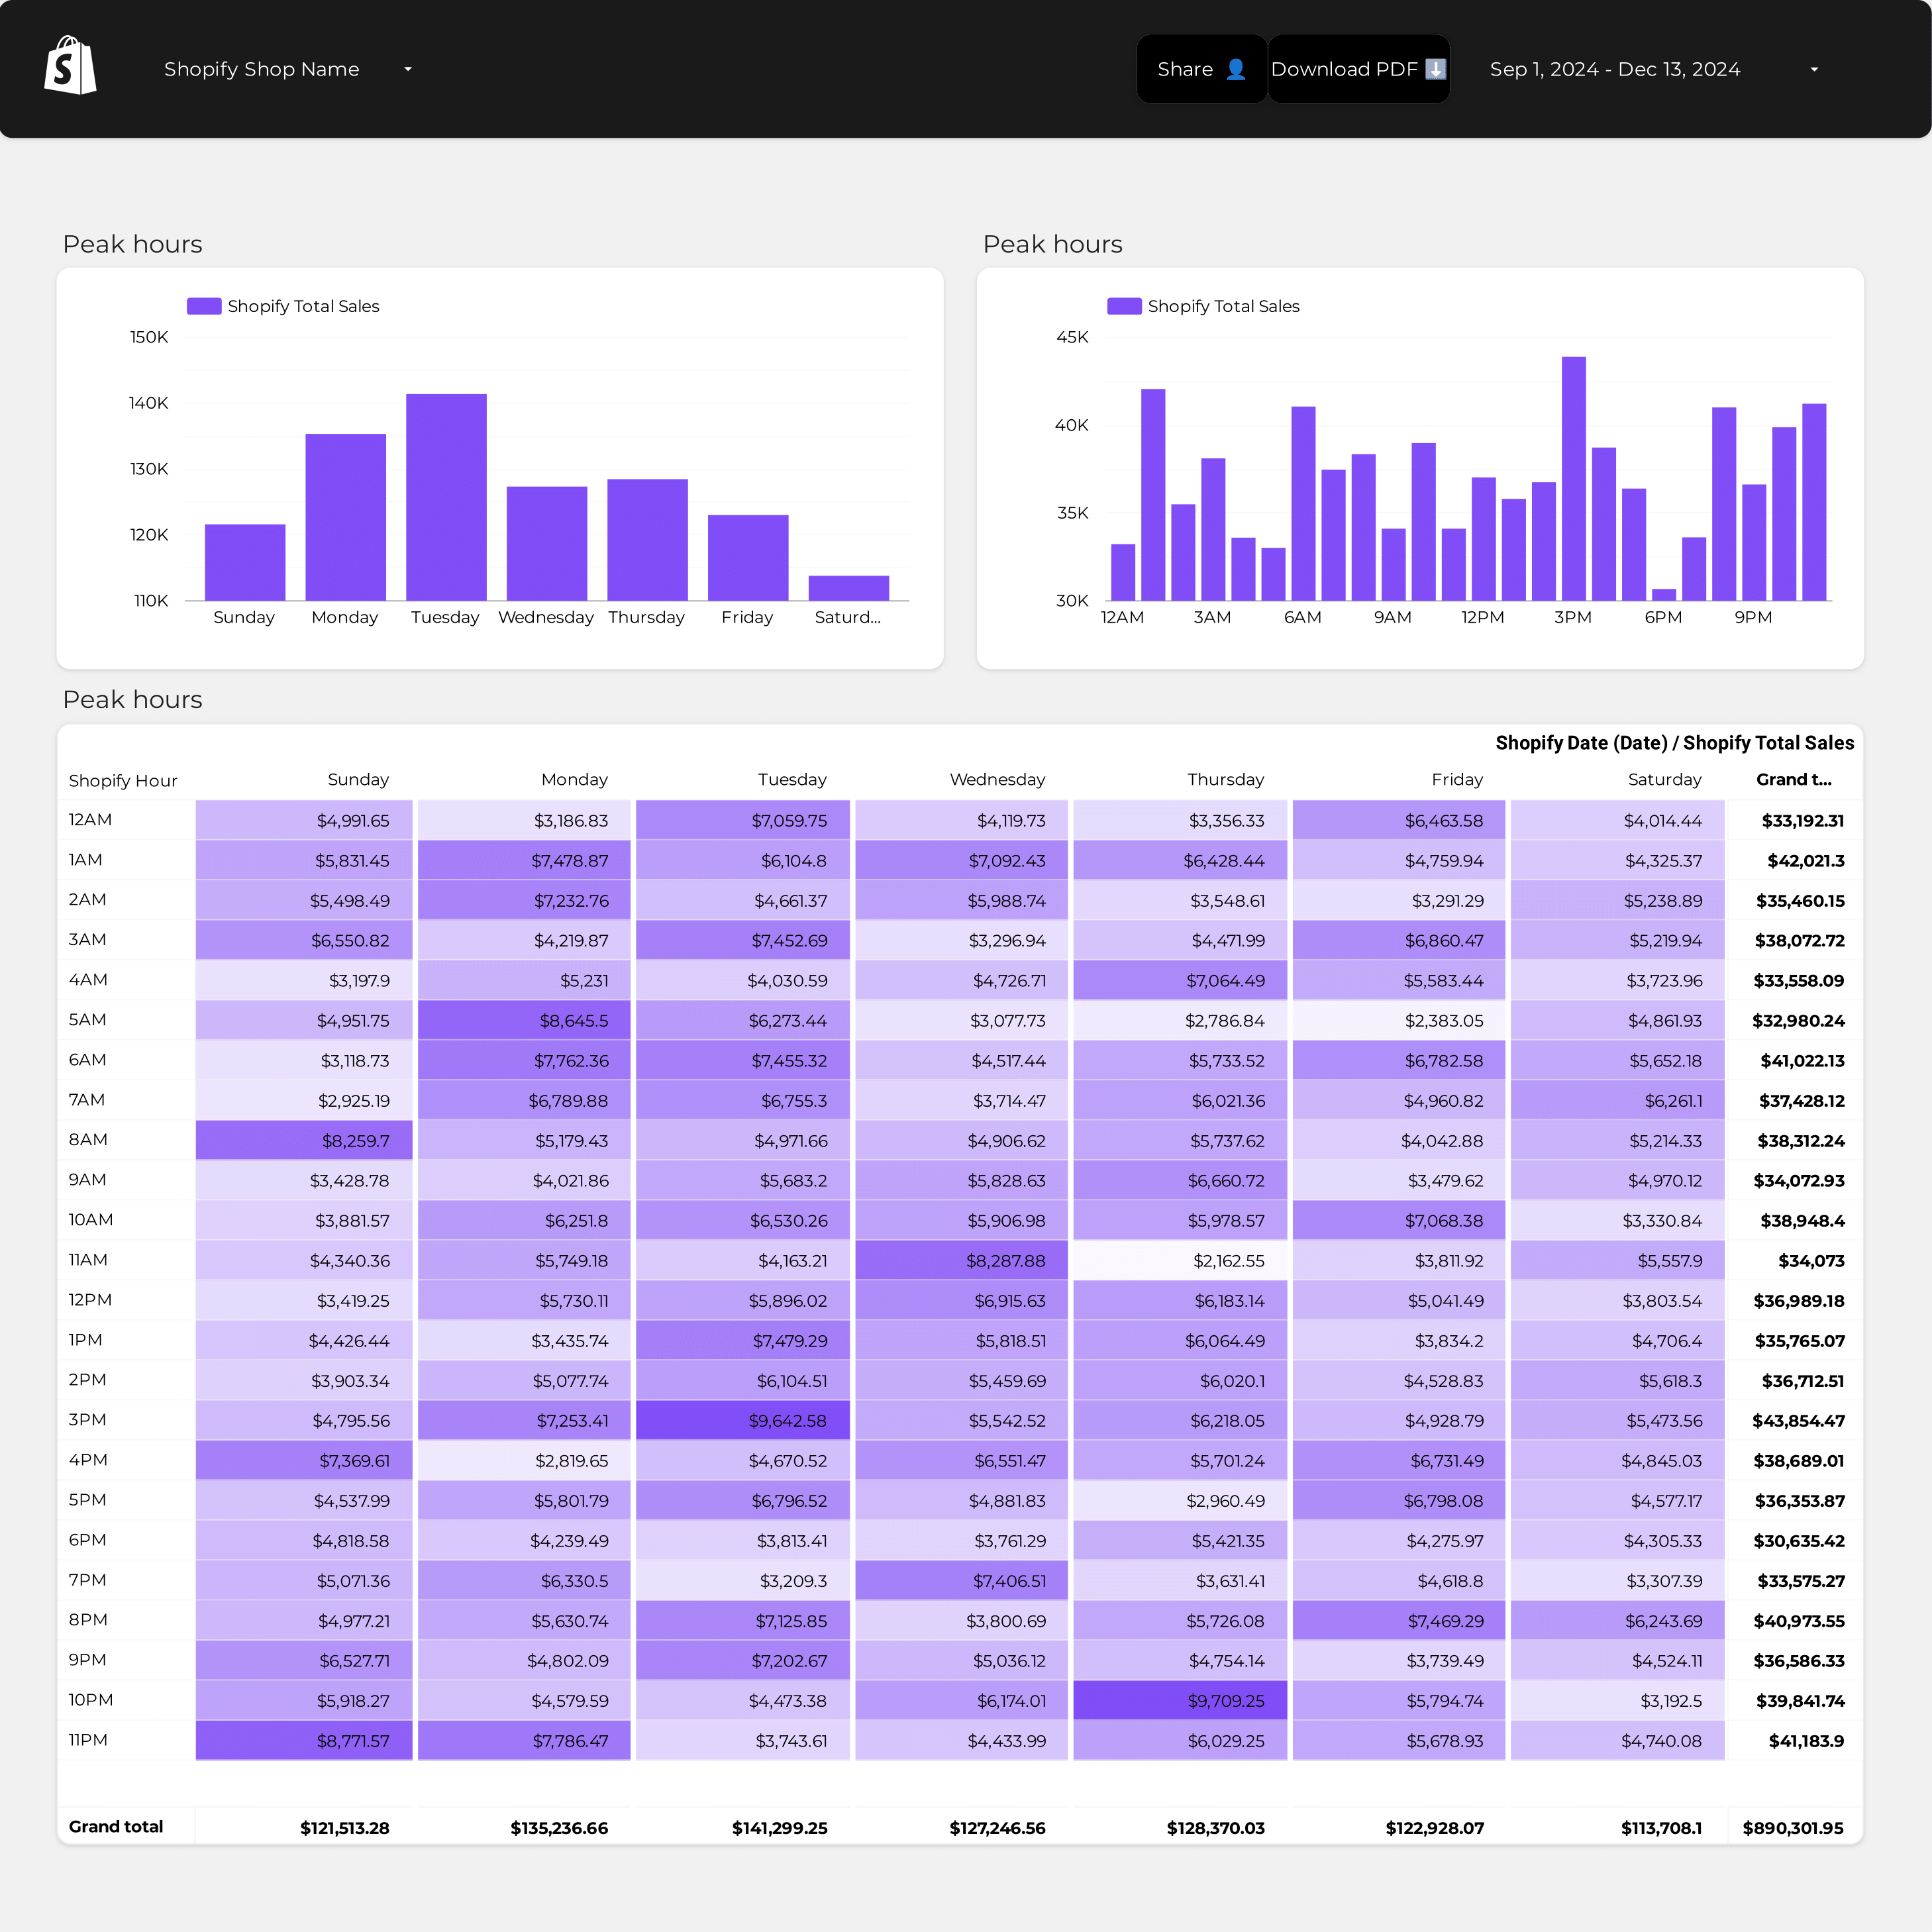
A Shopify Store performance dashboard is a tool used to monitor and analyze the performance of an e-commerce store on Shopify. It integrates data from various sources like Google Analytics 4, Google Ads, and SEO metrics to provide insights into key performance indicators such as impressions, clicks, ad spend, conversion rate, sessions, and bounce rate. The dashboard helps store owners track campaign names, dates, product names, and source mediums to optimize their marketing strategies and improve overall store performance.
Can I download this template in PDF?


 Impressions
 Ad Spend
 Conversion Rate
 Sessions