A PPC report should include a breakdown of metrics by visibility, engagement, and conversion metrics. The data should be segmented by campaign, channel, audience, content, objective, and date. For example, it should provide visibility metrics such as impressions and click-through rate, engagement metrics like average session duration and bounce rate, and conversion metrics like conversion rate and cost per conversion.
To analyze the data in a PPC report, follow these steps:
1) Choose metrics: Break down by visibility (impressions, reach), engagement (click-through rate, average session duration), and conversion metrics (conversion rate, cost per conversion).
2) Add context: Compare metrics against cost (cost per click, cost per thousand impressions), date range (performance over different time periods), goals (campaign objectives), rates (bounce rate, conversion rate), and benchmarks (industry averages).
3) Segment data: Analyze data by campaign (performance of different advertising campaigns), channel (performance across different advertising channels), audience (performance by different target audiences), content (performance of different ad creatives), objective (performance based on different campaign objectives), and date (performance by specific time periods).
For example, when analyzing the visibility metrics, compare the impressions and reach of different campaigns to determine which campaigns are generating higher visibility. Compare the engagement metrics, such as click-through rate and average session duration, to assess the effectiveness of different channels or content. Analyze the conversion metrics, such as conversion rate and cost per conversion, to identify the most successful campaigns or target audiences.
To build a PPC dashboard, 1) connect your Google Ads and Analytics accounts. 2) Select metrics such as click-through rate, cost per click, and conversion rate to monitor performance. 3) Segment data by campaign, channel, audience, product, customer content, objective, and date for detailed insights. 4) Add filters for specific keywords or geographic locations and buttons to switch between different data views to make your report interactive. 5) Share your dashboard via PDF, scheduled emails, or links for easy access.
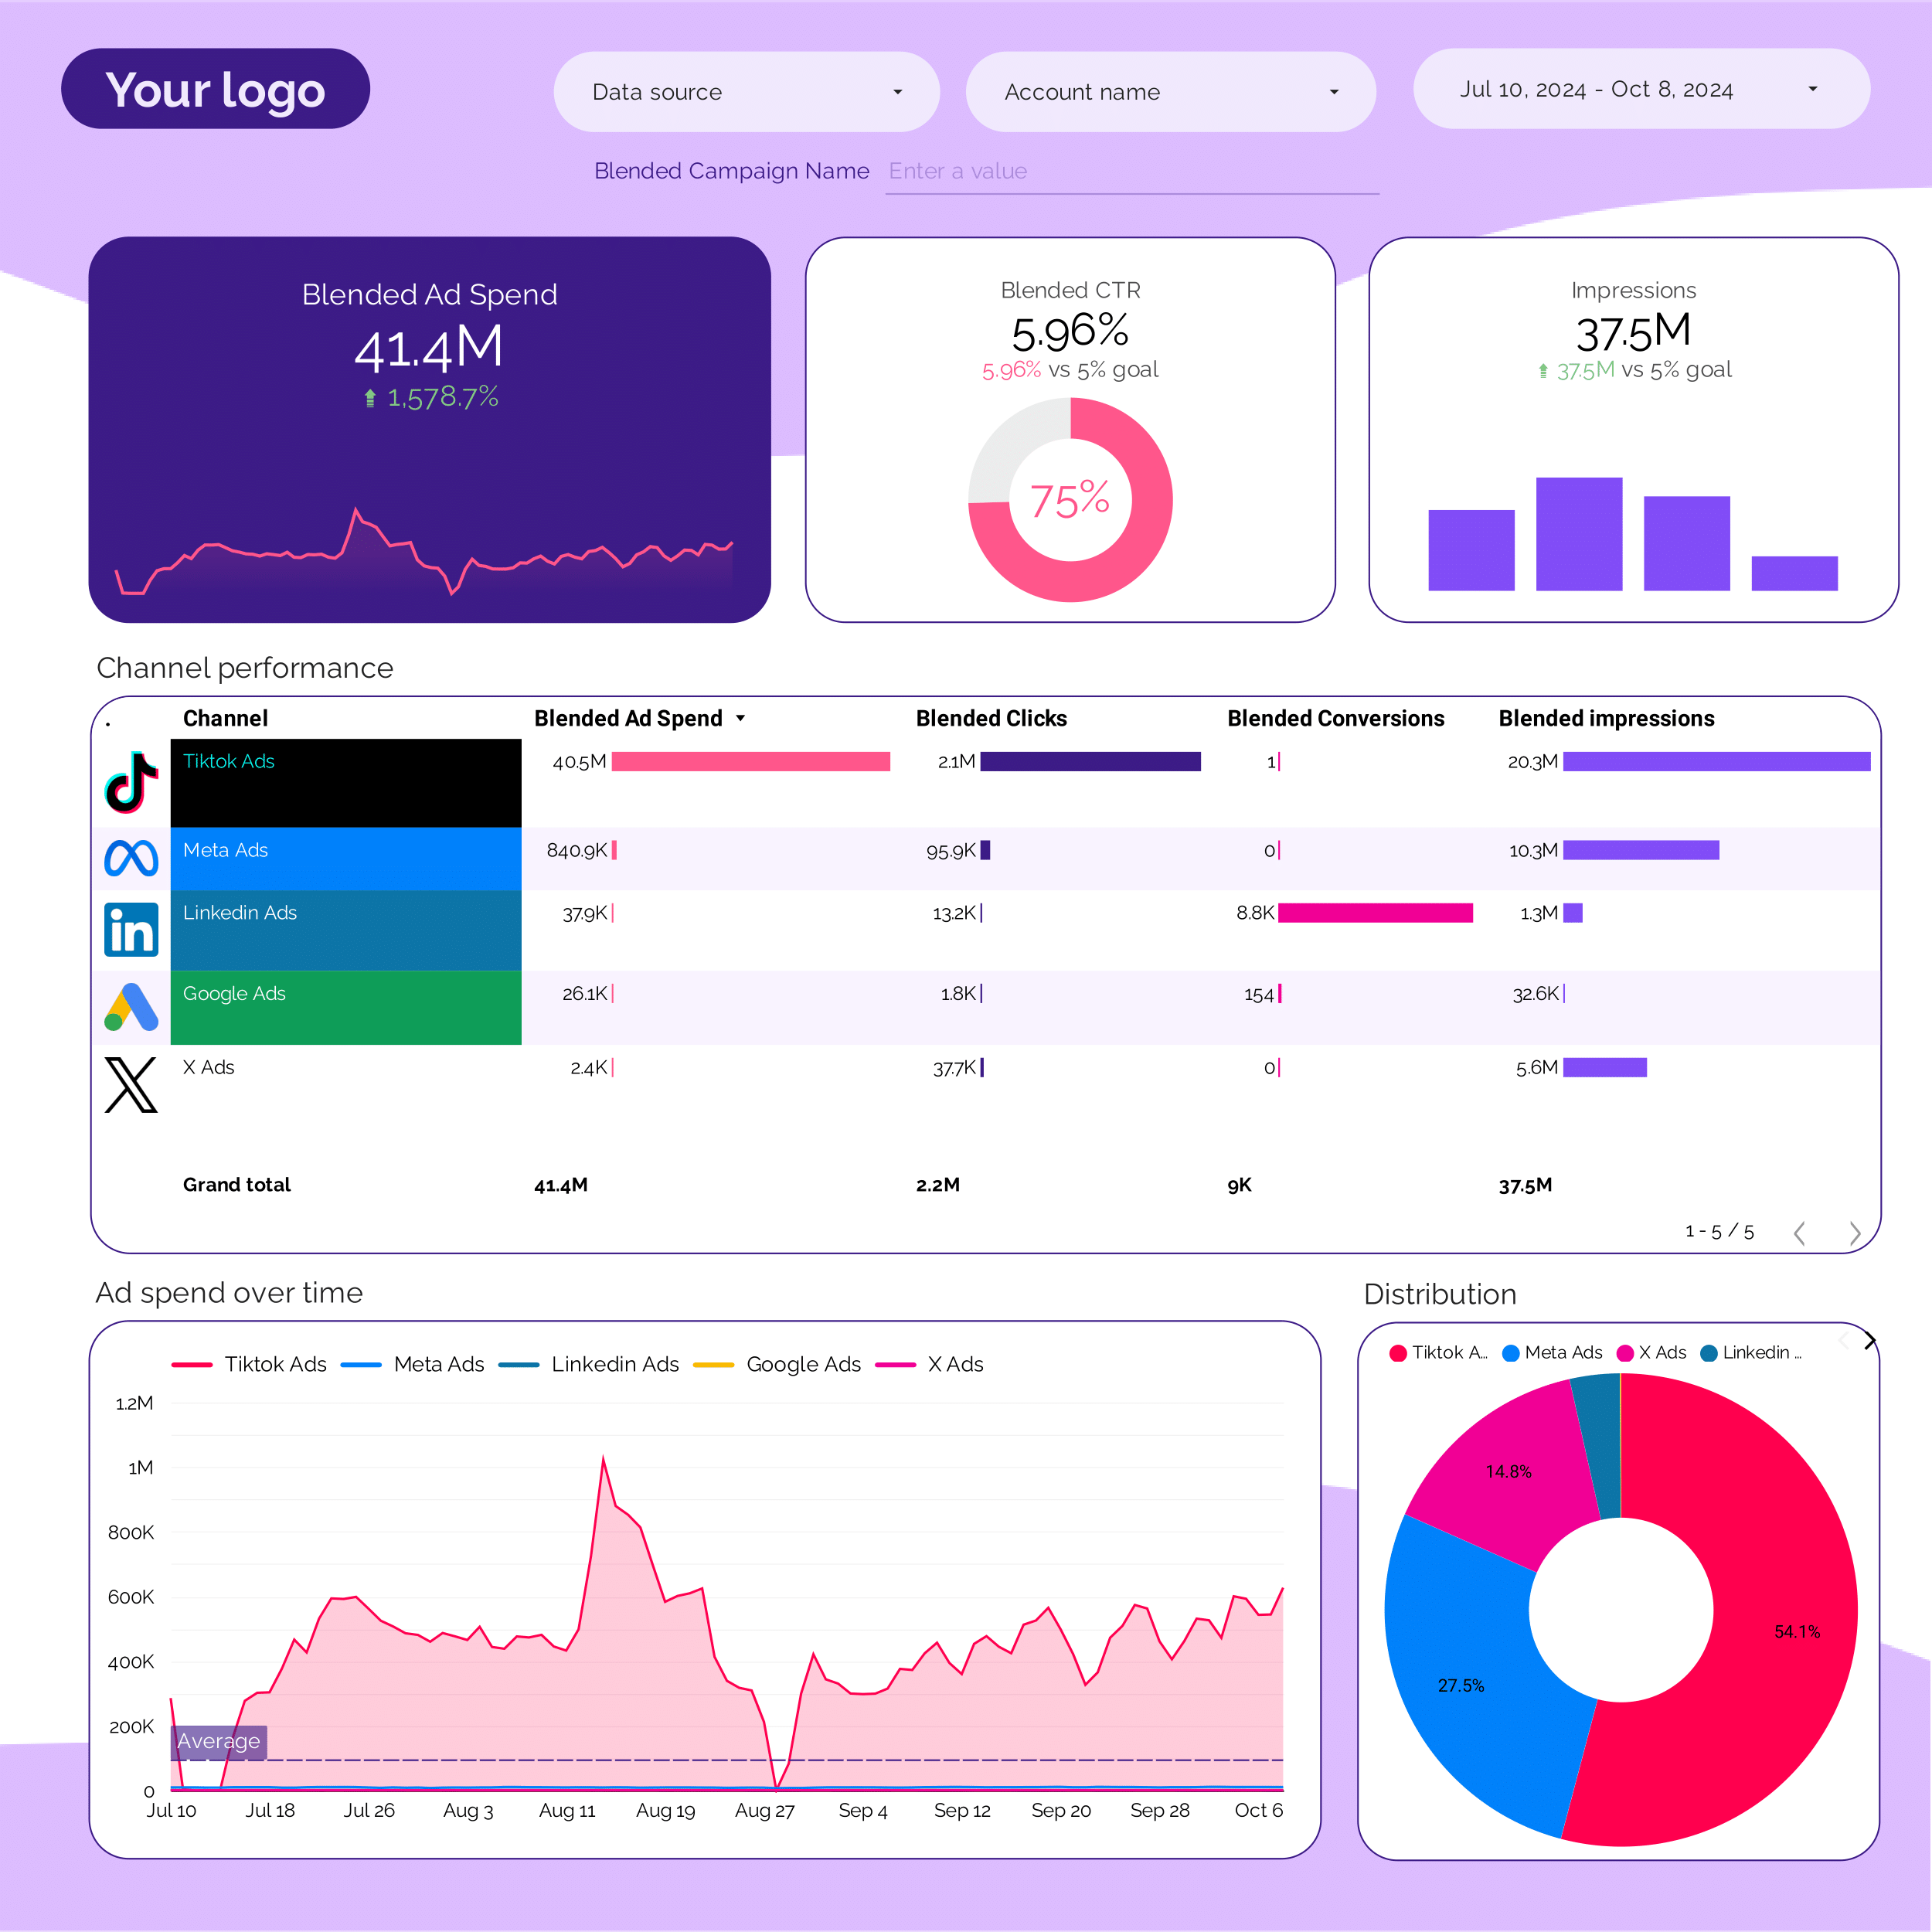
A PPC (Pay-Per-Click) dashboard is a tool that visually displays key performance metrics related to pay-per-click advertising campaigns. It is significant for businesses as it helps them monitor campaign performance, optimize strategies, and make data-driven decisions. Tools commonly used to create a PPC dashboard include Google Analytics, SEMrush, and Looker Studio. Key elements typically included are impressions, clicks, conversions, cost-per-click, and return on investment. Real-time data monitoring is crucial as it allows businesses to react quickly to changes and optimize campaigns for better results. For learning how to create a marketing dashboard using Looker Studio, visit our YouTube channel: https://www.youtube.com/@porter.metrics.
Can I download this template in PDF?


 Impressions
 Page Likes
 Video Views