Facebook Ads creative analysis dashboard template for Google Sheets

Identify your most effective ads and creative assets by analyzing their engagement and conversion rates. Compare ad performance against your targets, examining key metrics such as ad names, Return on Ad Spend (ROAS), and hook rate to determine which creatives are driving the best results.

By Porter

This template is built by the same marketers behind all our tutorials, support, and our template gallery.

Data sources included

+40,000 marketers have downloaded our dashboards

Questions you can answer using this Facebook Ads dashboard template

  • Which ads are significantly overperforming, and what common elements do they share?
  • Which ads are underperforming, and what factors might be contributing to their poor performance?
  • How do different budget strategies (daily, weekly, lifetime) impact ad performance?
  • What targeting methods (e.g., lookalike audiences, interest-based, custom audiences) are yielding the best results?
  • How does the duration of ad campaigns affect their performance?
  • Are there any trends in performance based on ad content or messaging?
  • How effective are our video ads compared to static image ads?
  • Which ads have the best ROI, and how can we scale their success?
  • What is the relationship between ad spend and performance across different metrics?
  • How do our best-performing ads compare to our target metrics?

How to set up this Google Sheets template?

Copy the Facebook Ads creative analysis dashboard template for Google Sheets in one click and automate your reporting

Follow these steps:


  • Step 1: Make a copy of the template.

  • Step 2: Download the extension and authorize your profile.

  • Step 3: Choose the accounts you want to pull data from.

  • Step 4: Use our prebuilt queries or build one from scratch to automate your data collection. Alternatively, you can input data manually.

  • Step 5: Set up automatic refresh to keep your dashboard updated.


Metrics and dimensions included

Customize the template’s metrics and dimensions as you like. See all available Facebook Ads fields.

Metrics

  • Engagement metrics

    • Link clicks
    • CTR (Click-through rate)
    • Landing page views
    • Hook rate

  • Customizable charts

    • Purchases
    • Purchase conversion value
    • Purchase ROAS (Return on Ad Spend)
    • CPA (Cost Per Acquisition)
    • ROAS score (Winner/Loser)

  • Visibility metrics

    • Amount Spent
    • Impressions
    • CPM
    • Link clicks

Dimensions

  • Date

    • Time progress: hours, days, weeks, month, quarter, and year.
    • Status: overspending or underspending
    • By day, week, month, quarter, or year.

  • Campaign

    • Campaign name
    • Adset name
    • Objective

  • Ad details

    • Ad Image URL
    • Post type (all shown as "SHARE" in this case)
    • Body asset text (ad copy)

Features

You can customize your marketing reports directly in Google Sheets with your logo, colors, and branding.
Set up email alerts using conditional notifications when a cell value changes.
Edit all charts and change style values, and then paste them on your Google Slides so they can auto sync.

Utilize functions like SUMIF, VLOOKUP, IF, and ARRAYFORMULA to calculate key metrics like CPA, ROAS, and CTR, automating calculations and combining data fields.

Pull your historical marketing data automatically using our Google Sheets marketing extension.

Filter by date, campaign, channel, and more to get the insights you need.
Set, track, and achieve marketing goals with real-time updates.
Set sync intervals to match your reporting needs, whether daily, weekly, or monthly.
Connect Google Analytics, Facebook Ads, Instagram, LinkedIn, and more to create a unified view of your marketing performance.

FAQs

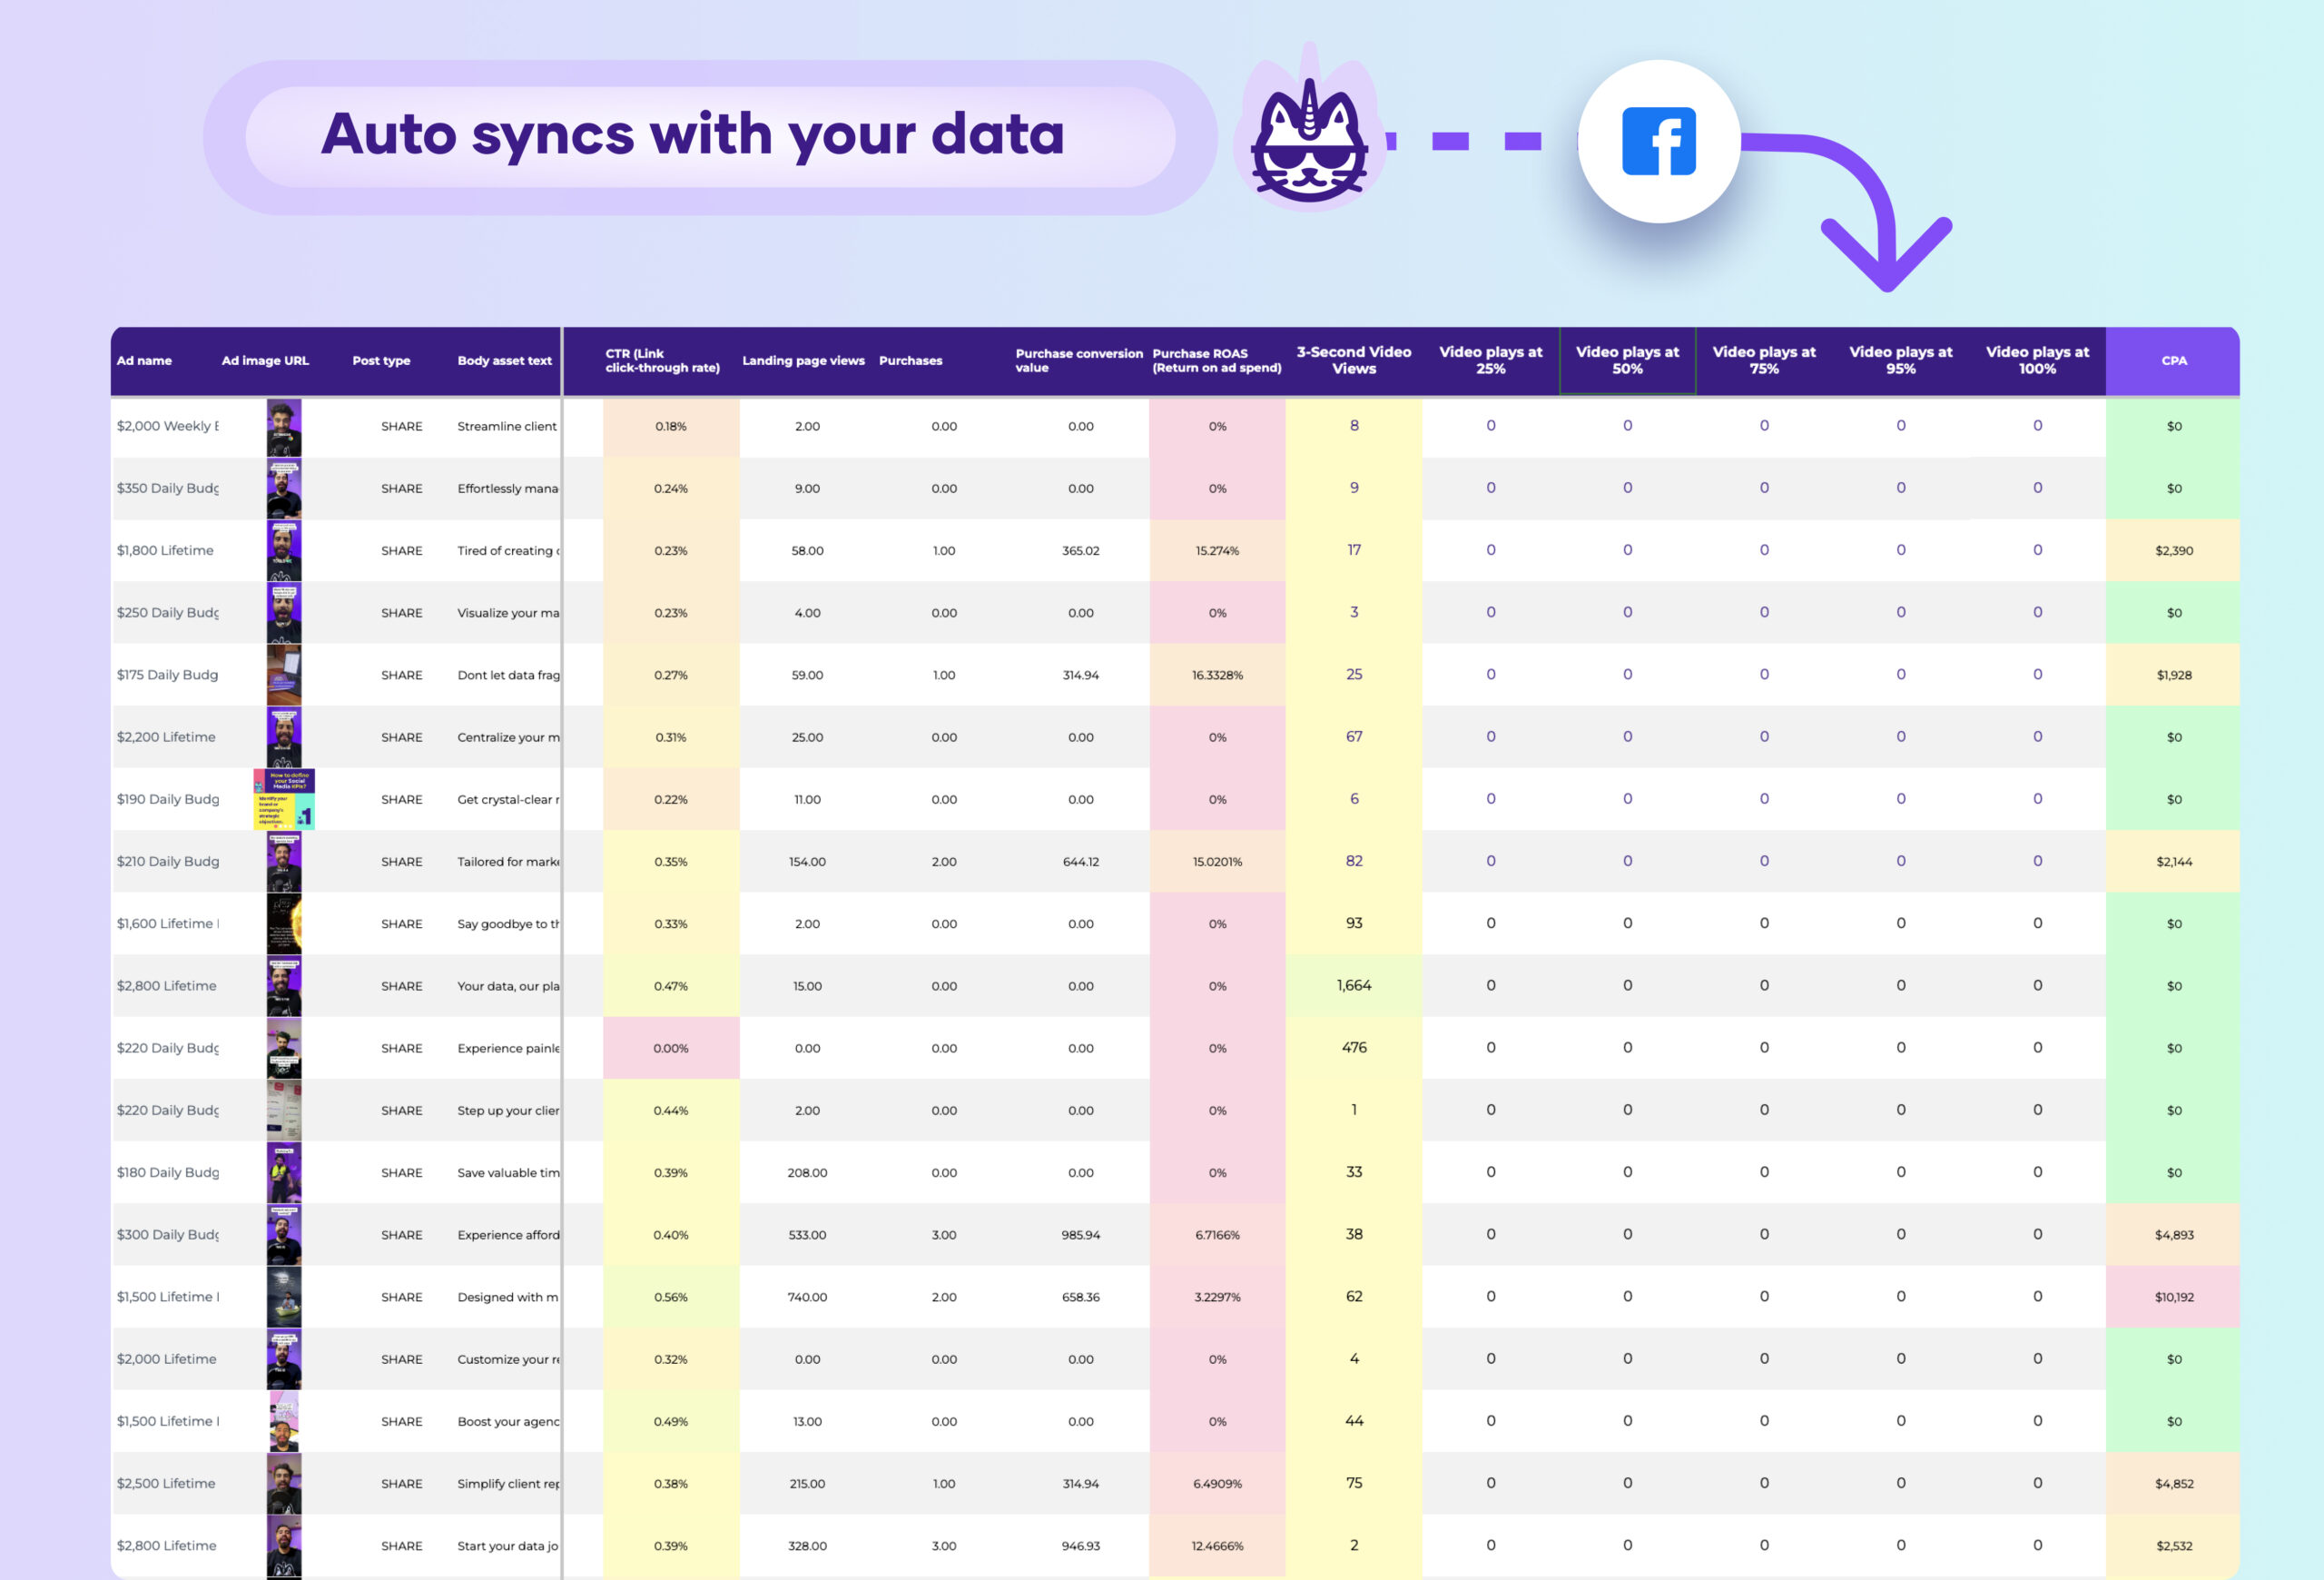
You should include three levels of analysis:visibility metrics, engagement metrics, and conversion metrics,

Start by incorporating visibility metrics such as 3-second video views and video completion rates at various thresholds (25%, 50%, 75%, 95%).

Track engagement through link clicks, click-through rates (CTR), landing page views, and hook rates.

Measure conversion effectiveness with purchase data, conversion values, and return on ad spend (ROAS). Include investment metrics like cost per acquisition (CPA) and average order value (ADV). Provide performance scores (winner/loser) for CTR, ADV, and ROAS to quickly identify top-performing creatives. Ensure the dashboard allows filtering by ad name, CTR winners, ROAS winners, and hook rate. Include visual elements like color-coding and ad image previews for at-a-glance performance assessment.

To automate this report, you should consider using a data integration tool that can connect directly to the Facebook Ads API. This will allow for automatic syncing of your Facebook Ads data, ensuring real-time updates and enabling more timely optimizations to your campaigns.

While this template is designed specifically for Facebook Ads, you can use Google Sheets’ multichannel connectors such as LinkedIn Ads, GA4, Shopify to integrate data from other marketing platforms. By combining insights from different sources, you can create a unified view of your overall marketing performance.

To set up email alerts, use the built-in notifications feature in Google Sheets. You can create custom rules to trigger email alerts based on specific conditions, such as when your actual spend exceeds the budget or when pacing percentages hit certain thresholds.

Yes, you can fully customize the charts in the dashboard. You can choose different chart types, adjust colors, fonts, and styles, add data labels, legends, and trendlines, and customize axes and gridlines to match your reporting needs.