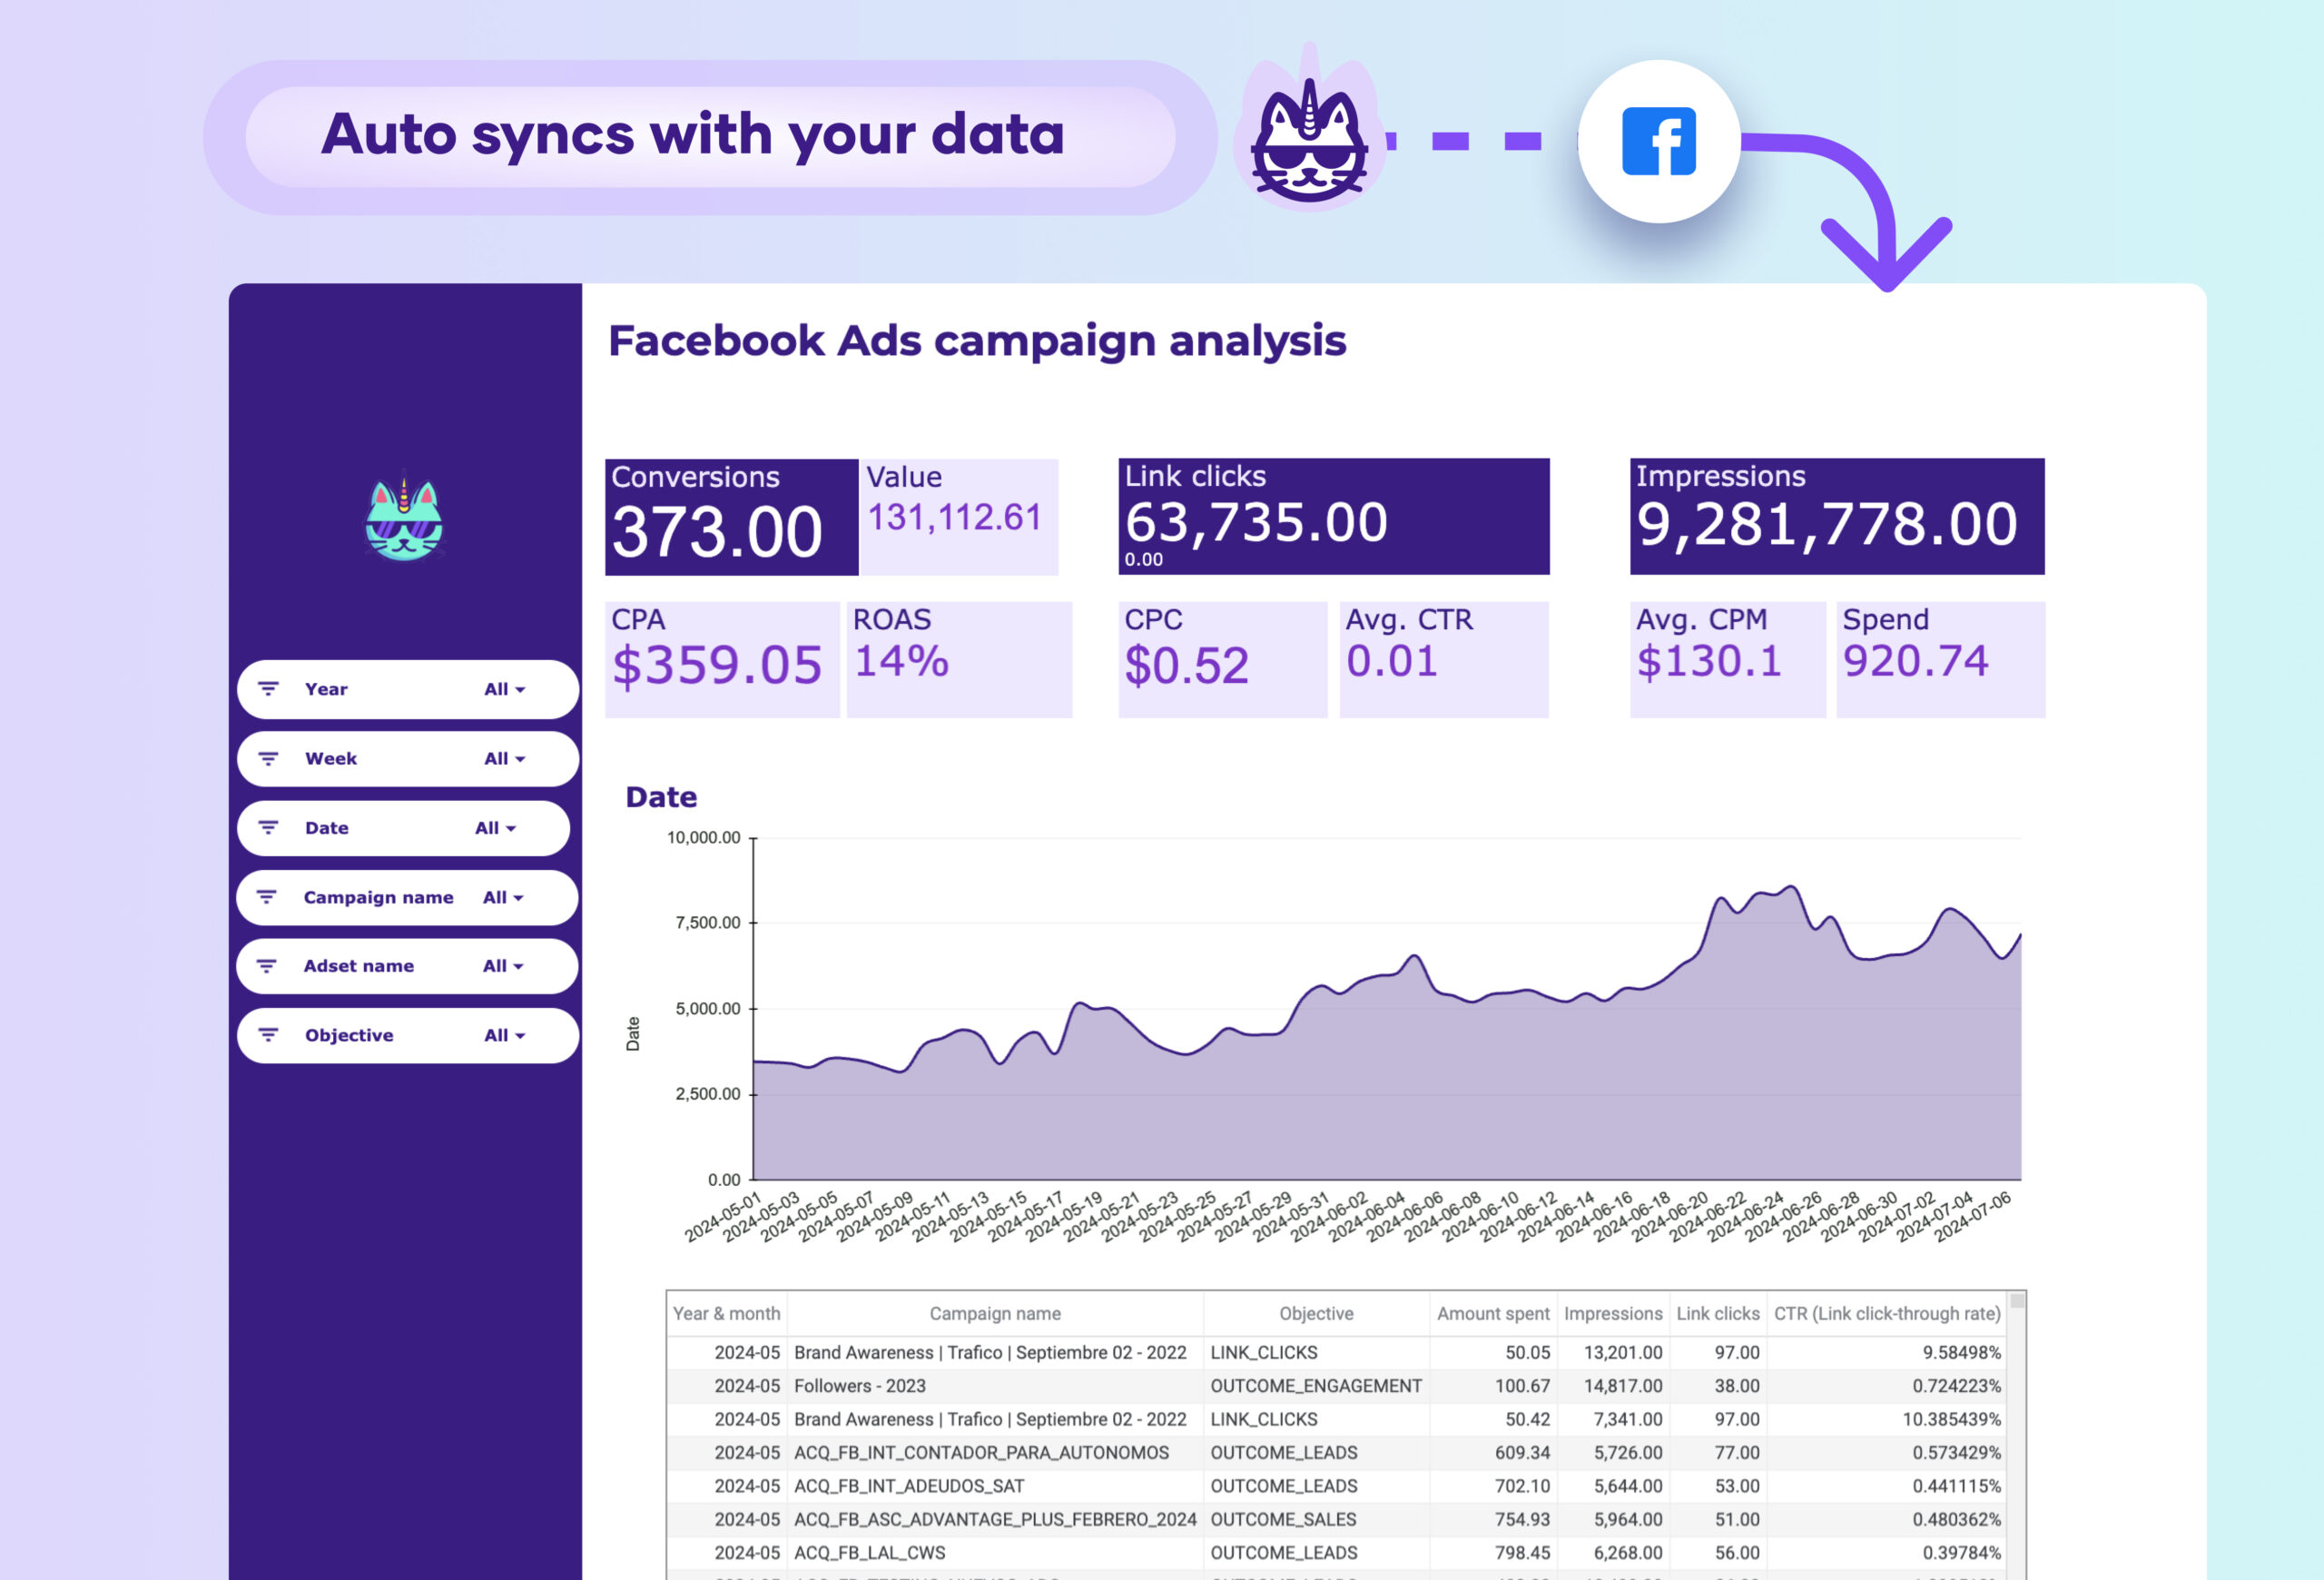
Facebook Ads campaign performance dashboard template for Google Sheets
Track your Meta Ads customer journey from first impression to final purchase in one comprehensive view. Monitor top-funnel reach through bottom-funnel conversions effortlessly.
Utilize functions like SUMIF, VLOOKUP, IF, and ARRAYFORMULA to calculate key metrics like CPA, ROAS, and CTR, automating calculations and combining data fields.
For a comprehensive Facebook Ads tracking and pacing dashboard template, you should include the following:
Conversion Metrics: Total conversions and conversion value.
Engagement Metrics: Link clicks and impressions.
Efficiency Metrics: Cost Per Acquisition (CPA), Return On Ad Spend (ROAS), Cost Per Click (CPC), Average Click-Through Rate (CTR), and Average Cost Per Mille (CPM).
Budget Overview: Total budget, actual spend, and remaining budget.
Pacing Metrics: Pacing in dollars and percentages, with drill-down capabilities by day, week, month, and quarter.
Campaign Performance: Breakdown by campaign name, objective, amount spent, and key performance indicators.
Visual Data: Time series graph to show performance trends over time.
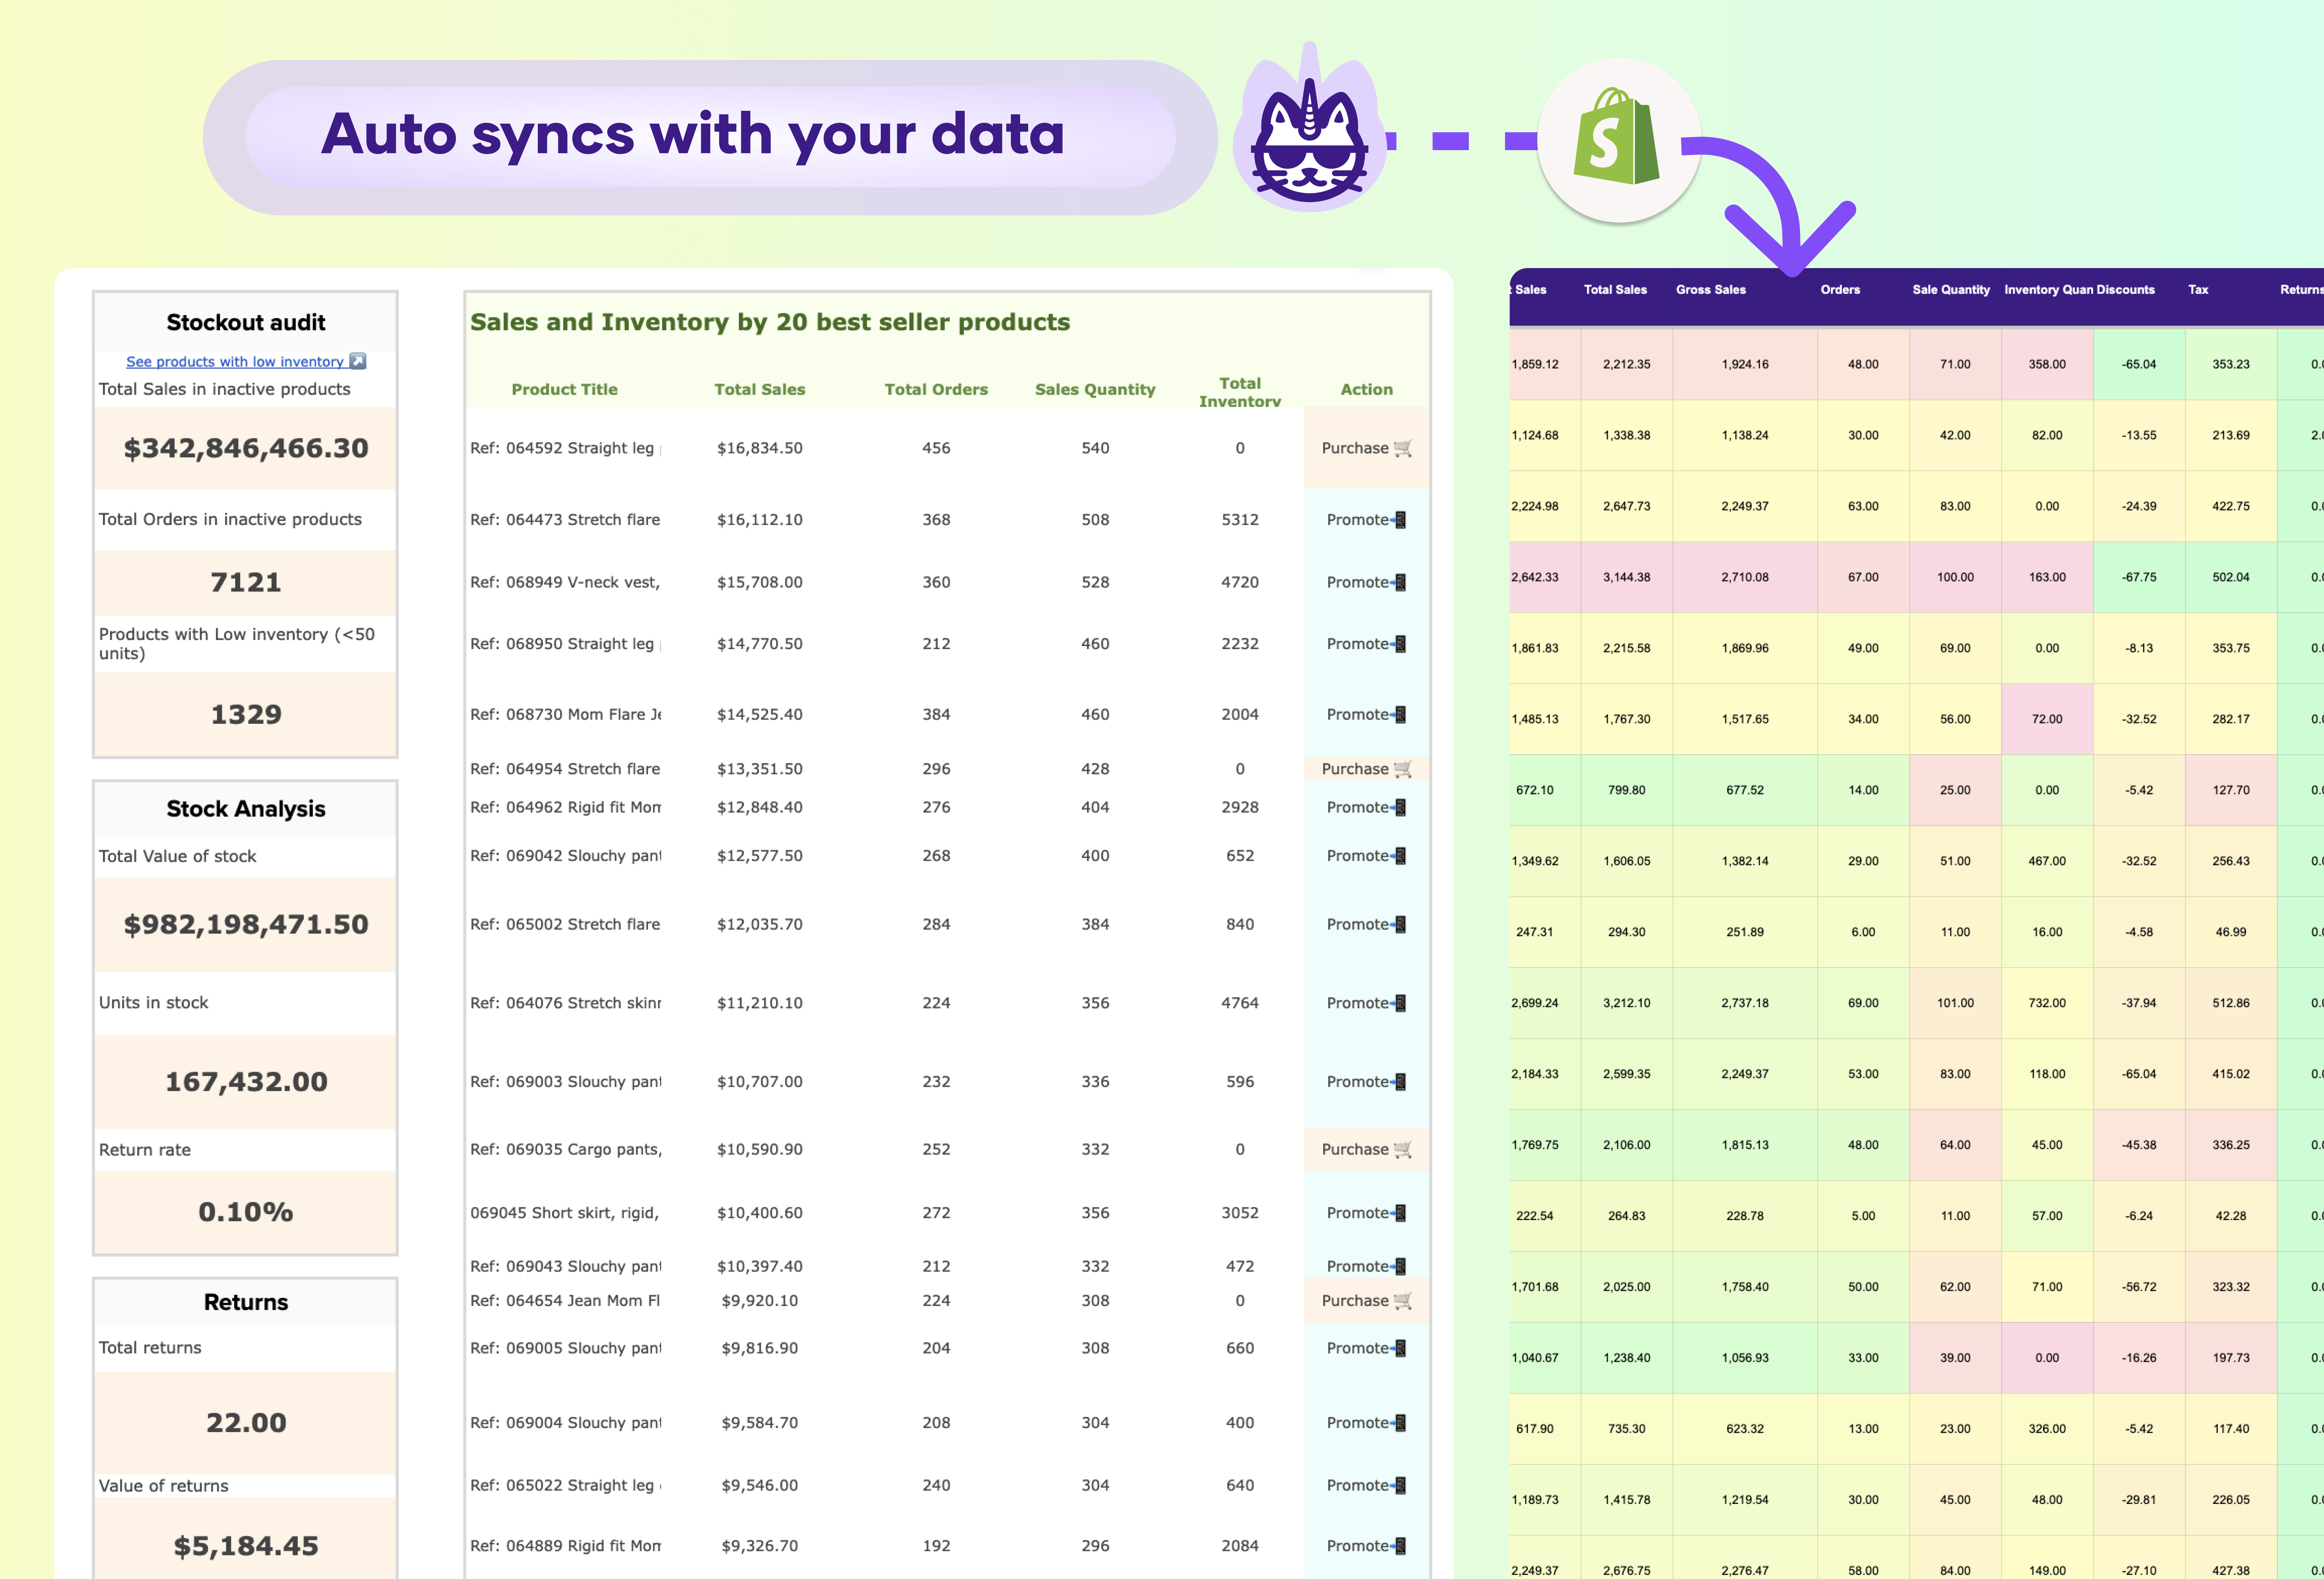
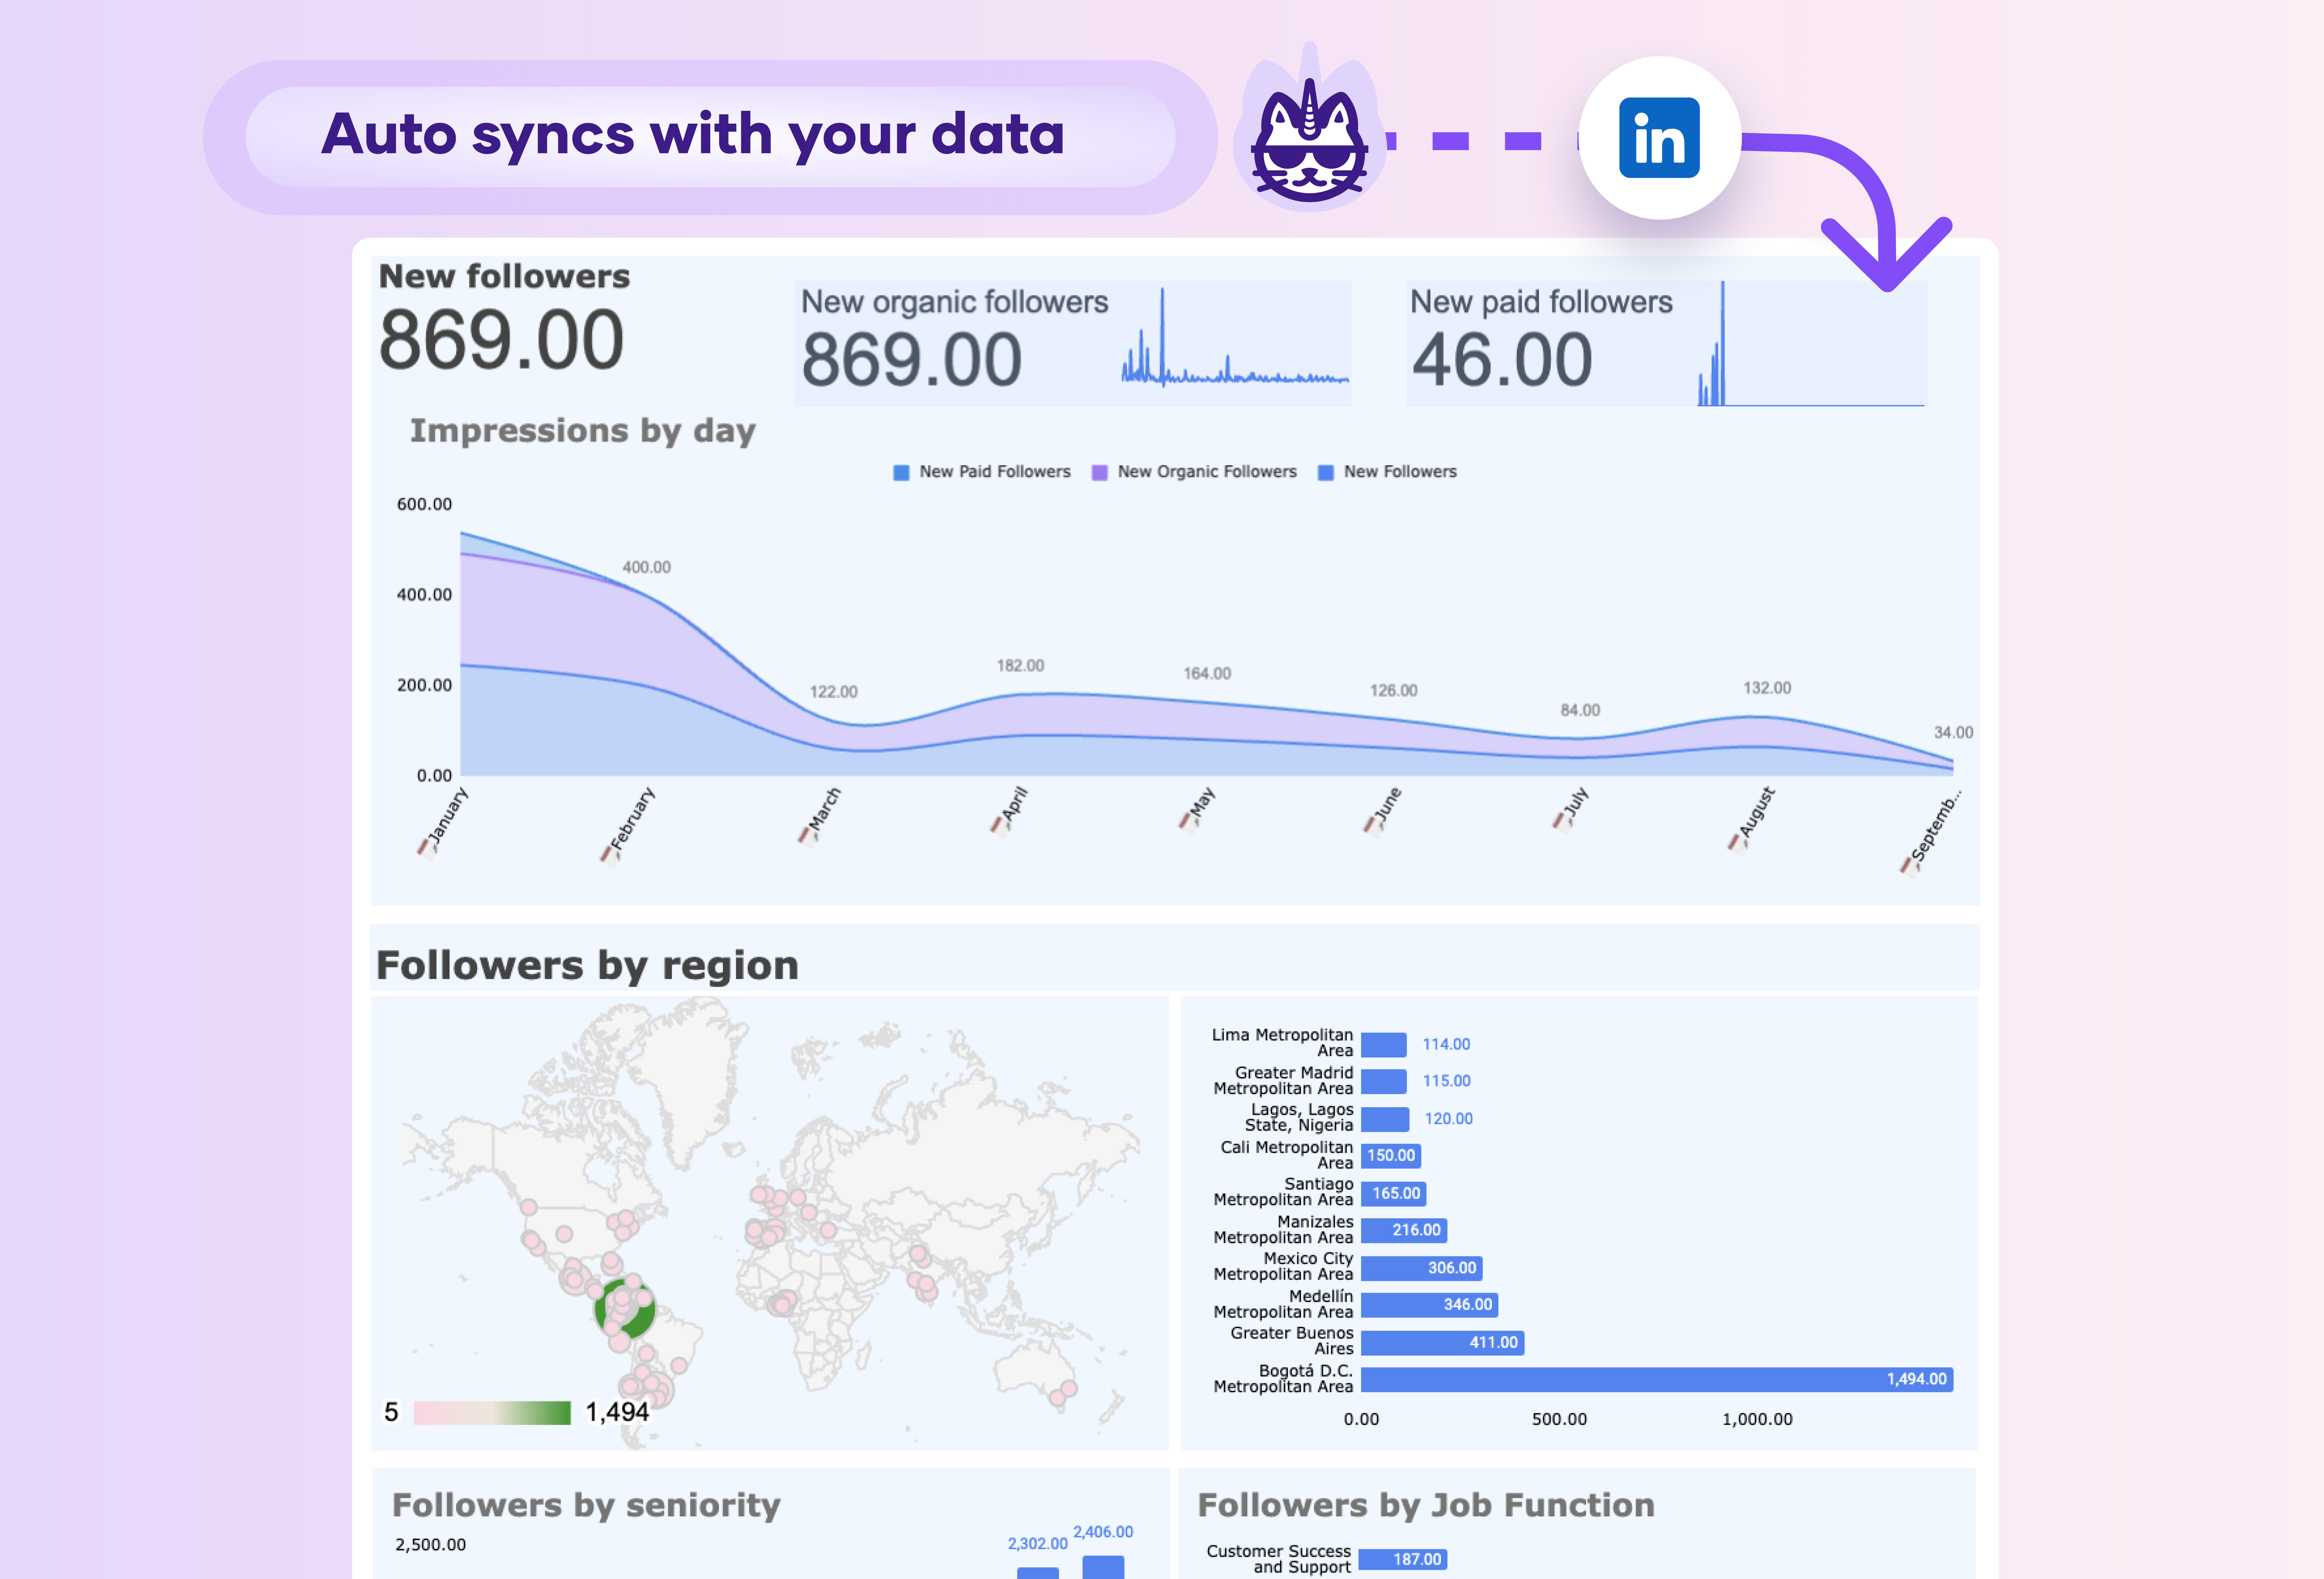
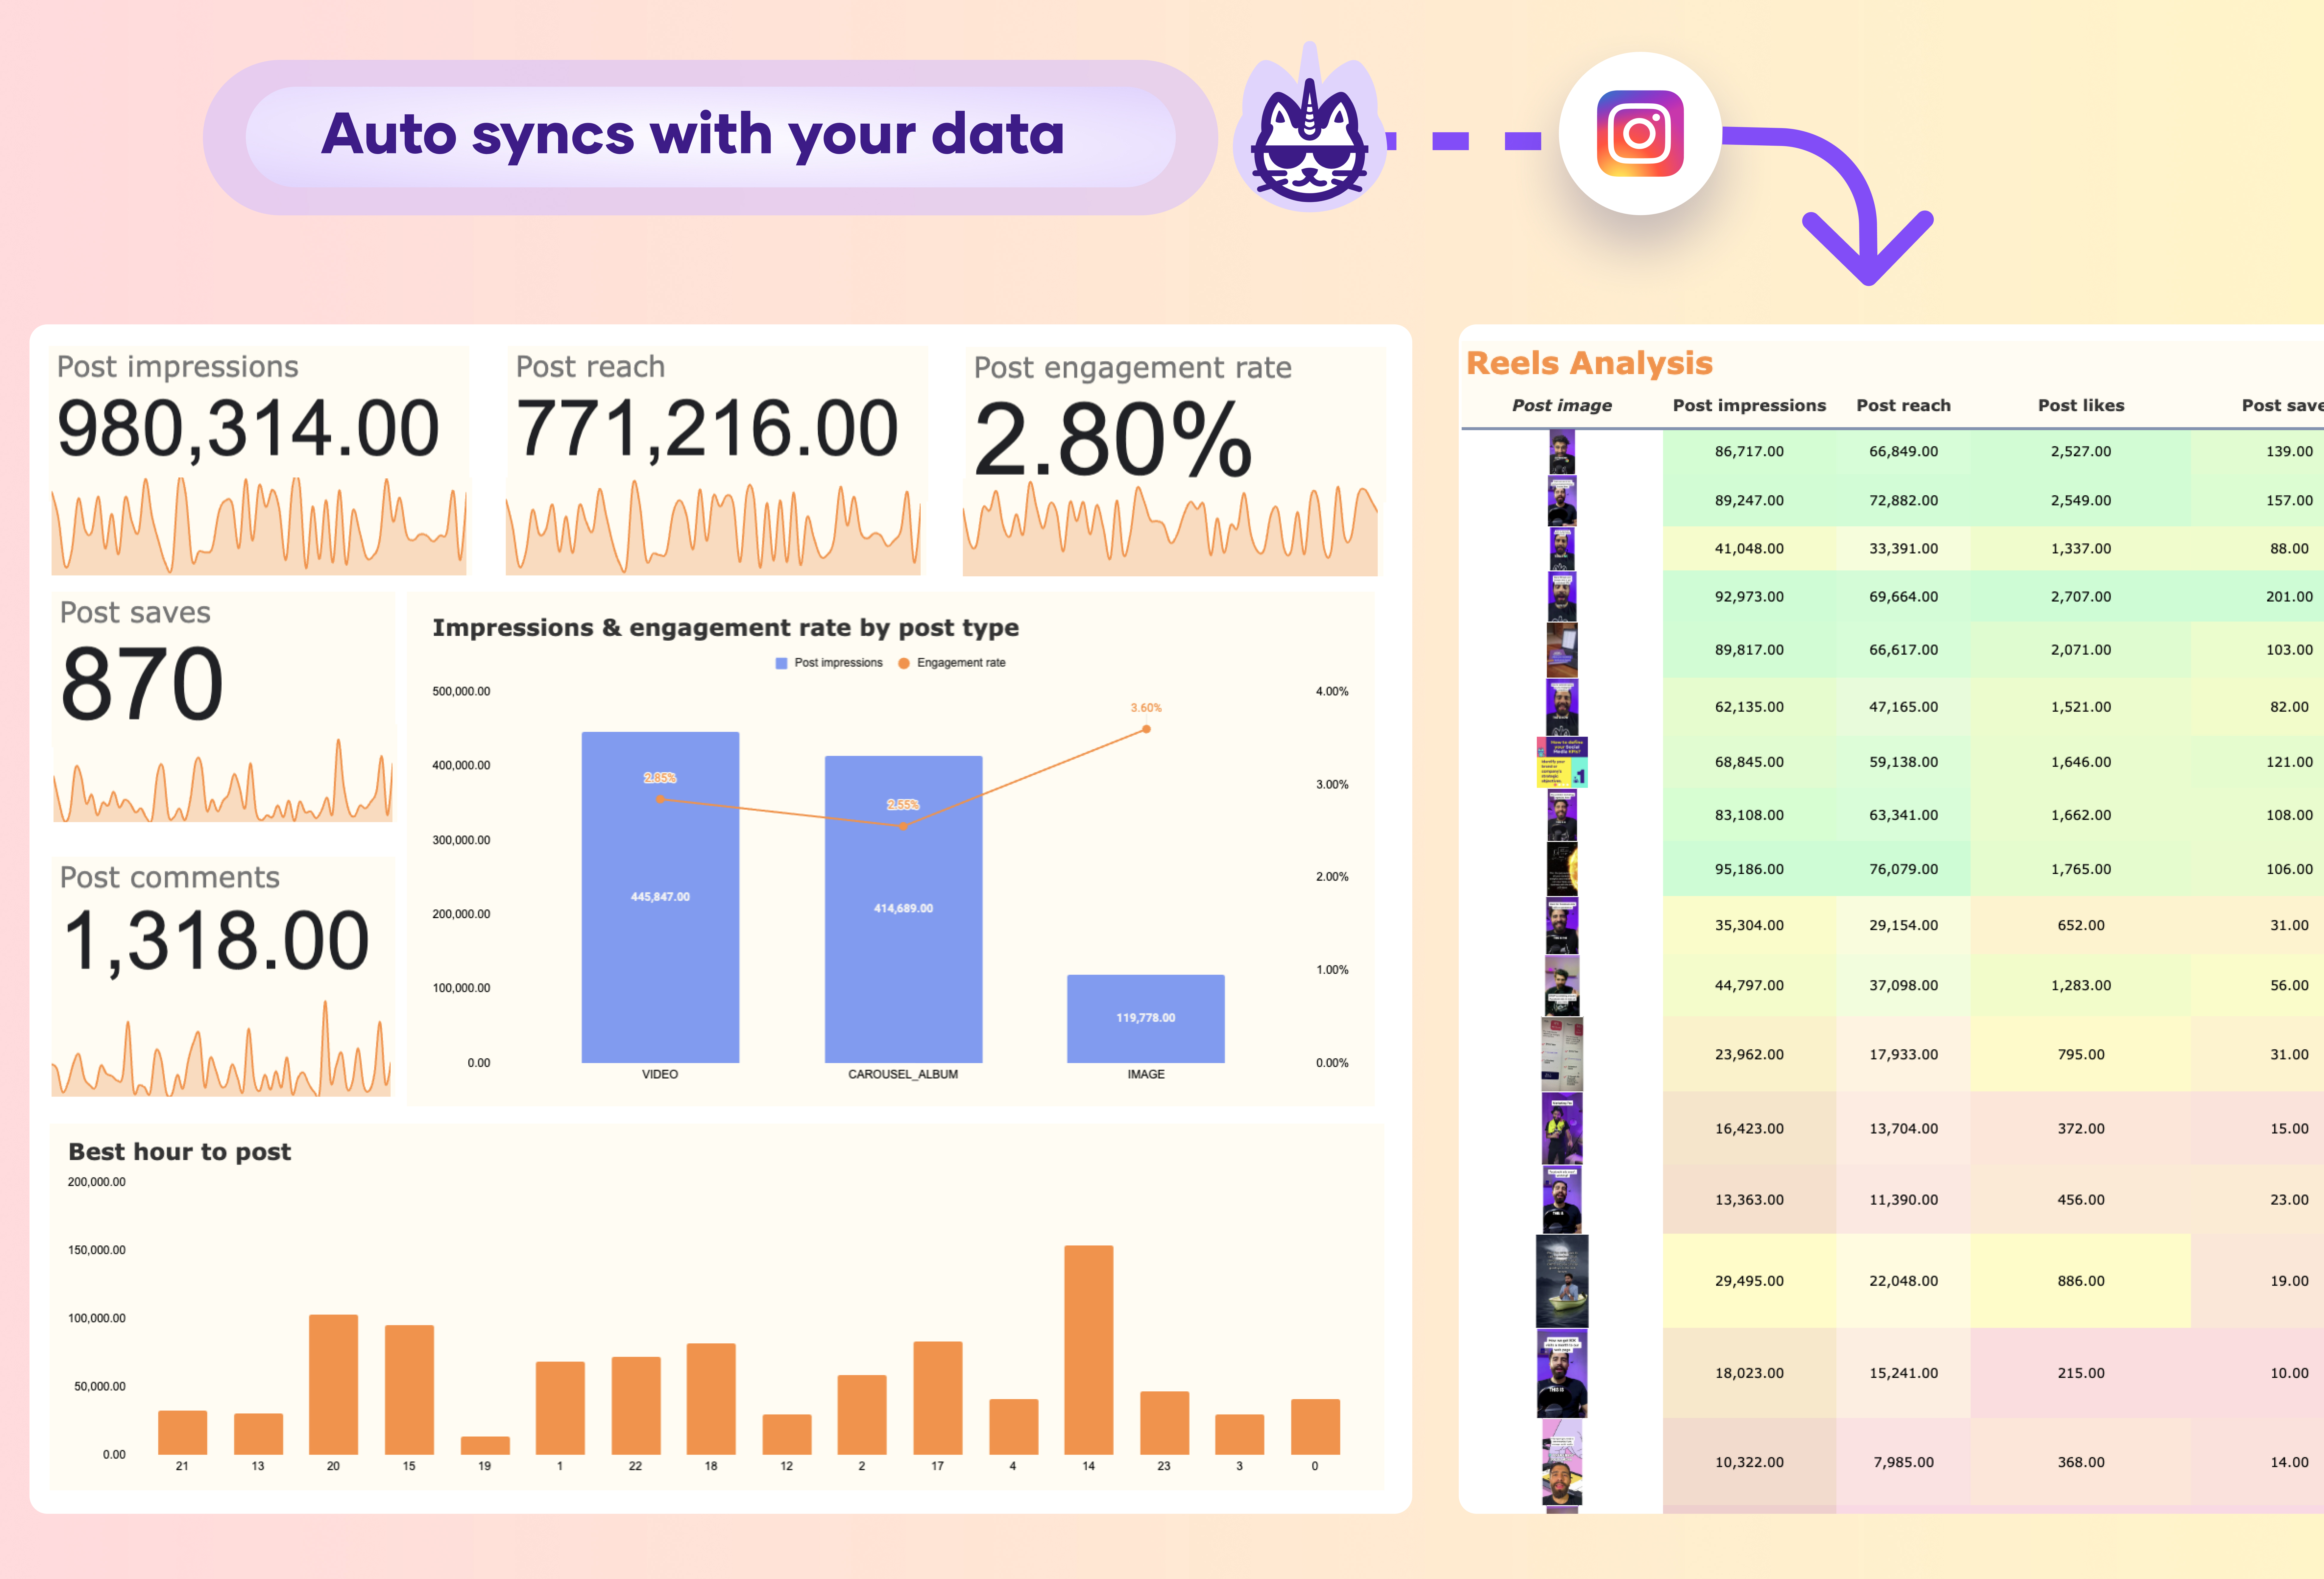
To automate this report, you should consider using a data integration tool that can connect directly to the Facebook Ads API. This will allow for automatic syncing of your Facebook Ads data, ensuring real-time updates and enabling more timely optimizations to your campaigns.
While this template is designed specifically for Facebook Ads, you can use Google Sheets’ multichannel connectors such as LinkedIn Ads, GA4, Shopify to integrate data from other marketing platforms. By combining insights from different sources, you can create a unified view of your overall marketing performance.
To set up email alerts, use the built-in notifications feature in Google Sheets. You can create custom rules to trigger email alerts based on specific conditions, such as when your actual spend exceeds the budget or when pacing percentages hit certain thresholds.
Yes, you can fully customize the charts in the dashboard. You can choose different chart types, adjust colors, fonts, and styles, add data labels, legends, and trendlines, and customize axes and gridlines to match your reporting needs.