A Youtube report should include visibility metrics such as views, impressions, and reach, engagement metrics like likes, comments, and shares, and conversion metrics including click-through rate and conversion rate. Data should be segmented by campaign (e.g., ad campaigns), channel (e.g., specific Youtube channels), audience (e.g., demographics or interests), content (e.g., video titles or categories), objective (e.g., brand awareness or lead generation), and date (e.g., weekly or monthly). For example, an analysis of a specific campaign’s reach within different audience segments or the engagement performance of a particular channel’s videos can be included.
To analyze YouTube data, first choose metrics like visibility (video views, impressions), engagement (likes, comments, shares), and conversion (subscribers, click-through rate). Break down these metrics by visibility, engagement, and conversion to get a comprehensive view. Add context by comparing against cost (cost per view, cost per click), date range (monthly, quarterly), goals (increase views, engagement), rates (view rate, engagement rate), and benchmarks (competitors’ metrics). Segment the data by campaign (ad campaign vs organic), channel (brand vs influencers), audience (age, location), content (video type, length), objective (brand awareness vs lead generation), and date (new vs old videos). For example, compare the engagement rate of influencer campaigns to organic campaigns to assess their effectiveness. Be succinct and focus on the steps as indicated.
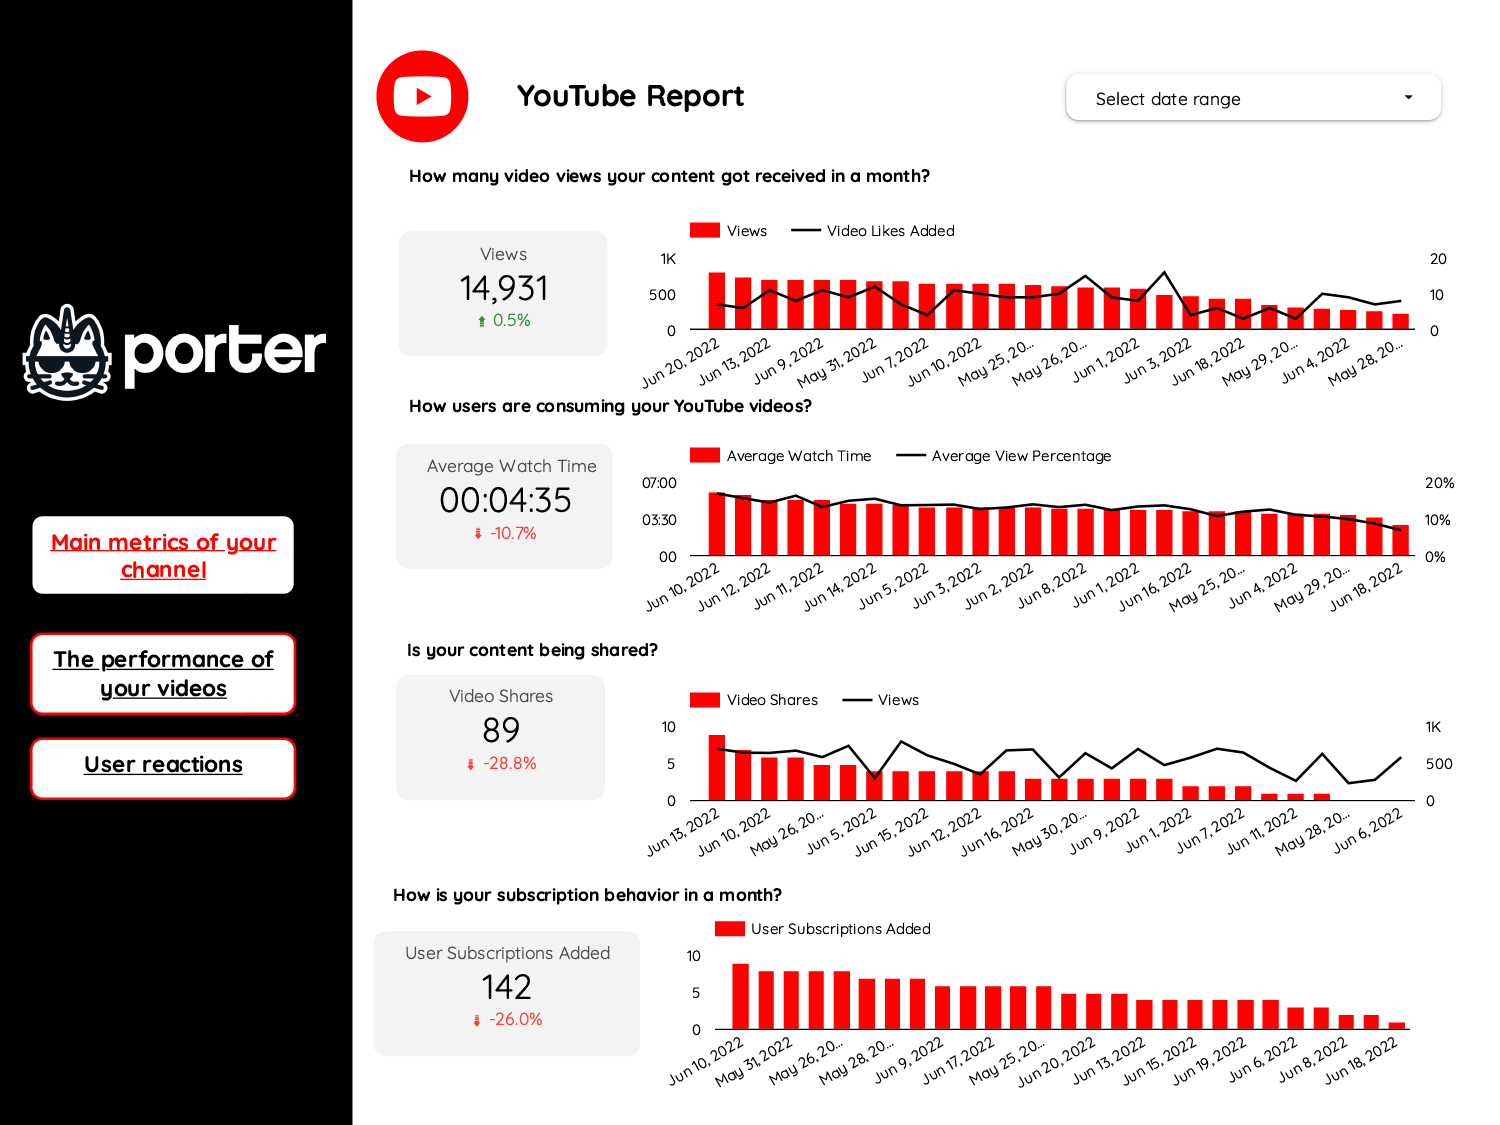
To build a YouTube dashboard, 1) connect your YouTube account and data to your dashboard tool. 2) Select metrics such as views, likes, shares, comments, and watch time to monitor performance. 3) Segment data by campaign, channel, audience, video content, objective, and date. For example, you can break down views by video or audience demographics. 4) Add filters or buttons to make your report interactive, such as a filter for specific time periods. 5) Share your dashboard via PDF, scheduled emails, or links.
A Youtube dashboard is a visual tool that presents key performance indicators (KPIs) related to Youtube marketing efforts. It is significant for businesses as it helps track and analyze the performance of their Youtube content, enabling them to make data-driven decisions. Tools like Looker Studio are commonly used to create such dashboards, which typically include elements like views, watch time, subscriber growth, and engagement metrics. Real-time data monitoring is crucial as it allows businesses to respond quickly to trends or issues. For learning how to create a marketing dashboard using Looker Studio, you can refer to our Youtube channel: https://www.youtube.com/@porter.metrics.


 YouTube
 Impressions
 Views
Views