A TikTok Ads report should include breaking down metrics by visibility, engagement, and conversion metrics. Additionally, segmenting the data by campaign, channel, audience, content, objective, and date is essential. For example, you can analyze the impressions, click-through rates, and video views to understand visibility. Engagement metrics like likes, comments, and shares help assess user engagement. Conversion metrics such as app installs and website visits indicate the effectiveness of the ads. Segmenting data based on different elements provides a comprehensive understanding of the performance and allows for effective optimization strategies.
To analyze TikTok Ads data, include the following in the report:
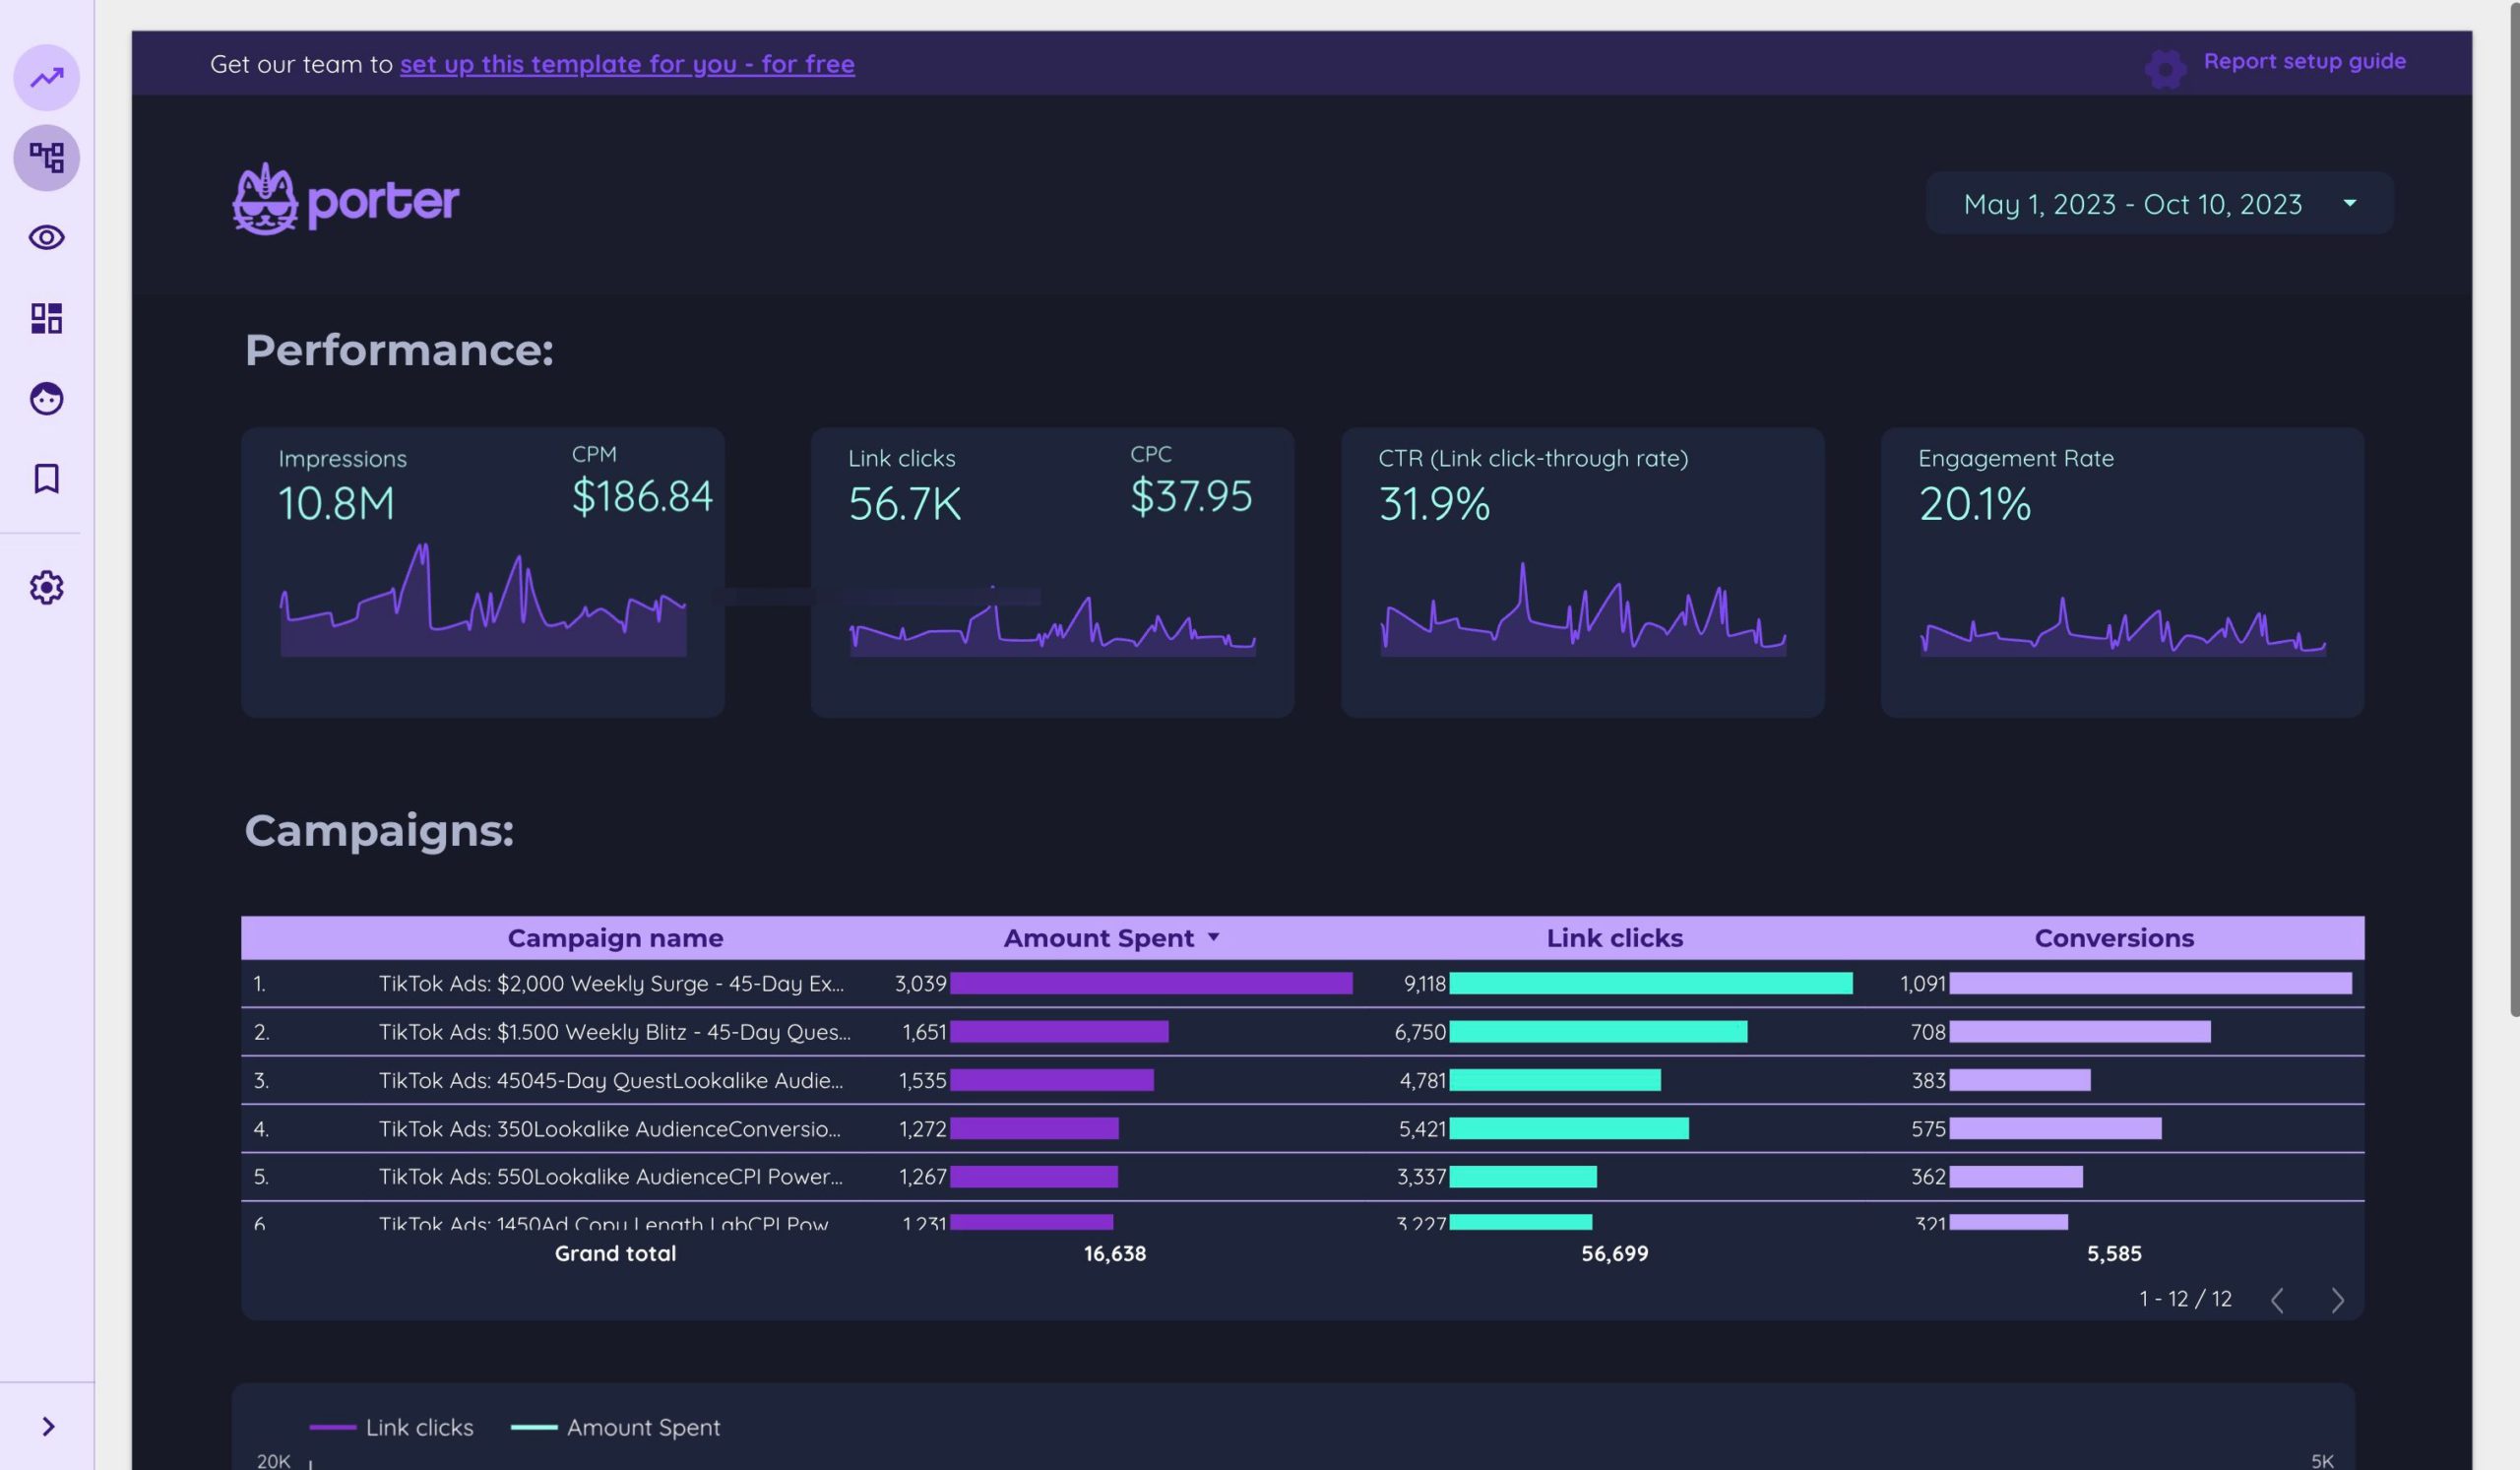
1) Metrics: Break down visibility with metrics like impressions and reach, engagement with metrics like likes and shares, and conversion with metrics like click-through rates and conversions.
2) Context: Compare with cost metrics, date range performance, campaign goals, and benchmark rates. For example, measure cost per conversion, performance against previous time periods, or compare reach against industry benchmarks.
3) Data segmentation: Analyze data by campaign, channel, audience, content, objective, and date. For instance, compare engagement rates across different campaigns, evaluate the performance of specific content or target audience, or analyze conversion rates by objective. Use these steps to create a comprehensive TikTok Ads report.
To build a TikTok Ads dashboard, 1) connect your TikTok Ads account and data sources. 2) Choose metrics such as impressions, clicks, and conversions to monitor performance. 3) Segment data by campaign, channel, audience, product, customer content, objective, and date for detailed insights. 4) Incorporate filters or buttons for interactivity, such as filtering by ad spend or date range. 5) Share your dashboard via PDF, scheduled emails, or links for easy access and review.
A TikTok Ads dashboard is a visual tool that consolidates and displays the performance metrics of TikTok advertising campaigns, helping businesses to track their progress and make data-driven decisions. It is significant as it provides real-time data monitoring, which is crucial for timely adjustments and optimization of marketing strategies. Common tools used to create such a dashboard include Looker Studio, and key elements typically included are impressions, click-through rates, engagement rates, and conversion rates. For a comprehensive guide on creating a marketing dashboard using Looker Studio, visit our YouTube channel: https://www.youtube.com/@porter.metrics.


 TikTok Ads
 Impressions