A post analysis report should include metrics broken down by visibility, engagement, and conversion metrics. The data should be segmented by campaign, channel, audience, content, objective, and date. For example, include metrics like impressions, reach, likes, shares, comments, click-through rate, conversion rate, etc.
To analyze social media post data, the following steps can be followed:
1) Choose metrics and break them down by visibility (reach, impressions), engagement (likes, comments, shares), and conversion (click-through rate, conversion rate) metrics.
2) Add context by comparing the metrics against the cost (cost per click, cost per conversion), date range (week over week or month over month performance), goals (e.g., increasing reach or conversion), rates (engagement rate, conversion rate), and benchmarks (industry standards or previous performance).
3) Segment the data by campaign (e.g., holiday campaign), channel (Facebook, Twitter), audience (age group, location), content type (images, videos), objective (awareness, lead generation), and date (daily or hourly analysis).
Example: The reach metric for a Facebook post increased by 20% compared to the previous week, with a corresponding increase in engagement rate of 15%. However, the conversion rate remains lower than the industry benchmark, indicating a need to optimize the post’s call-to-action.
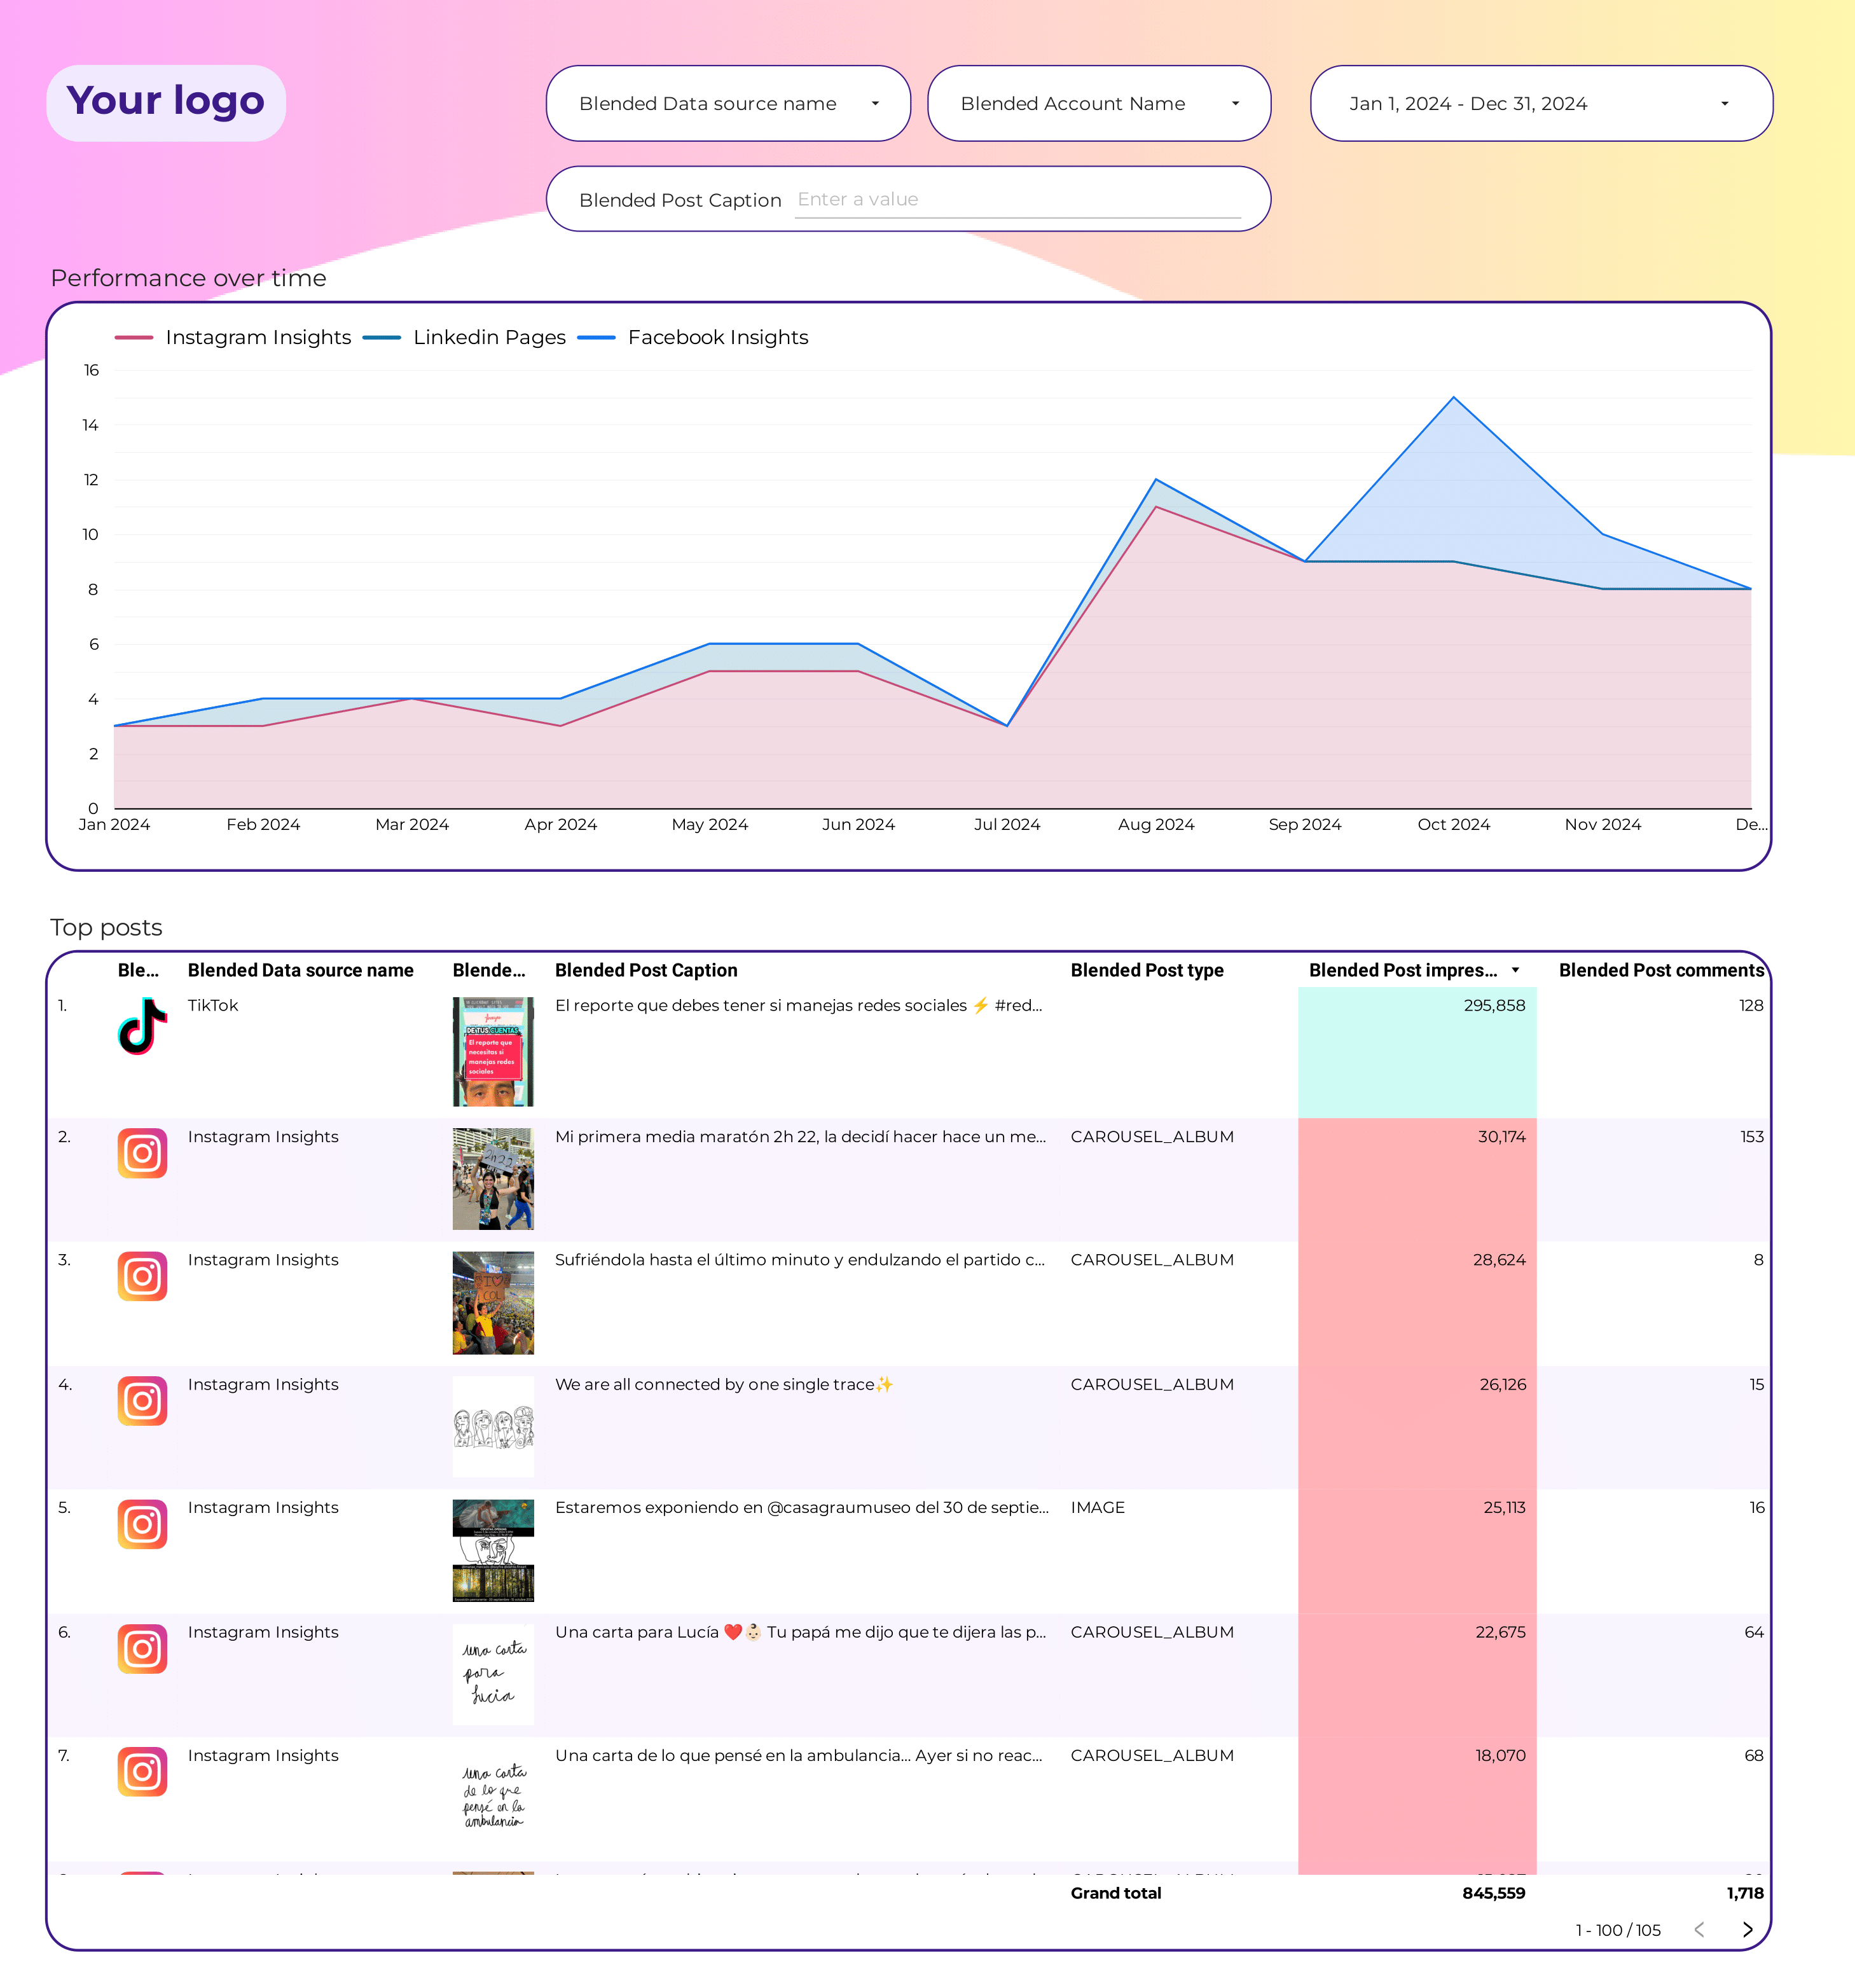
To build a post-analysis dashboard, 1) connect your data and accounts, such as Google Analytics, social media platforms, and CRM systems. 2) Select the metrics to monitor performance, like engagement rate, click-through rate, or conversion rate. 3) Segment or break down data by campaign, channel, audience, product, customer content, objective, date, for example, comparing the performance of a Facebook campaign targeting millennials versus one targeting baby boomers. 4) Add filters or buttons to make your report interactive, such as a date range filter or a product category filter. 5) Share your dashboard via PDF, scheduled emails, or links to relevant stakeholders.
A post-analysis dashboard is a visual representation tool that displays key business metrics, data, and analytics to monitor performance and guide decision-making. It is significant for businesses as it provides insights into past performance, helping to inform future strategies. Common tools used to create such a dashboard include Looker Studio, Tableau, and Power BI, with key elements including data visualizations, KPI tracking, and trend analysis. Real-time data monitoring is crucial as it allows businesses to respond quickly to changes. For a detailed guide on creating a marketing dashboard using Looker Studio, visit our YouTube channel: https://www.youtube.com/@porter.metrics.
 Instagram Insights
 Facebook Insights
 LinkedIn Pages
 Google Business Profile
 Pinterest
 TikTok
 Impressions

