A/B testing report template for Looker Studio

Get the actual A/B testing report template used by Porter to monitor your Email marketing performance.

Creator

Porter

This template is built by the same marketers behind all our tutorials, support, and our template gallery.

+40,000 marketers have downloaded our dashboards

Template setup

Copy-paste the same dashboards that other teams and agencies use to monitor their Email marketing performance

A/B testing report template overview

With this A/B testing Looker Studio template, monitor specific metrics such as click-through rates, conversion rates, and bounce rates. For example, segment the data by different user demographics to analyze performance among different age groups or geographic locations.

Suggest that users share the findings via PDF, link, or email to influence teams or clients. For instance, create a PDF report highlighting the impact of different A/B test variations on user engagement and conversion rates.

Suggest examples of questions users could answer with the data, such as identifying which A/B test variation resulted in the highest user retention or determining the impact of a specific change on overall conversion rates.

Metrics and dimensions included

Customize the template’s metrics and dimensions as you like. See all available fields.

Metrics

Conversion metrics

– Conversion rate
– Cost per acquisition
– Return on investment

Engagement metrics

– Click-through rate
– Conversion rate
– Bounce rate

Visibility metrics

– Impressions
– Click-through rate
– Website traffic

Dimensions

Campaign

– Target audience
– Campaign message
– Conversion rate

Audience

– Demographics
– Psychographics
– Geographics

Time

By hour, day, week, month, quarter, or year

Features

100% custom charts

White-label

Custom metrics​

All-time historical data

Schedule email alerts​

Filters

Interactive

Goals​

Data blending

FAQs

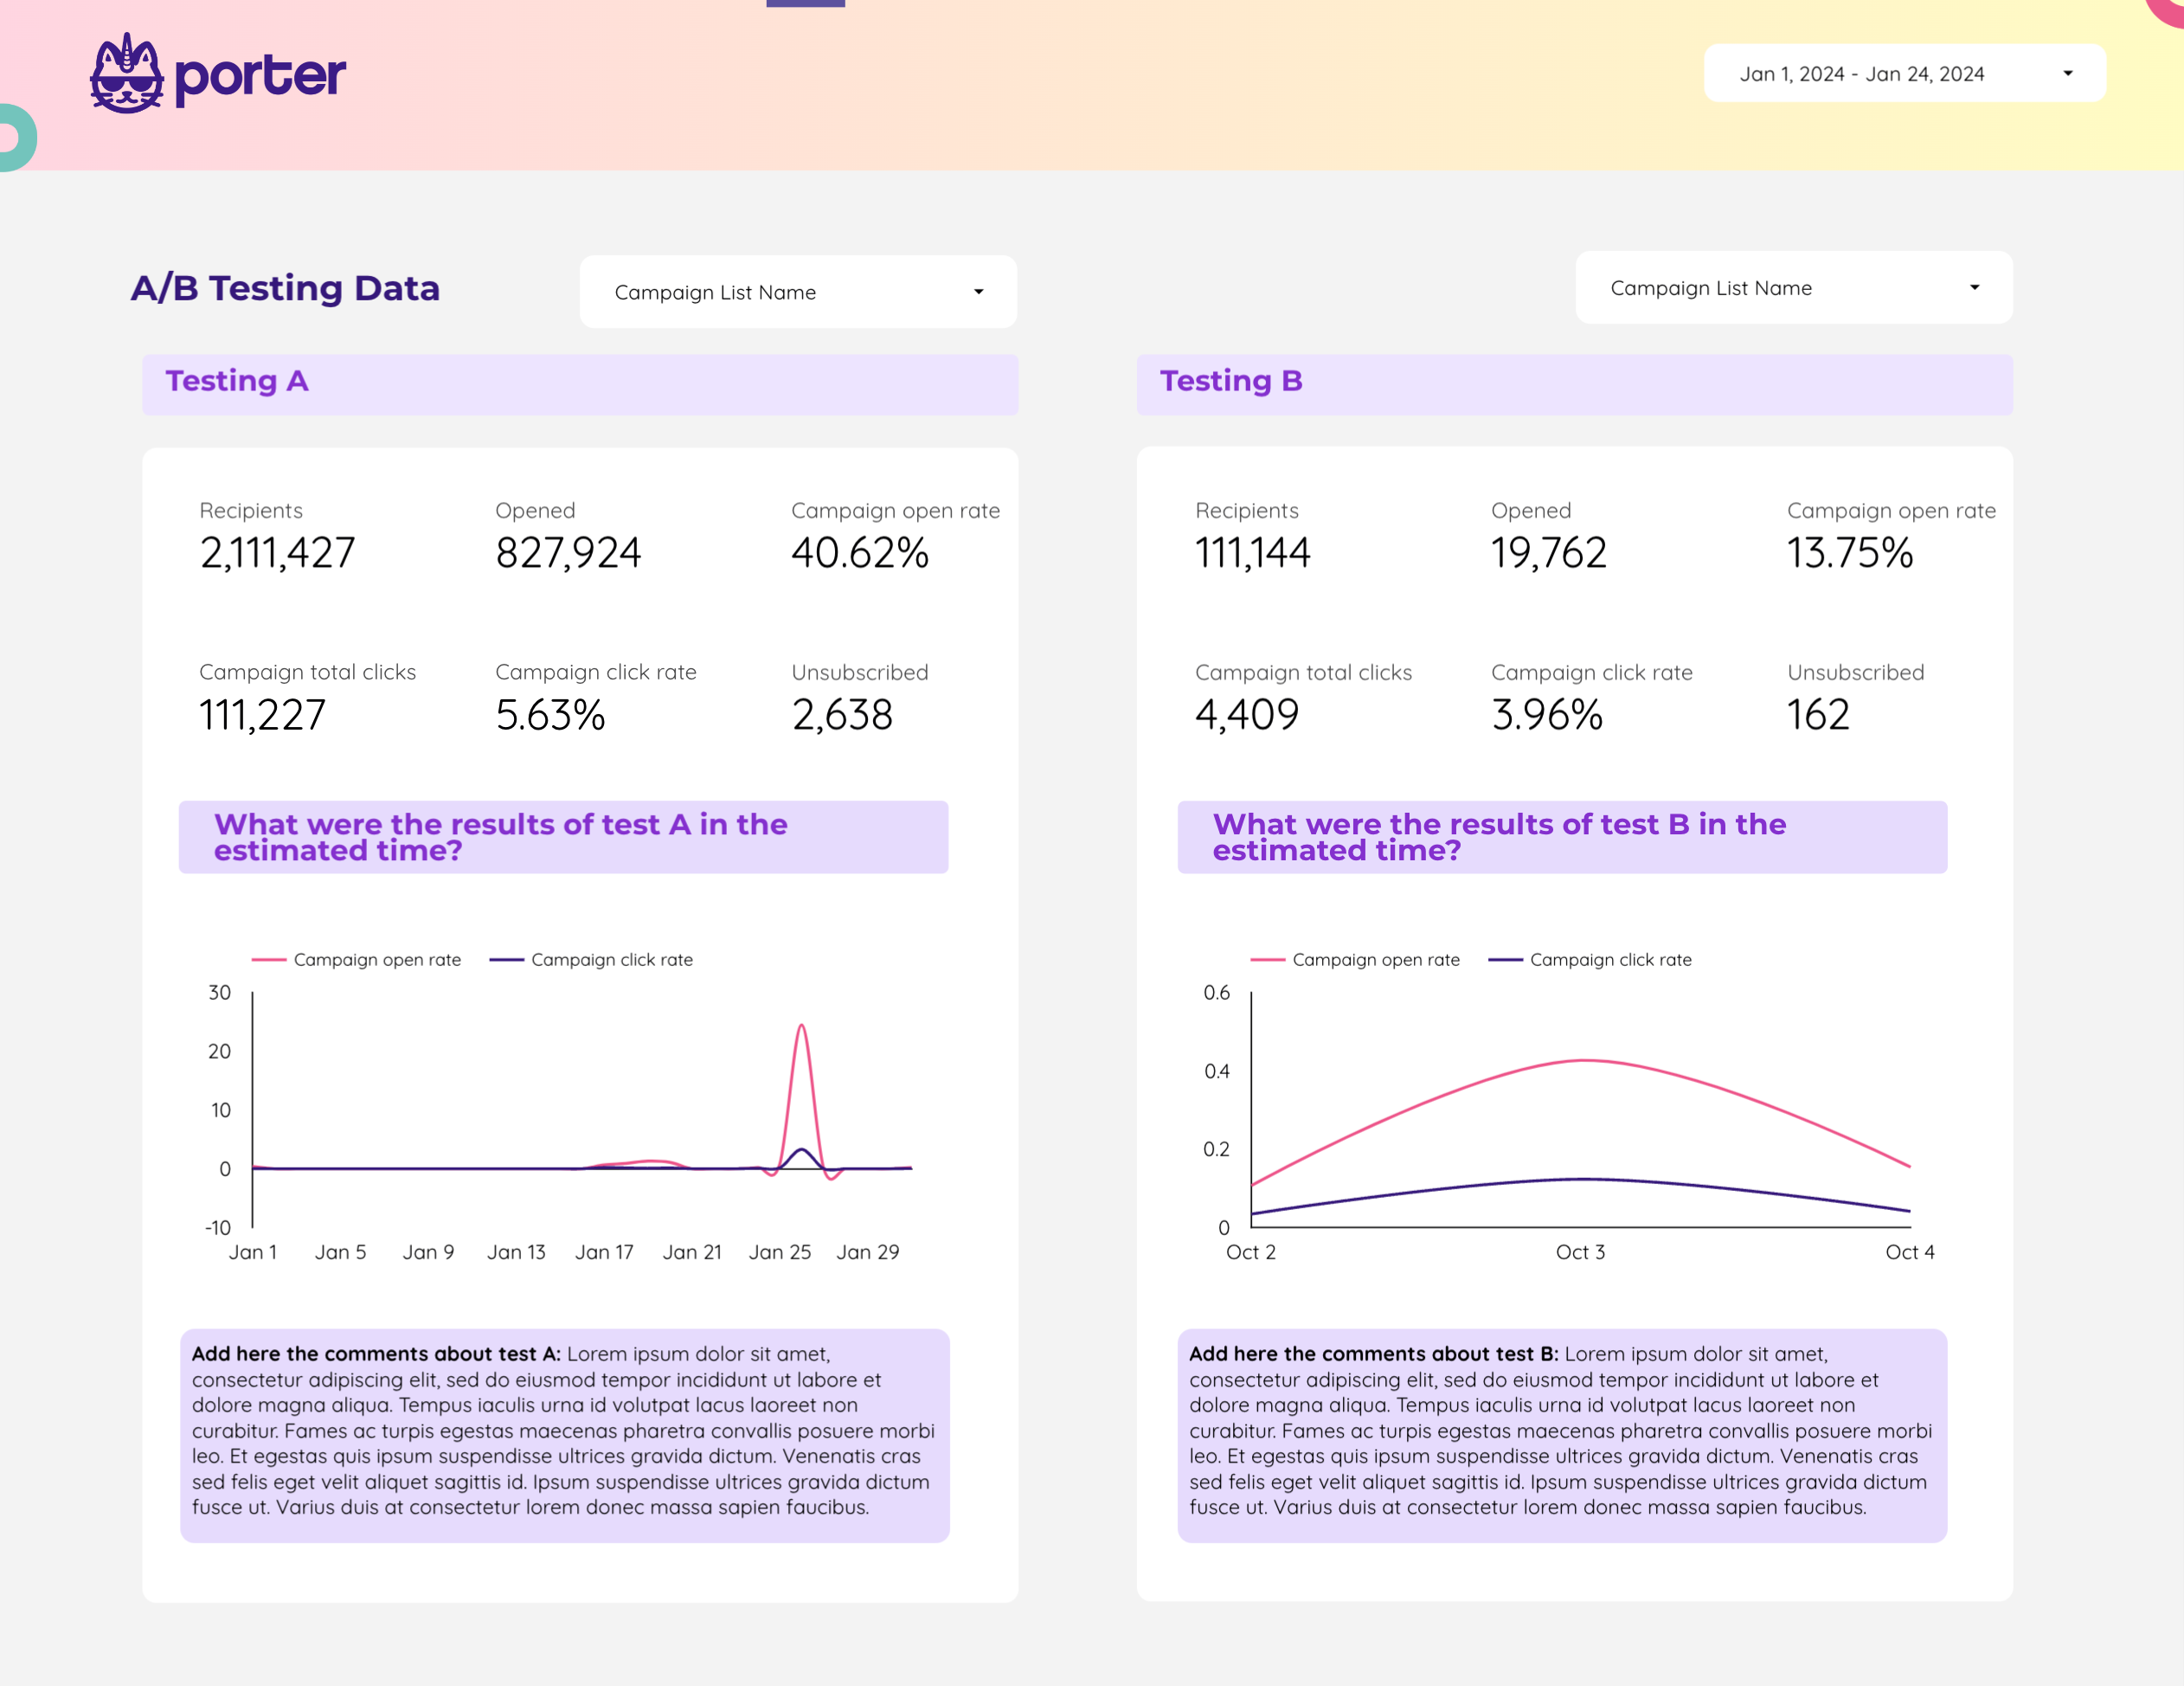
A A/B testing report should include visibility metrics such as impressions, engagement metrics like click-through rates, and conversion metrics such as conversion rates. Data should be segmented by campaign, channel, audience, content, objective, and date. For example, comparing the conversion rate of two different ad creatives within a specific target audience and campaign.
To analyze A/B testing data, 1) choose visibility, engagement, and conversion metrics (e.g. page views, click-through rates, conversion rates). 2) Add context by comparing vs cost, date range, goals, rates, benchmarks (e.g. cost per click, conversion rate benchmark). 3) Segment data by campaign, channel, audience, content, objective, date (e.g. compare conversion rates by channel, engagement by audience, visibility by campaign).
To build an A/B testing dashboard, 1) connect your data and accounts from your testing platform, such as Google Optimize or Optimizely. 2) Select the metrics to monitor performance, such as conversion rates, bounce rates, or session duration. 3) Segment or break down data by campaign, channel, audience, product, customer content, objective, date. For example, you might want to compare performance between two different email campaigns. 4) Add filters or buttons to make your report interactive, such as a date range filter or a button to switch between different test variations. 5) Share your dashboard via PDF, scheduled emails, or links to keep your team updated on the test results.

An A/B testing dashboard is a visual representation tool that allows businesses to compare two or more variants to determine which performs better. It is significant for businesses as it aids in decision-making, improving user experience, and increasing conversion rates. Tools like Looker Studio are commonly used to create these dashboards, which typically include key elements like test hypothesis, test duration, conversion rates, and statistical significance. Real-time data monitoring is crucial in A/B testing dashboards to make timely and accurate decisions. For learning how to create a marketing dashboard using Looker Studio, visit our YouTube channel: https://www.youtube.com/@porter.metrics.

Yes, Looker Studio allows you to download your report as a PDF. To do it, follow these steps:

Before downloading your report choose the date range you want to visualize on your report.
Click on the “File” menu at the top left corner of the screen.

Select “Download as” from the drop-down menu and choose “PDF.”

You can choose which pages you want to download, and also you can add a password to protect the report and add a link back to the online report.

Click on “Download” to save the report on your device.