SEM Reporting Tool

Write breath-taking reports with our SEM reporting tool without errors in 90 seconds.

arrow-purpple-0
All your data in one place
Get our team to make your reports.

Honestly, Is There a Better Way To Create SEM Reports?

How do you create a SEM report without having to spend hours on a spreadsheet when all you have is Google Analytics and Google Search Console?


Google Analytics and Google Search Console don’t provide report templates to help you analyze your SEM efforts.

SEM reports should be easy.

Porter metrics, a no-code reporting solution, gives you a detailed, visual, SEM report in less than 5 minutes without taking screenshots or having to deal with raw data on spreadsheets.

Create beautiful SEM reports with no code or analysts required

Are spreadsheets a nightmare?

Sometimes creating visual reports on Excel can be challenging especially if you aren’t an expert.


❌ You end up using alternatives like Microsoft words, PowerPoint.

❌ Creating reports on these alternatives takes an unbelievable amount of time

❌ This is keeping you from creating SEM reports that allows you analyze your SEM campaign strategies.

Porter metrics provides 80+ templates which can easily be customized to suit your taste.

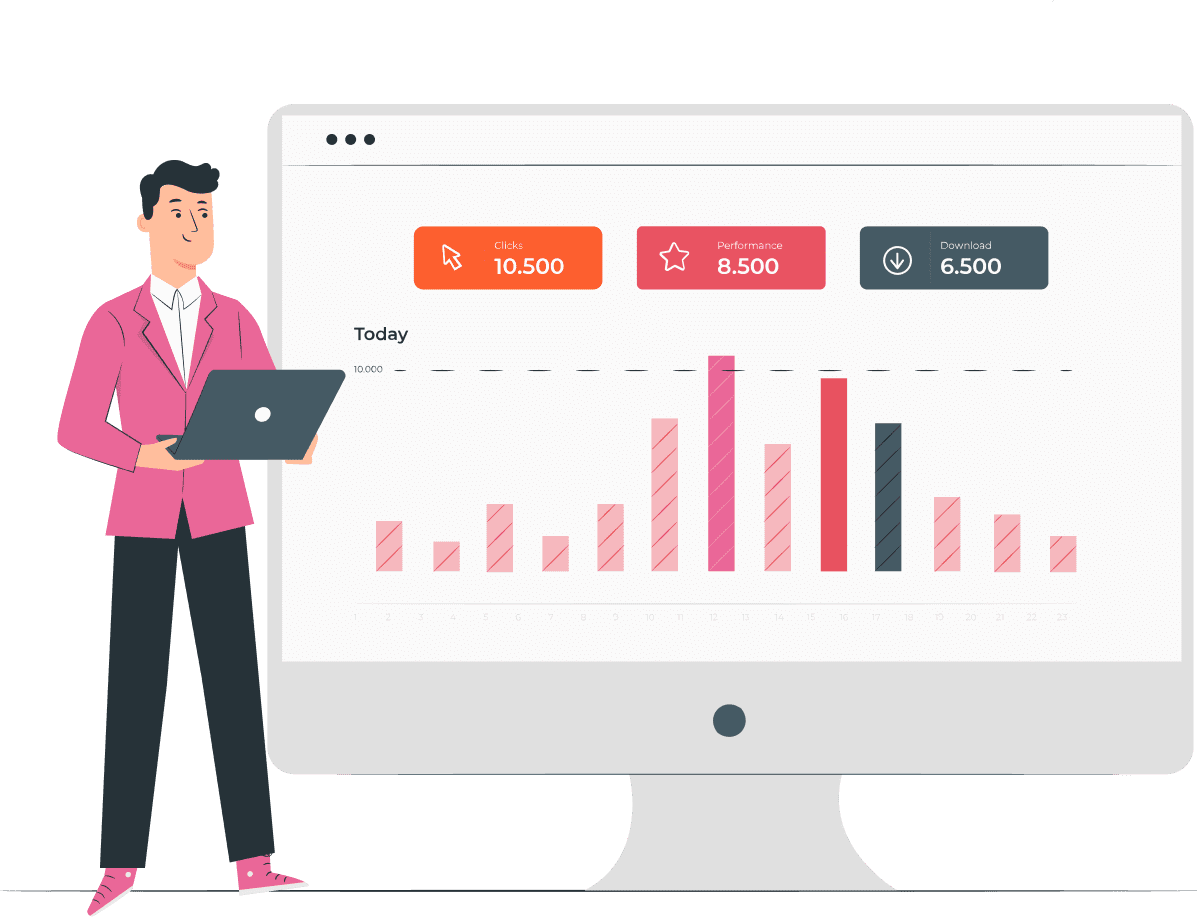
Can’t easily track your metrics?

Google analytics and Google search console are technical tools, hence, tracking KPIs can be a challenge.

❌ You can’t easily track your KPIs

❌ This stops you from making strategic decisions to improve your SEM efforts

❌ This is keeping you from impressing your clients or managers


With over 600+ custom metrics, Porter metrics provides actionable insights into your SEM strategy.

Here’s How to Automate your SEM Reports In 90 seconds

Keep up with all the data you need to analyze your day-to-day SEM activities with a visual SEM report.

 Build custom SEM dashboards and monitor your SEM campaigns with Porter metrics in tools you use.

That way, you

Experience seamless integrations. Get started in no time.

Check how it works in 1 min

Step #1

Securely Connect your data

We connect your SEM account—along with all your marketing data—so you can get it all in one place.

Step #2

Use our 80+ report templates

Once data is connected, you’ll load our default report templates so you don’t need to do it yourself or learn anything.

Step #3

Create custom widgets and charts

Step #3

Create custom widgets and charts

Leverage Google Data Studio’s dashboarding capabilities with dozens of chart types like.

Step #4

Visualize all your metrics and KPIs

+600 metrics and dimensions to analyze your SEM report data as needed.

Step #5

Create Interactive reports

Use filters, buttons, and date range widgets to analyze your data how you need.

Step #6

Leverage white-label SEM reports

+600 metrics and dimensions to analyze your SEM report data as needed.

Acces:

Step #7

Share your reports

Choose how you want others to access your SEM reports.

+1520 companies and agencies are fully automating their SEM Reports now

Here’s Why Our Clients Use Porter