Scale your team’s performance with real-time insightful reporting Here’s how you can get started in 1 minute
Marketing Agencies prefer Porter metrics because it lets you identify and track key performance data without:
Step #1
We connect your OKR account—along with all your marketing data—so you can get it all in one place.
Step #2
Once data is connected, you’ll load our default report templates so you don’t need to do it yourself or learn anything.
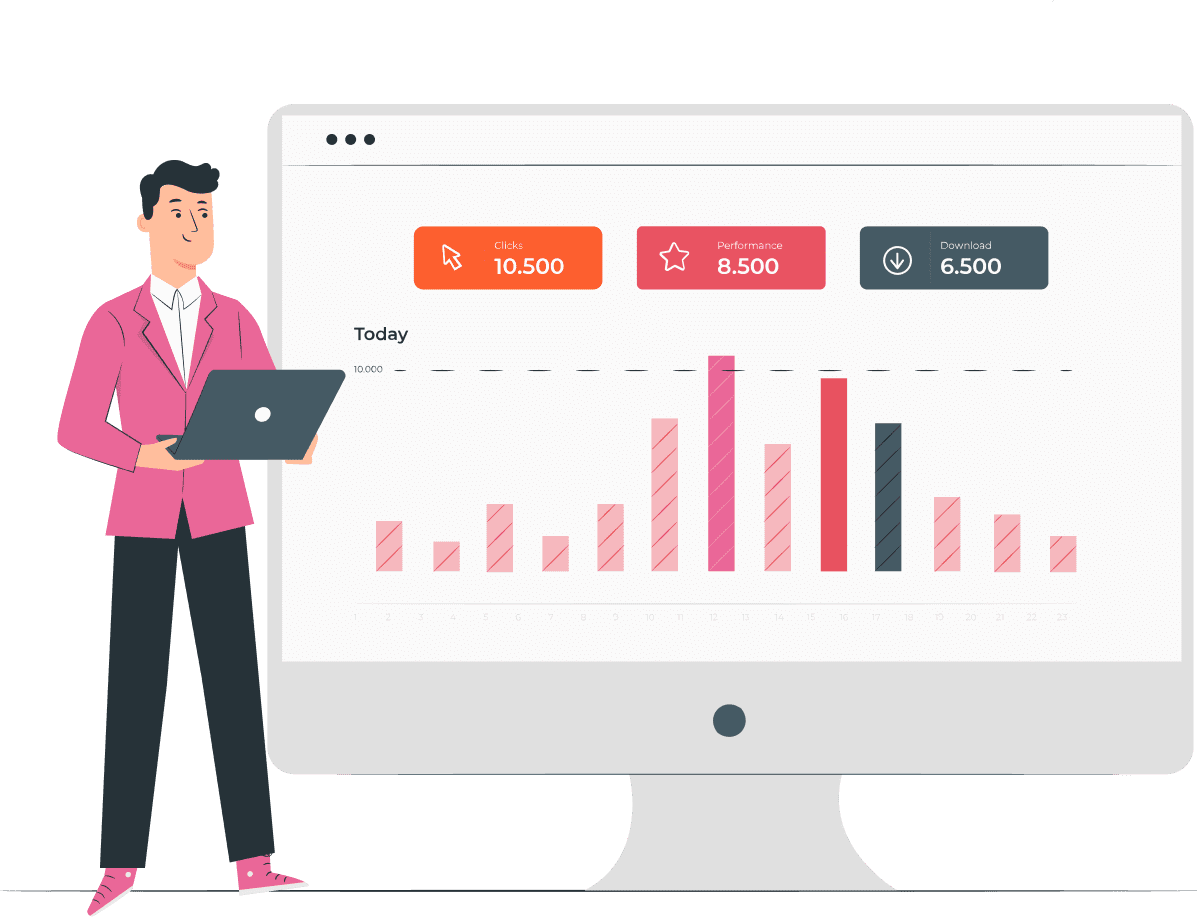
Step #3
Leverage Google Data Studio’s dashboarding capabilities with dozens of chart types like.
Step #4
600+ metrics and dimensions to analyze your OKR data as needed.
Step #5
Use filters, buttons, and date range widgets to analyze your data how you need.
Step #6
Access:
Step #7
Choose how you want others to access your OKR reports.