Multi-channel Reporting Tool
Harvest Compact Business Insights from Our Multi-Channel Reporting Tool for Free.
Harvest Compact Business Insights from Our Multi-Channel Reporting Tool for Free.


Portermetrics – a no-code solution allows you
Without a creative way to visualize data across all your marketing channels, you end up:


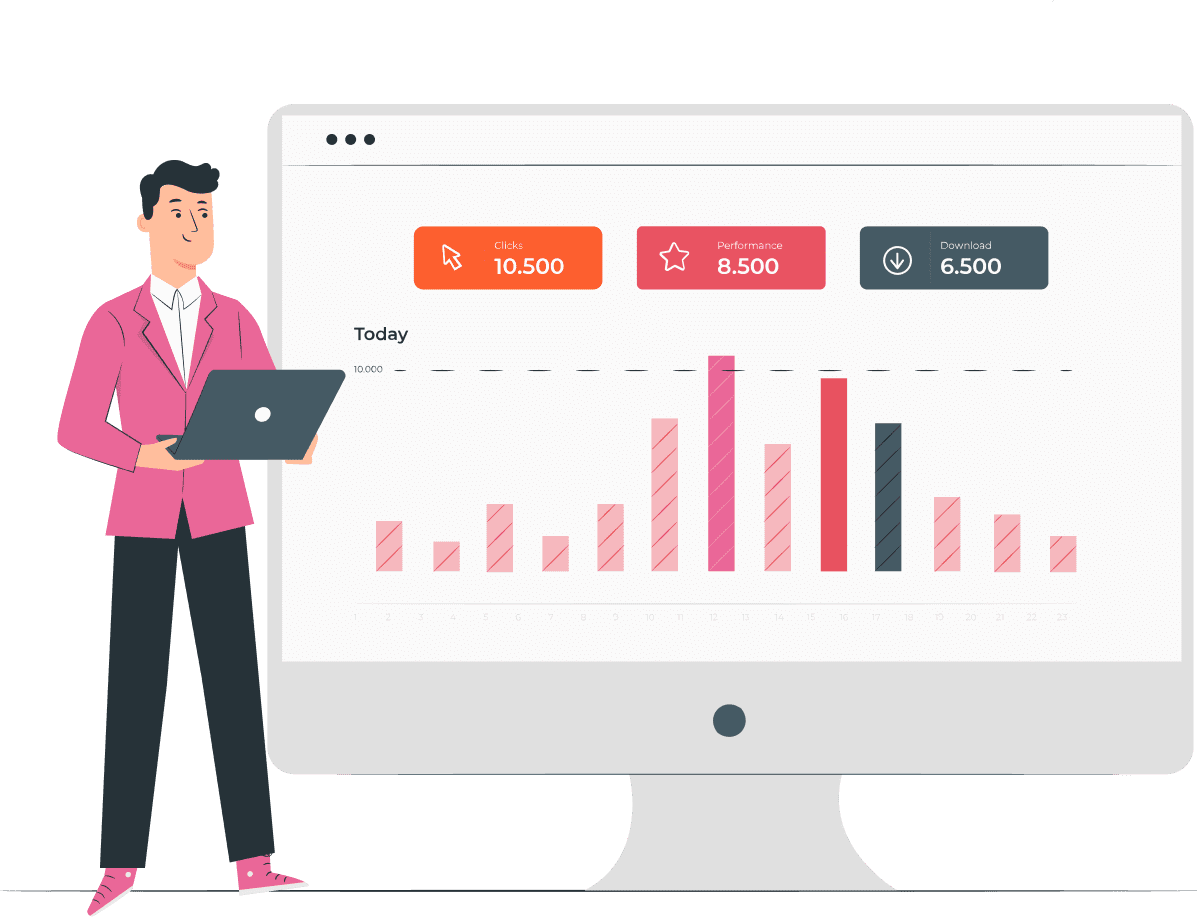
Porter metrics interactive dashboard gives you access to all of your data filtered, indexed and visually presented.
Unlike other solutions where
❌ Data is cluttered in rows and columns
❌ You have to carefully filter data to get updated stats
❌ You spend a great deal of time making sense of the data
We’ve made it easy for you

Linking ad spends to results or lifetime value can be difficult using most multi-channel reporting tools.
In most cases
❌ Conversions tracking is incorrect
❌ Attribution models do not track customer lifetime value
❌ You can’t see how your multi-channels campaigns are performing and how you can improve them
Porter metrics Multi-Channel Reporting Tool is designed to ensure your attribution makes sense.
That way you make intelligent business decisions to grow your company based on data.


All marketing clicks across your marketing channels can be tracked in the tools you’re already using.
That way, you don’t need to learn another tool or hire the services of a developer.
Multi-channel reports are simplified, visualized, quickly understood and presented with Porter metrics in all the formats and patterns you’ll need.


Step #1
We connect your multi-channel account—along with all your marketing data—so you can get it all in one place.

Step #2
Once data is connected, you’ll load our default report templates so you don’t need to do it yourself or learn anything.


Step #3
Leverage Google Data Studio’s dashboarding capabilities with dozens of chart types like.

Step #4
+600 metrics and dimensions to analyze your multi-channel report data as needed.


Step #5
Use filters, buttons, and date range widgets to analyze your data how you need.
Step #6
600+ metrics and dimensions to analyze your competitors analytics data as needed.
Access:


Step #7
Choose how you want others to access your multi-channel reports.


