An Active Campaign report should include metrics for visibility (e.g., impressions, reach), engagement (e.g., clicks, likes), and conversion (e.g., ROI, conversion rate). The data should be segmented by campaign, channel, audience, content, objective, and date. For example, include the number of impressions and clicks for each campaign, or the conversion rate for different objectives.
To analyze Active Campaign data, we should include the following elements in our report:
1) Metrics: Break them down into visibility (e.g., impressions, reach), engagement (e.g., clicks, likes, shares), and conversion metrics (e.g., conversions, sales). For example, we can measure the visibility of an email campaign by tracking the open rate, engagement by the click-through rate, and conversion by the conversion rate.
2) Context: Compare metrics against their associated costs, date ranges, goals, industry rates, and benchmarks. For instance, we can analyze the cost per conversion of different campaigns to identify the most cost-effective ones within a specific date range. Additionally, comparing the click-through rate with industry benchmarks helps us evaluate the email campaign’s performance objectively.
3) Segmentation: Segment data by campaign, channel, audience, content, objective, and date. For instance, we can analyze the performance of different email campaigns targeting different customer segments, such as new customers versus existing ones. We can also compare the performance of campaigns across various channels, like email, social media, or SMS.
By including these elements and following this framework, we can generate a concise and informative Active Campaign report.
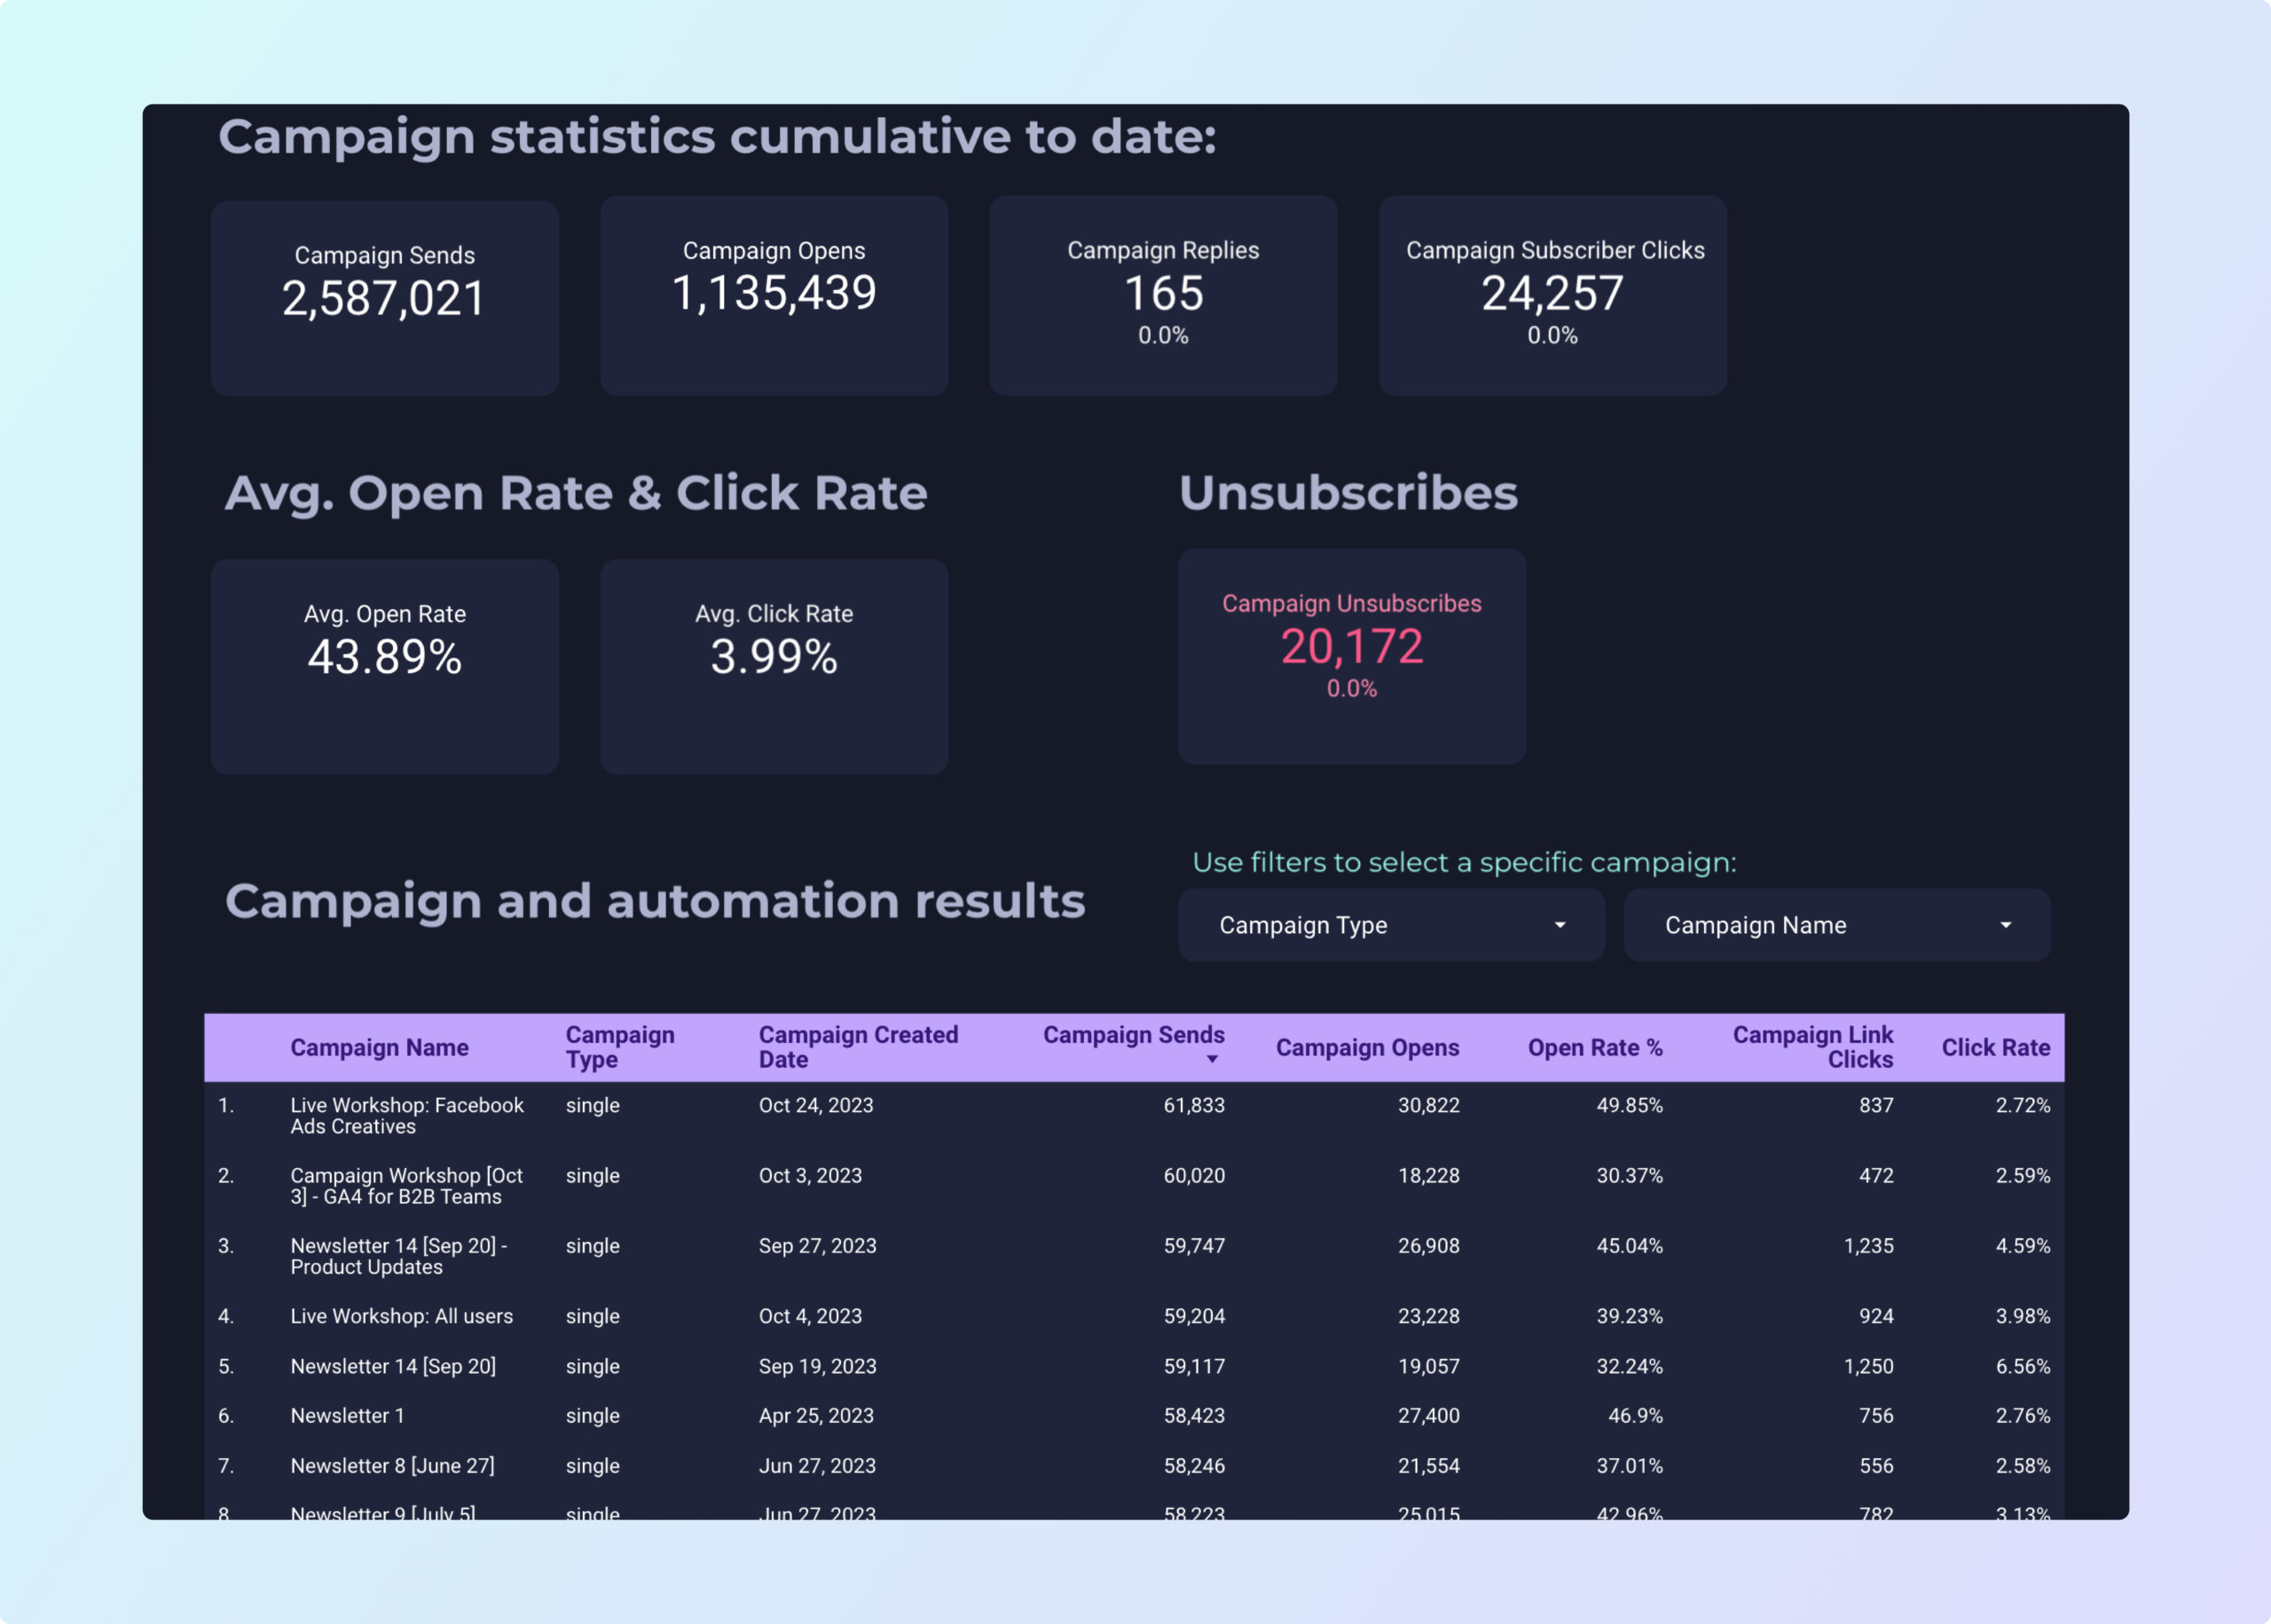
To build an ActiveCampaign dashboard, 1) connect your ActiveCampaign data and accounts. 2) Choose metrics such as open rate, click-through rate, and conversion rate to monitor performance. 3) Segment your data by campaign, channel, audience, product, customer content, objective, and date for a detailed analysis. 4) Add filters or buttons like ‘Campaign Type’ or ‘Date Range’ to make your report interactive. 5) Share your dashboard via PDF, scheduled emails, or links for easy access and review.
An ActiveCampaign dashboard is a visual tool that displays key marketing metrics and KPIs from ActiveCampaign, a customer experience automation platform. It is significant for businesses as it helps in tracking marketing performance, identifying trends, and making data-driven decisions. Tools like Looker Studio are commonly used to create such dashboards, which typically include elements like email campaign performance, customer engagement metrics, and sales data. Real-time data monitoring is crucial as it allows businesses to respond quickly to changes. For learning how to create a marketing dashboard using Looker Studio, visit our YouTube channel: https://www.youtube.com/@porter.metrics.
Yes, Looker Studio allows you to download your report as a PDF. To do it, follow these steps:
Before downloading your report choose the date range you want to visualize on your report.
Click on the “File” menu at the top left corner of the screen.
Select “Download as” from the drop-down menu and choose “PDF.”
You can choose which pages you want to download, and also you can add a password to protect the report and add a link back to the online report.
Click on “Download” to save the report on your device.


 ActiveCampaign
 Impressions