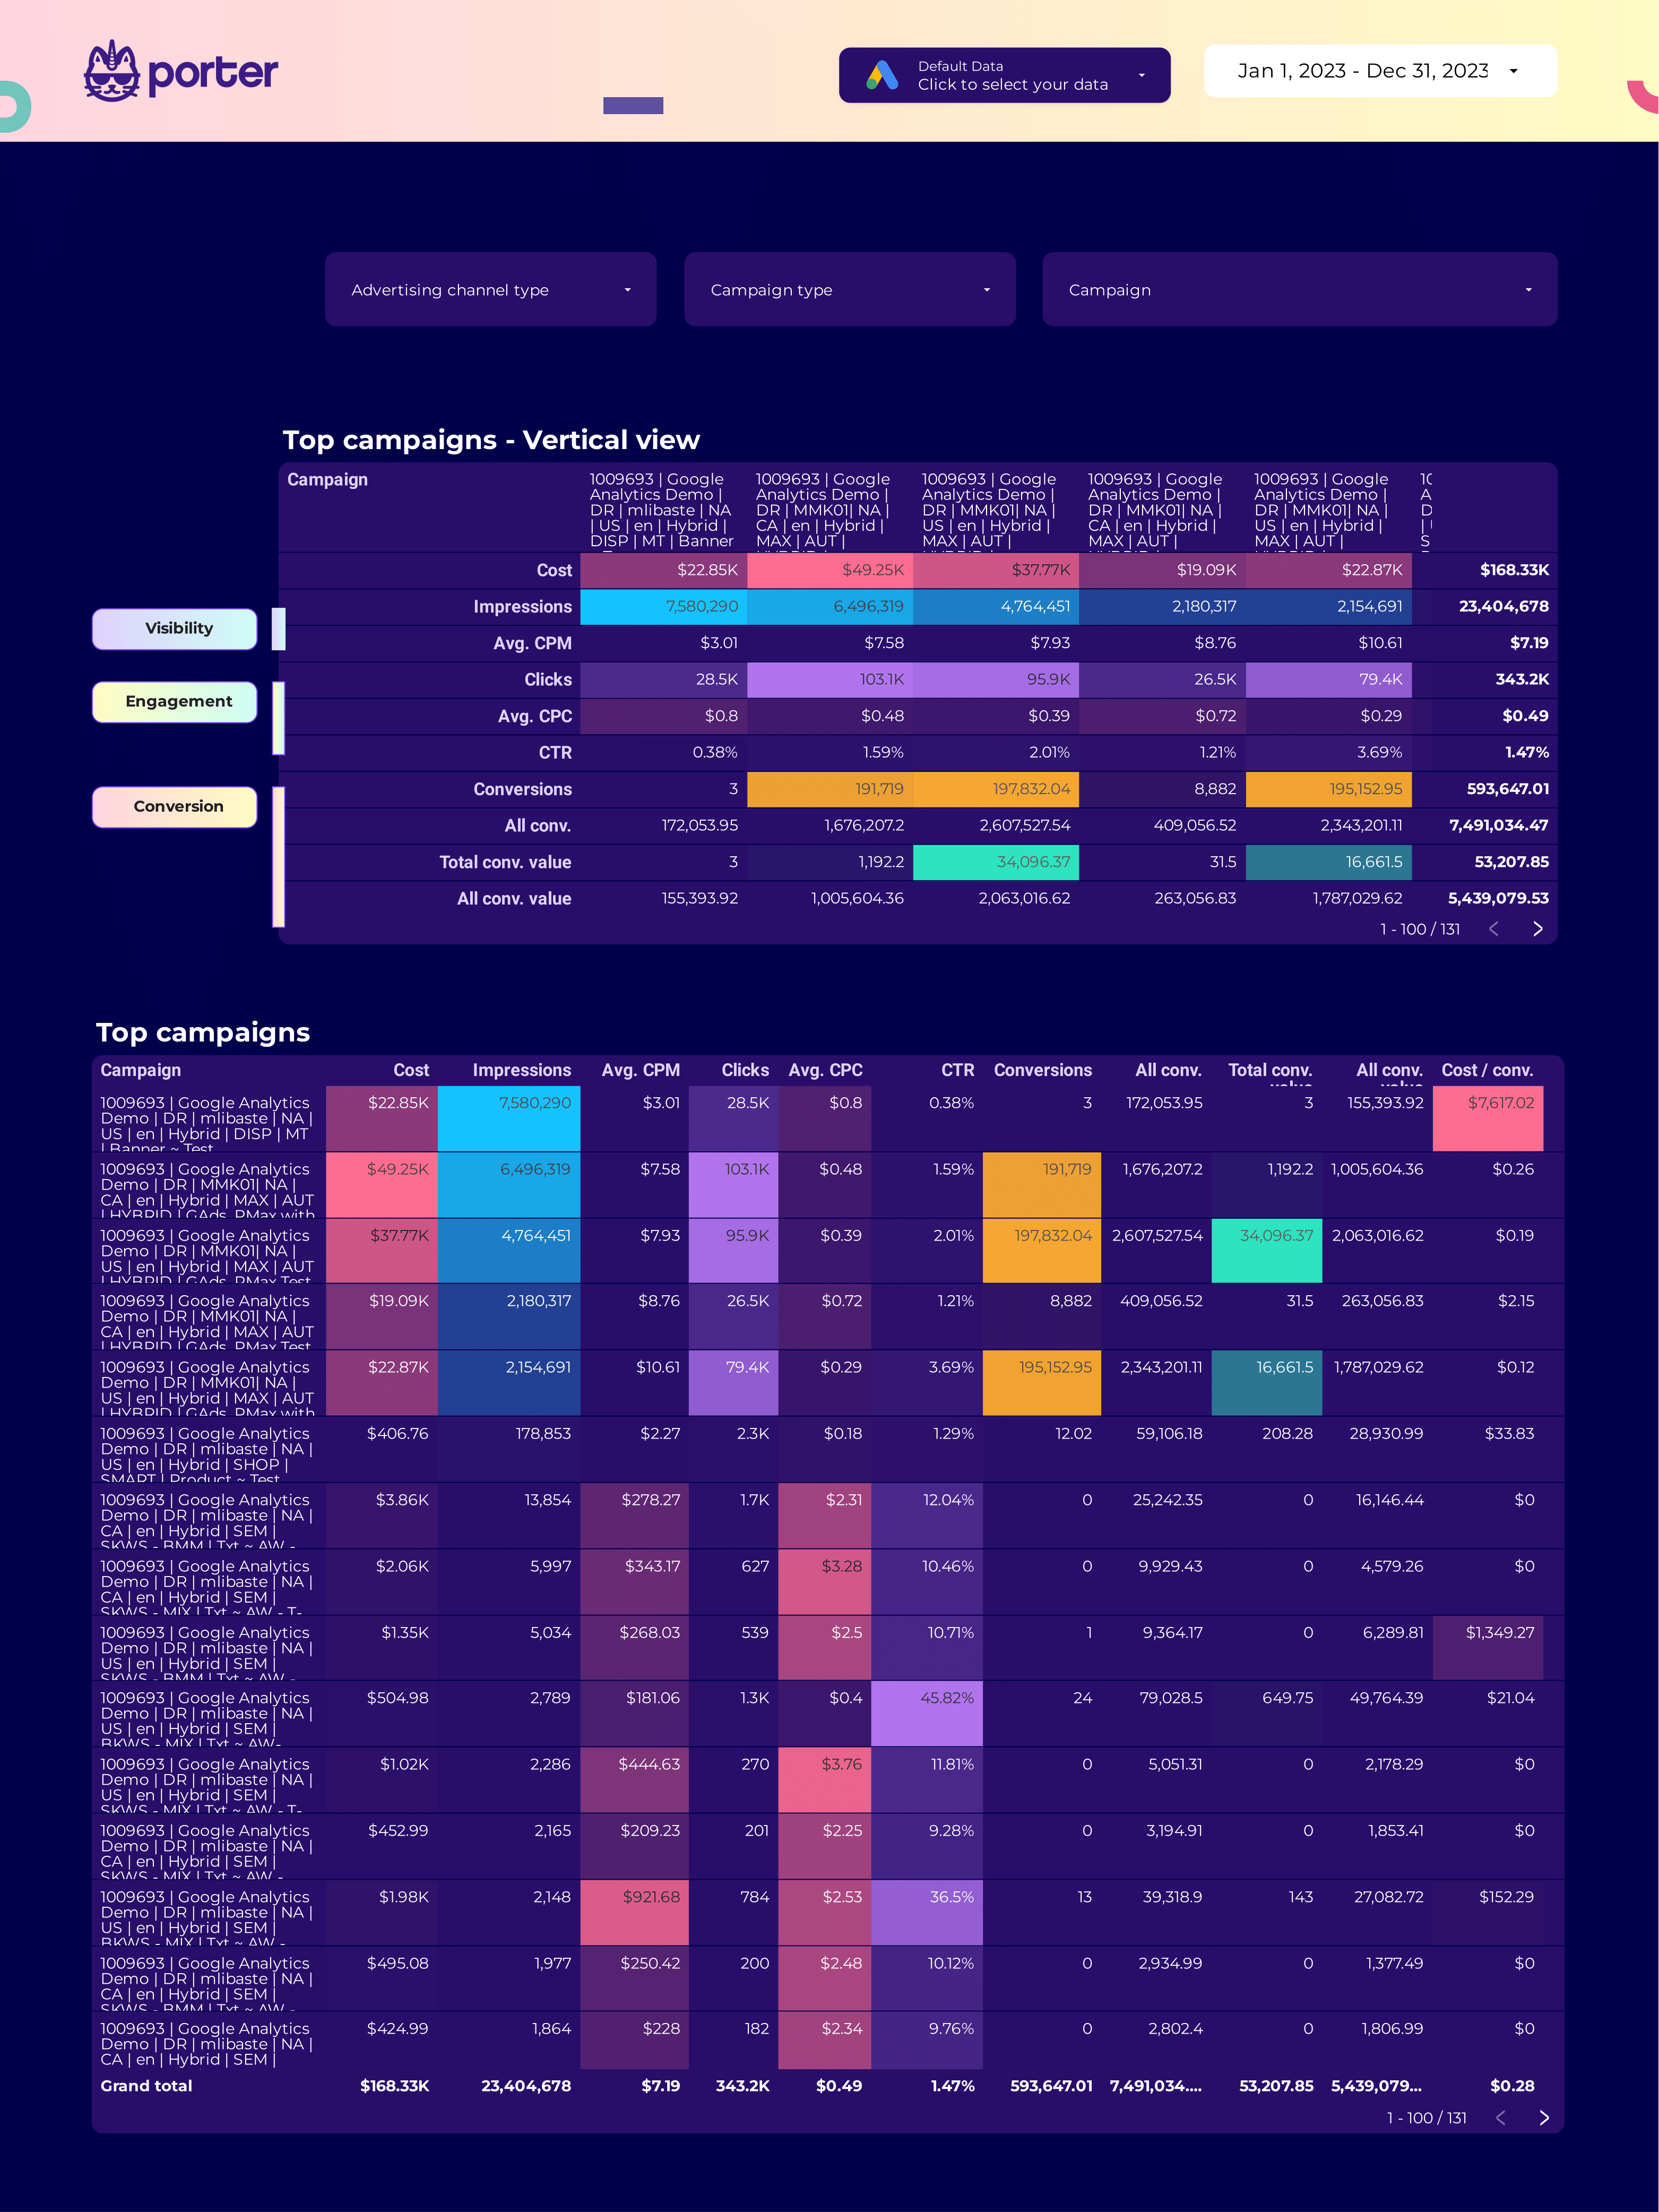
A SEM report should include breaking down metrics by visibility, engagement, and conversion metrics. It should segment data by campaign, channel, audience, content, objective, and date to provide a comprehensive analysis. For example, visibility metrics like impressions and clicks can indicate the reach of campaigns. Engagement metrics such as average session duration and bounce rate can measure user interaction. Conversion metrics like conversion rate and ROI can be used to evaluate campaign effectiveness.
To analyze the data, follow these steps:
1) Choose metrics: For visibility, track impressions, reach, and click-through rates. For engagement, measure likes, shares, and comments. For conversion, monitor conversion rates, ROI, and lead generation.
2) Add context: Compare metrics against the campaign costs, date range, and set goals. Compare rates to industry benchmarks. For example, compare the click-through rate against the industry average to understand the campaign’s performance.
3) Segment data: Break down data by campaign performance, channel effectiveness, audience demographics, content performance, objectives, and date. For instance, analyze data for a specific campaign to determine its effectiveness across different channels or identify the audience segments with the highest conversion rates.
To build a SEM dashboard, 1) connect your Google Ads and Analytics accounts. 2) Select metrics such as click-through rate, cost per click, and conversion rate to monitor performance. 3) Segment data by campaign, channel, audience, product, customer content, objective, and date for detailed insights. 4) Add filters for keywords, ad groups, or geographic location to make your report interactive. 5) Share your dashboard via PDF, scheduled emails, or links for easy access and review.
A SEM (Search Engine Marketing) dashboard is a tool that visualizes and tracks the performance of a company’s search engine marketing efforts, providing insights into metrics like click-through rates, cost per click, and conversion rates. It is significant for businesses as it helps in making data-driven decisions, optimizing campaigns, and improving ROI. Tools like Looker Studio, Google Analytics, and SEMrush are commonly used to create these dashboards, which typically include key elements like traffic sources, keyword performance, and ad spend. Real-time data monitoring is crucial as it allows for immediate adjustments and improvements. For learning how to create a marketing dashboard using Looker Studio, check out our YouTube channel: https://www.youtube.com/@porter.metrics.
Yes, Looker Studio allows you to download your report as a PDF. To do it, follow these steps:
Before downloading your report choose the date range you want to visualize on your report.
Click on the “File” menu at the top left corner of the screen.
Select “Download as” from the drop-down menu and choose “PDF.”
You can choose which pages you want to download, and also you can add a password to protect the report and add a link back to the online report.
Click on “Download” to save the report on your device.
 Google Ads
 Impressions

