A Mailchimp Email marketing report should include metrics such as conversion metrics like Conversion Rate, Click-Through Rate (CTR), and Revenue per Email (RPE); engagement metrics like Open Rate, which measures the percentage of recipients who open the email, Click Rate, which indicates the percentage of recipients who clicked on at least one link within the email, and Engagement Over Time, which tracks how engagement metrics change over a specific period; and visibility metrics. Such data should be segmented and filtered by campaign dimensions like Campaign Title, Audience Segment, and Email Content Type; audience details like Audience Demographics, Campaign Engagement, and Content Type; and time periods like by hour, day, week, month, quarter, or year. Once data is ready, make sure to add buttons and filters to make your reports interactive, custom colors and logos to make it white-label, and share via link, PDF, or email so your teams or clients can access it.
To analyze email marketing data from Mailchimp, 1) Choose your metrics and flashes in visibility metrics (such as mail openings), commitment (such as clicks on links) and conversion (as subscriptions performed). 2) Add context comparing costs, rank of dates, objectives, fees and references for this. For example, you can compare the postal opening rate of this week with that of last week. 3) Segmentes the data per campaign, channel, audience, content, objective and date. For example, you can segment for product promotion campaigns, email channel, audience of new subscribers, content newsletters, objective of increasing sales and shipping date.
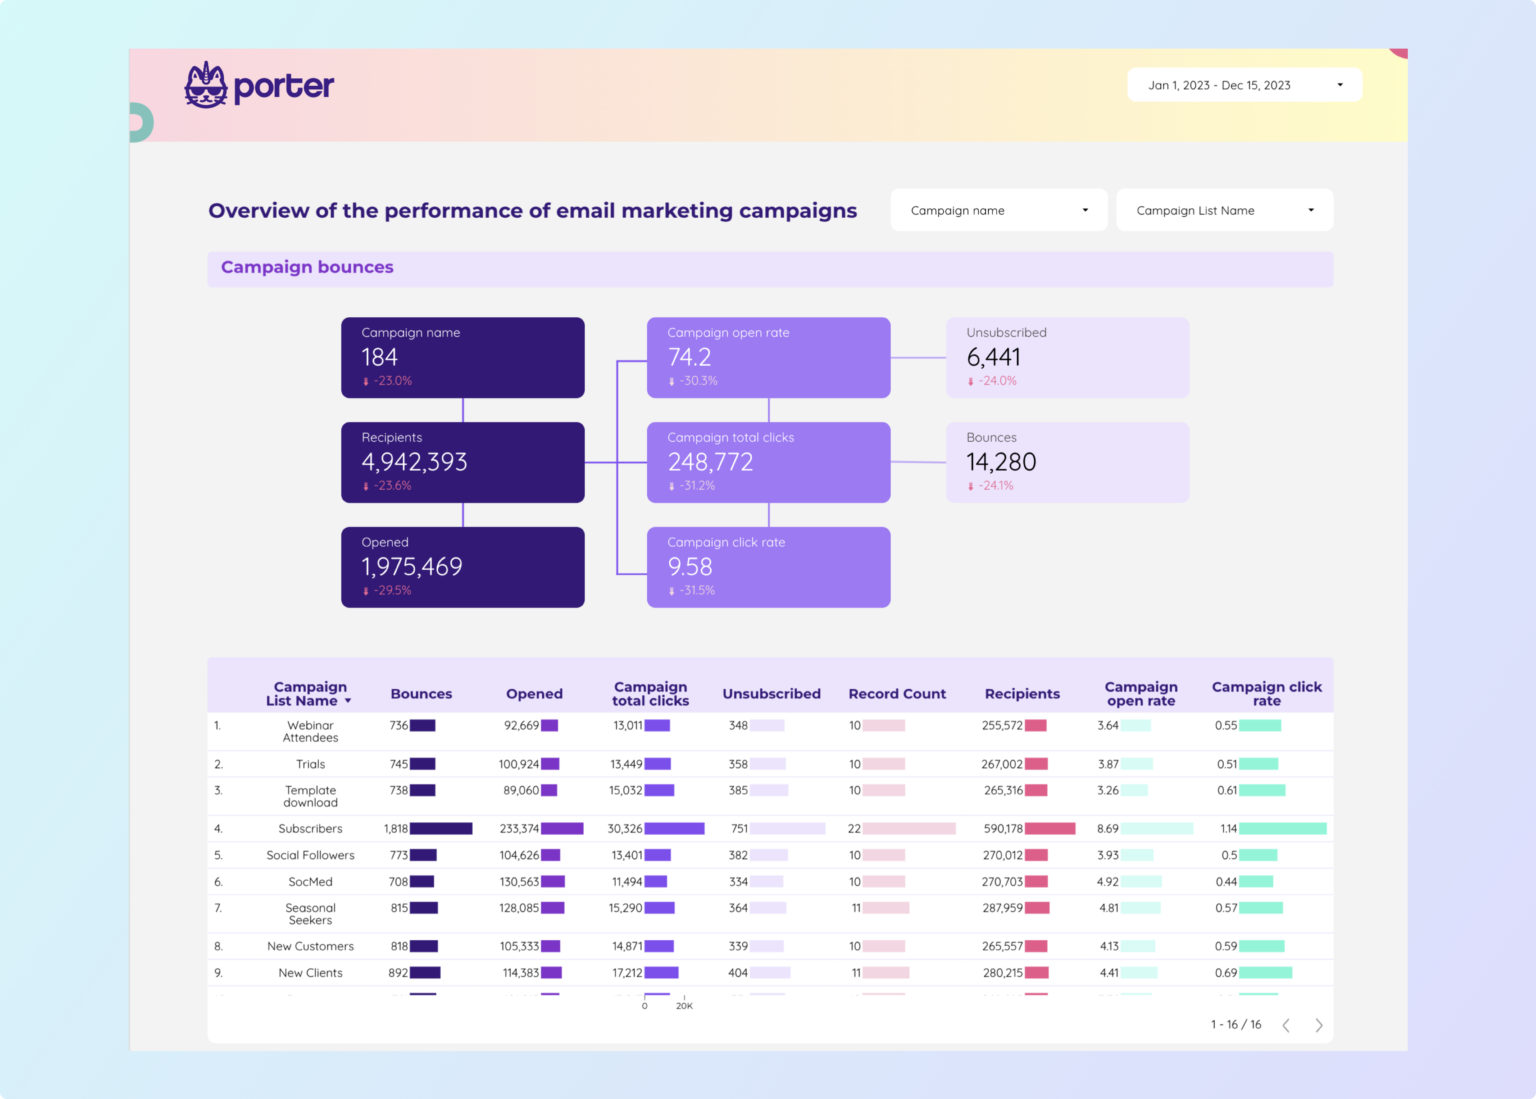
To build a Mailchimp Email marketing dashboard, 1) connect your Mailchimp account and import your email data. 2) Select metrics such as open rate, click-through rate, and bounce rate to monitor performance. 3) Segment your data by campaign, channel, audience, product, customer content, objective, and date for a detailed analysis. 4) Add filters or buttons like ‘Campaign Type’ or ‘Date Range’ to make your report interactive. 5) Share your dashboard via PDF, scheduled emails, or links for easy access.
A Mailchimp Email marketing dashboard is a visual representation of key email marketing metrics, providing businesses with insights into campaign performance, subscriber behavior, and engagement rates. It is significant for businesses as it aids in decision-making, strategy formulation, and performance tracking. Tools like Looker Studio are commonly used to create these dashboards, which typically include elements like open rates, click-through rates, bounce rates, and conversion rates. Real-time data monitoring is crucial as it allows for immediate response to trends or issues. For learning how to create a marketing dashboard using Looker Studio, visit our YouTube channel: https://www.youtube.com/@porter.metrics.
Can I download this template in PDF?


 Impressions
 Open Rate