A LTV report should include metrics breakdown by visibility, engagement, and conversion. For visibility, include metrics like impressions and reach, segmented by campaign, channel, audience, content, objective, and date. For engagement, include metrics such as clicks, likes, comments, and shares, segmented in the same way. Lastly, for conversion, include metrics like conversion rate and revenue generated, also segmented accordingly. Examples of segmented data could be: impressions by campaign and date, likes by audience and content, conversion rate by channel and objective.
To analyze LTV (Lifetime Value) data, start by choosing metrics and breaking them down by visibility, engagement, and conversion metrics. For visibility, use metrics like reach, impressions, and click-through rates. In terms of engagement, measures could include time spent on site, scroll depth, and bounce rates. Conversion metrics can consist of conversion rate, average order value, and customer retention rate.
To add context, compare these metrics against cost, date range, goals, rates, and benchmarks. For example, compare the conversion rate with the cost per acquisition to understand the efficiency of the campaign. Compare the average order value with industry benchmarks to evaluate performance.
Next, segment the data by campaign, channel, audience, content, objective, and date. For instance, analyze the LTV data for specific campaigns, such as a summer sale campaign, and compare it to other campaigns. Segment the data by different channels, like paid search and social media, to identify the most effective channel for LTV. Additionally, segment data by different audiences or customer segments to see variations in LTV. Analyze LTV data based on different content types, such as blog posts or videos, to determine which content drives higher LTV. Finally, analyze how objectives and dates impact LTV, like comparing LTV before and after the launch of a new product or during different time periods.
Overall, the key steps for analyzing LTV data involve choosing metrics, adding context through comparisons, and segmenting the data by various factors such as campaign, channel, audience, content, objective, and date.
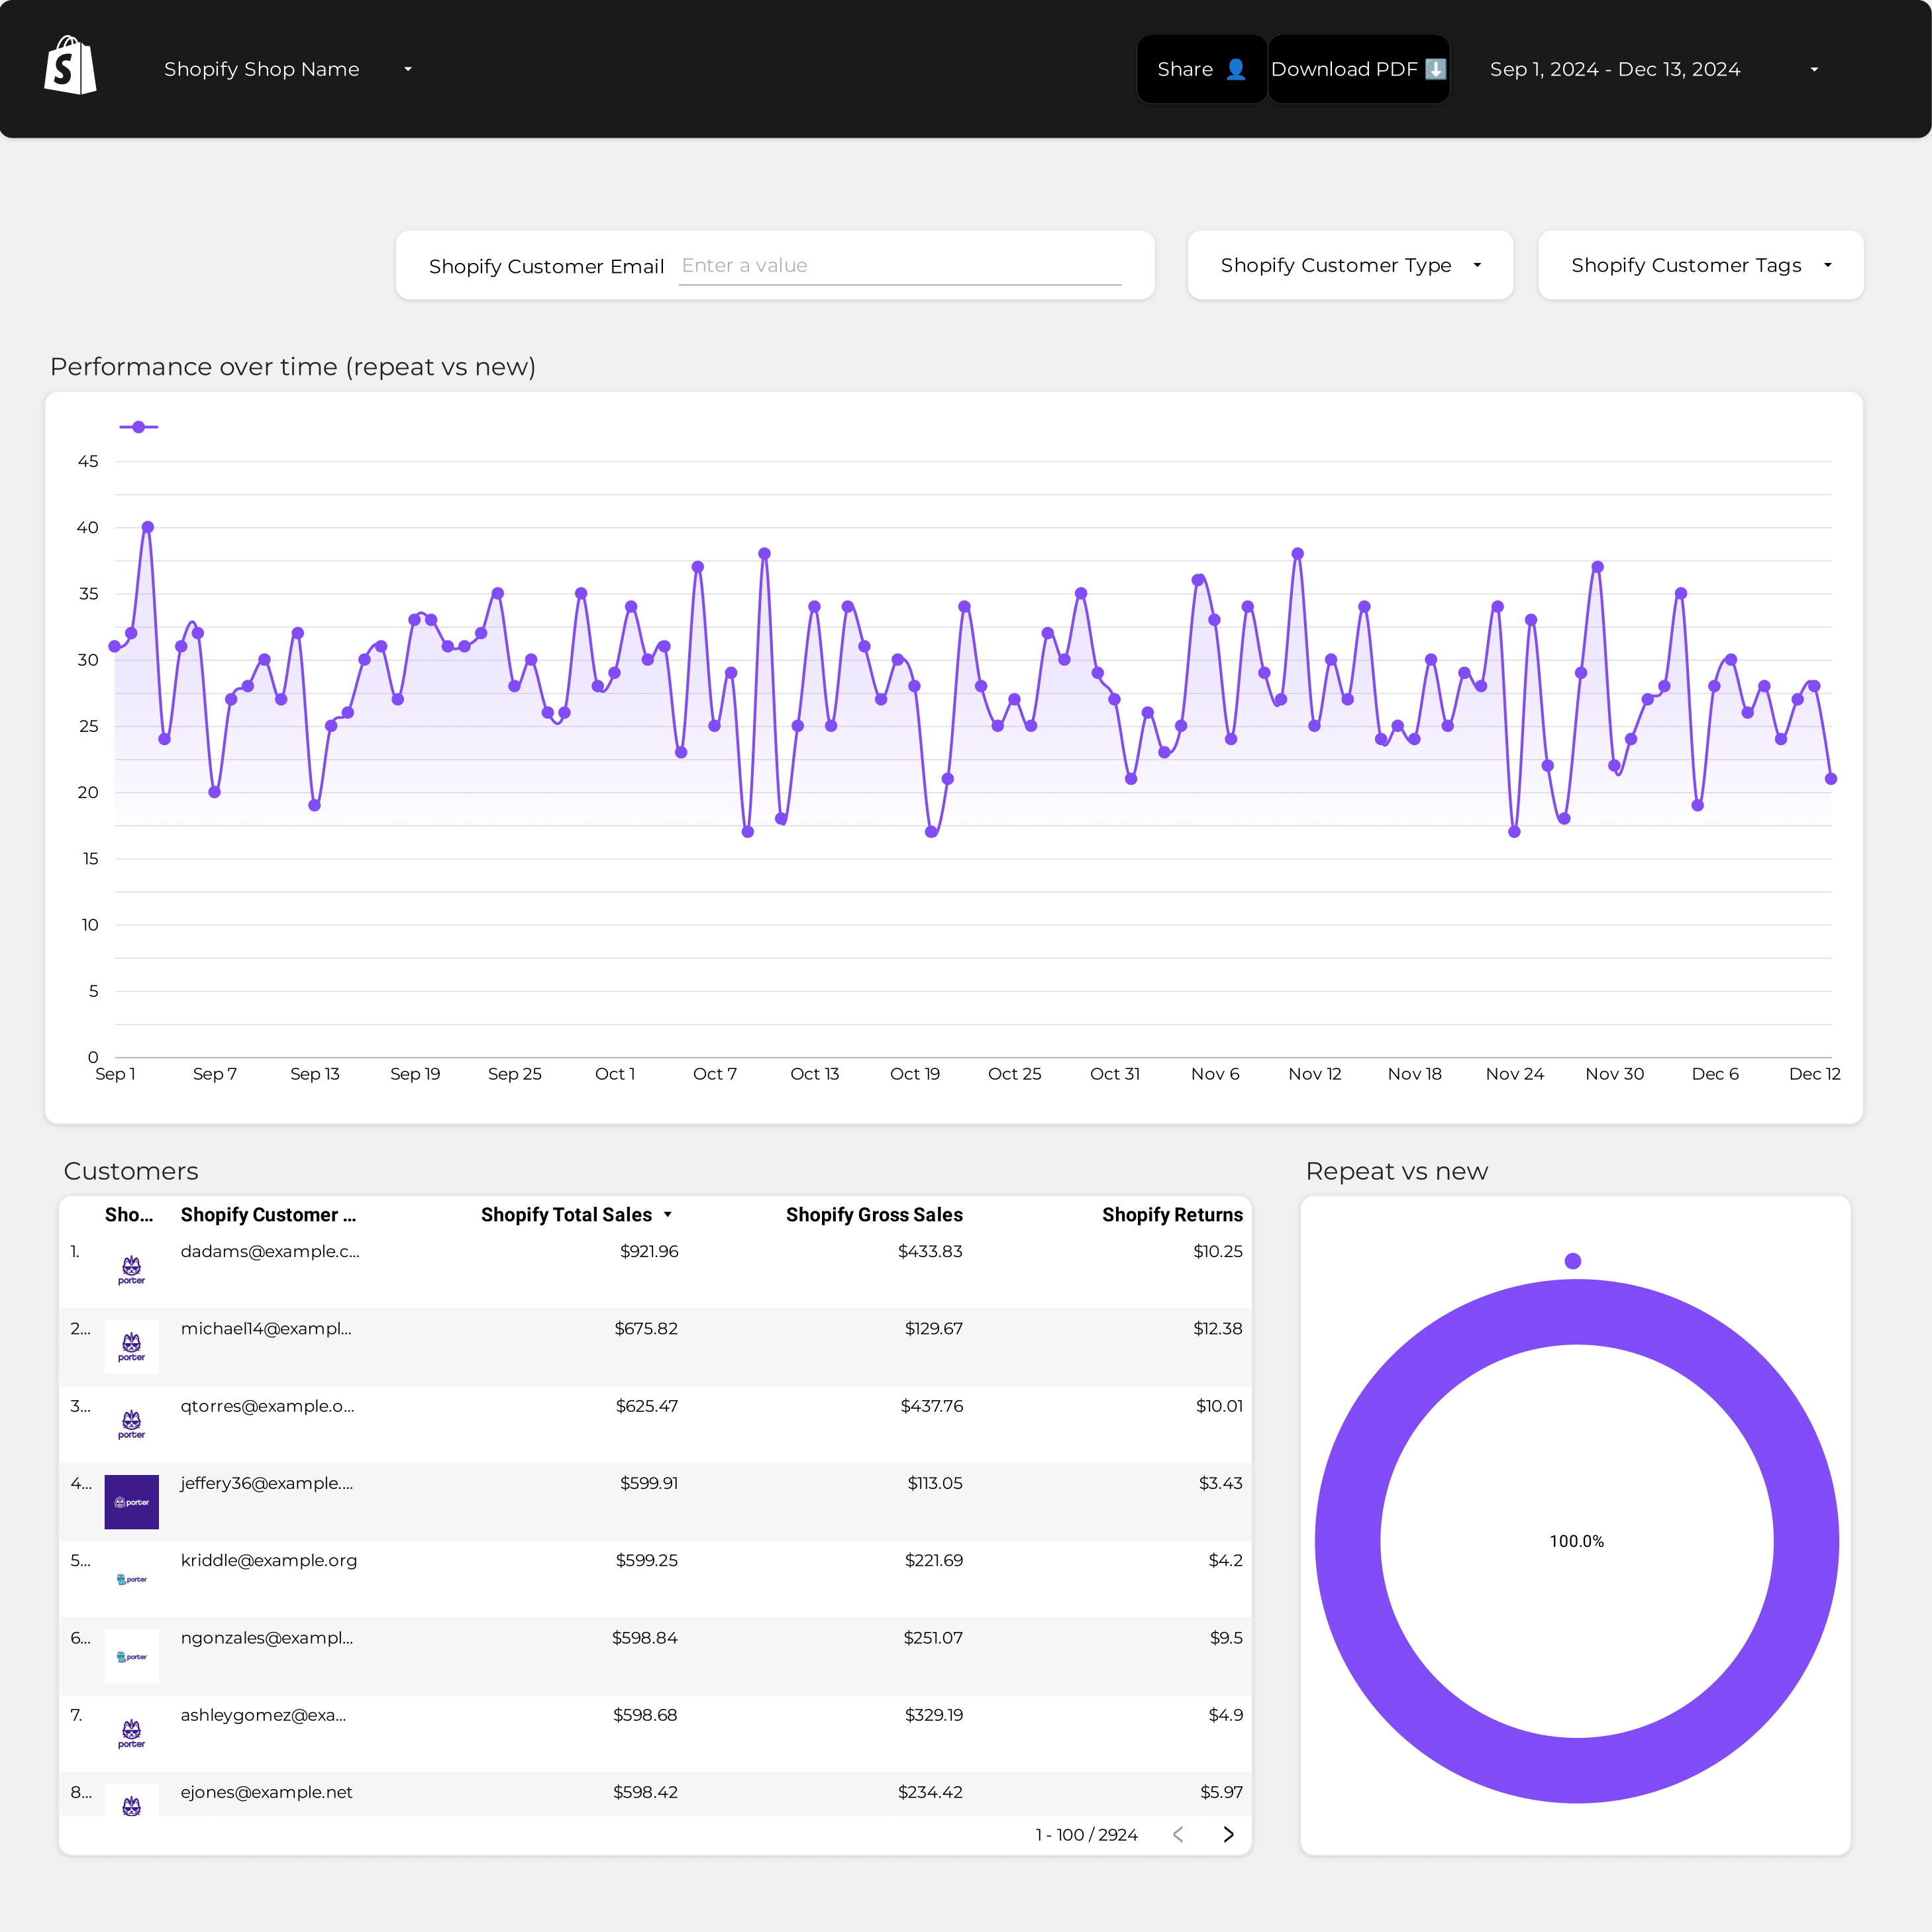
To build a Lifetime Value (LTV) dashboard, 1) connect your CRM and financial accounts to gather customer data and revenue information. 2) Select metrics such as customer acquisition cost, revenue, and retention rate to monitor performance. 3) Segment data by campaign, channel, audience, product, customer content, objective, and date to understand the LTV from different perspectives. 4) Add filters or buttons for parameters like time period, product type, or customer segment to make your report interactive. 5) Share the dashboard via PDF, scheduled emails, or links for easy access and review.
A LTV (Lifetime Value) dashboard is a tool that visualizes the projected revenue a customer will generate during their lifetime with a business, which is crucial for businesses to understand customer profitability and inform marketing strategies. Common tools used to create a LTV dashboard include Looker Studio, Tableau, and Power BI, and key elements typically include customer acquisition cost, revenue, churn rate, and retention rate. Real-time data monitoring is important as it allows businesses to make timely decisions based on current customer behavior. For a detailed guide on creating a marketing dashboard using Looker Studio, visit our YouTube channel: https://www.youtube.com/@porter.metrics.
Can I download this template in PDF?


 Ad Spend
 Sales
Sales